Advanced Search
Volume 40 Issue 3
Jun.  2022
Turn off MathJax
Article Contents

JI XueGua, TAO LiYun, HUANG HeQing. Numerical Simulation of Flow and Deposition of Sudden Release Turbidity on Different Slope Breaks[J]. Acta Sedimentologica Sinica, 2022, 40(3): 730-738. doi: 10.14027/j.issn.1000-0550.2020.053
Citation: JI XueGua, TAO LiYun, HUANG HeQing. Numerical Simulation of Flow and Deposition of Sudden Release Turbidity on Different Slope Breaks[J]. Acta Sedimentologica Sinica, 2022, 40(3): 730-738. doi: 10.14027/j.issn.1000-0550.2020.053

Numerical Simulation of Flow and Deposition of Sudden Release Turbidity on Different Slope Breaks

doi: 10.14027/j.issn.1000-0550.2020.053
Funds:

National Natural Science Foundation of China 40972086, 41172103, 4137071

  • Received Date: 2020-01-23
  • Rev Recd Date: 2020-11-12
  • Publish Date: 2022-06-10
  • This work studied the flow and deposition of sudden-release turbidity currents with equal initial volume passing over different slope breaks by applying the Bussinesq-assumption adopted RANS model. The following main conclusions are obtained: the growth rate of the current velocity becomes slower with the bed slope increasing due to the enhancement of entrainment; the depth-averaged speed and concentration are similar in that they are big at head and linear decreasing towards the tail. Deposit occurs at the small slope break, the thickest deposition is not far from the slope break, the average particle size of the upstream and downstream is not much different, and toward the downstream thickness decreases linearly. Erosion occurs at larger slope break. With slope increasing this erosion deepens and deposition happens further from the slope break and the average particle diameter of the upstream and downstream varies greatly, and the deposition is arched in shape. These understandings have a certain reference role in predicting the formation environment according to the characteristics of turbid current deposition.
  • [1] Ottolenghi L, Adduce C, Roman F, et al. Analysis of the flow in gravity currents propagating up a slope[J]. Ocean Modelling, 2017, 115: 1-13.
    [2] Middleton G V. Sediment deposition from turbidity currents[J]. Annual Review of Earth and Planetary Sciences, 1993, 21: 89-114.
    [3] Meiburg E, Kneller B. Turbidity currents and their deposits[J]. Annual Review of Fluid Mechanics, 2010, 42: 135-156.
    [4] Dai A. Experiments on gravity currents propagating on different bottom slopes[J]. Journal of Fluid Mechanics, 2013, 731: 117-141.
    [5] Inman D L, Nordstrom C E, Flick R E. Currents in submarine canyons: An air-sea-land interaction[J]. Annual Review of Fluid Mechanics, 1976, 8: 275-310.
    [6] Khripounoff A, Vangriesheim A, Babonneau N, et al. Direct observation of intense turbidity current activity in the Zaire submarine valley at 4000 m water depth[J]. Marine Geology, 2003, 194(3/4): 151-58.
    [7] De Cesare G, Schleiss A, Hermann F. Impact of turbidity currents on reservoir sedimentation[J]. Journal of Hydraulic Engineering, 2001, 127(1): 6-16.
    [8] 饶孟余,钟建华,赵志根,等. 浊流沉积研究综述和展望[J]. 煤田地质与勘探,2004,32(6):1-5.

    Rao Mengyu, Zhong Jianhua, Zhao Zhigen, et al. Overview and prospect on study of turbidity deposits[J]. Coal Geology & Exploration, 2004, 32(6): 1-5.
    [9] 李东海. 深水异地沉积与油气勘探[J]. 江汉石油学院学报,2002,24(1):5-7,25.

    Li Donghai. Allogene deposits in deep-water and hydrocarbon exploration[J]. Journal of Jianghan Petroleum Institute, 2002, 24(1): 5-7, 25.
    [10] 李克永. 鄂尔多斯盆地南部不同类型浊积岩与油藏关系[J]. 西安科技大学学报,2018,38(4):620-628.

    Li Keyong. Relationship between different tubidite and oil reservoir in southern Ordos Basin[J]. Journal of Xi’an University of Science and Technology, 2018, 38(4): 620-628.
    [11] Lambert A M, Kelts K R, Marshall N F. Measurements of density underflows from Walensee, Switzerland[J]. Sedimentology, 1976, 23(1): 87-105.
    [12] Chikita K. A field study on turbidity currents initiated from spring runoffs[J]. Water Resources Research, 1989, 25(2): 257-271.
    [13] Xu J P, Noble M A, Rosenfeld L K. In‐situ measurements of velocity structure within turbidity currents[J]. Geophysical Research Letters, 2004, 31(9): L09311.
    [14] Mutti E, Ricci Lucchi F. Le torbiditi dell'appennino settentrionale: Introduzione all'analisi di facies[J]. Memorie della Societa Geologica Italiana, 1972, 11: 166-199.
    [15] Normark W R. Fan valleys, Channels, and depositional lobes on modern submarine fans: Characters for recognition of sandy turbidite environments[J]. AAPG Bulletin, 1978, 62(6): 912-931.
    [16] Cant D J, Walker R G. Fluvial processes and facies sequences in the sandy braided South Saskatchewan River, Canada[J]. Sedimentology, 1978, 25(5): 625-648.
    [17] 袁静,谢君,董志芳,等. 山东省灵山岛早白垩世莱阳群沉积特征及演化模式[J]. 中国石油大学学报(自然科学版),2019,43(5):53-64.

    Yuan Jing, Xie Jun, Dong Zhifang, et al. Sedimentary characteristics and evolution model of Laiyang Group in Early Cretaceous of Lingshan Island, Shandong province[J]. Journal of China University of Petroleum, 2019, 43(5): 53-64.
    [18] Surpless K D, Ward R B, Graham S A. Evolution and stratigraphic archiecture of marine slope gully complexes: Monterey Formation (Miocene), Gaviota Beach, California[J]. Marine and Petroleum Geology, 2009, 26(2): 269-288.
    [19] 赵月霞,刘保华,李西双,等. 东海陆坡海底峡谷—扇体系沉积特征及物质搬运[J]. 古地理学报,2011,13(1):119-126.

    Zhao Yuexia, Liu Baohua, Li Xishuang, et al. Sedimentary characters and material transportation of submarine canyon-fan systems in slope of the East China Sea[J]. Journal of Palaeogeography, 2011, 13(1): 119-126.
    [20] Hallworth M A, Phillips J C, Huppert H E, et al. Entrainment in turbulent gravity currents[J]. Nature, 1993, 362(6423): 829-831.
    [21] Huppert H E, Simpson J E. The slumping of gravity currents[J]. Journal of Fluid Mechanics, 1980, 99(4): 785-799.
    [22] Hacker J, Linden P F, Dalziel S B. Mixing in lock-release gravity currents[J]. Dynamics of Atmospheres and Oceans, 1996, 24(1/2/3/4): 183-195.
    [23] Gladstone C, Phillips J C, Sparks R S J. Experiments on bidisperse, constant-volume gravity currents: Propagation and sediment deposition[J]. Sedimentology, 1998, 45(5): 833-843.
    [24] Gladstone C, Woods A W. On the application of box models to particle-driven gravity currents[J]. Journal of Fluid Mechanics, 2000, 416: 187-195.
    [25] 刘忠保,龚文平,王新海,等. 洪水型浊流砂体形成及分布的沉积模拟实验[J]. 石油与天然气地质,2008,29(1):26-30,37.

    Liu Zhongbao, Gong Wenping, Wang Xinhai, et al. Sedimentation simulation texts on formation and distribution of flood turbidity sandbodies[J]. Oil & Gas Geology, 2008, 29(1): 26-30, 37.
    [26] Kane I A, McCaffrey W D, Peakall J, et al. Submarine channel levee shape and sediment waves from physical experiments[J]. Sedimentary Geology, 2010, 223(1/2): 75-85.
    [27] Lesshafft L, Meiburg E, Kneller B, et al. Towards inverse modeling of turbidity currents: The inverse lock-exchange problem[J]. Computers & Geosciences, 2011, 37(4): 521-529.
    [28] Necker F, Härtel C, Kleiser L, et al. High-resolution simulations of particle-driven gravity currents[J]. International Journal of Multiphase Flow, 2002, 28(2): 279-300.
    [29] Necker F, Härtel C, Kleiser L, et al. Mixing and dissipation in particle-driven gravity currents[J]. Journal of Fluid Mechanics, 2005, 545: 339-372.
    [30] Mahdinia M, Firoozabadi B, Farshchi M, et al. Large eddy simulation of lock-exchange flow in a curved channel[J]. Journal of Hydraulic Engineering, 2012, 138(1): 57-70.
    [31] Kyrousi F, Leonardi A, Roman F, et al. Large eddy simulations of sediment entrainment induced by a lock-exchange gravity current[J]. Advances in Water Resources, 2018, 114: 102-118.
    [32] 叶家盛,孙晧,王雅萍,等. 闸门释放重力流的大涡模拟研究[J]. 安徽工业大学学报(自然科学版),2013,30(3):234-239.

    Ye Jiasheng, Sun Hao, Wang Yaping, et al. Research on lock-exchange gravity currents with large eddy simulation[J]. Journal of Anhui University of Technology (Natural Science), 2013, 30(3): 234-239.
    [33] Choi S U, García M H. k-ε turbulence modeling of density currents developing two dimensionally on a slope[J]. Journal of Hydraulic Engineering, 2002, 128(1): 55-63.
    [34] Huang H Q, Imran J, Pirmez C. Numerical model of turbidity currents with a deforming bottom boundary[J]. Journal of Hydraulic Engineering, 2005, 131(4): 283-293.
    [35] Huang H, Imran J, Pirmez C. Numerical modeling of poorly sorted depositional turbidity currents[J]. Journal of Geophysical Research: Oceans, 2007, 112(C1): C01014.
    [36] Huang H Q, Imran J, Pirmez C. Numerical study of turbidity currents with sudden-release and sustained-inflow mechanisms[J]. Journal of Hydraulic Engineering, 2008, 134(9): 1199-1209.
    [37] Huang H Q, Imran J, Pirmez C. The depositional characteristics of turbidity currents in submarine sinuous channels[J]. Marine Geology, 2012, 329-331: 93-102.
    [38] 黄河清. 环境流体力学[M]. 合肥:合肥工业大学出版社,2013.

    Huang Heqing. Environmental fluid mechanics[M]. Hefei: Hefei University of Technology Publishing House, 2013.
    [39] 郭彦英,黄河清. 海底浊流在坡道转换处的流动及沉积的数值模拟[J]. 沉积学报,2013,31(6):994-1000.

    Guo Yanying, Huang Heqing. Numerical simulation of the flow and deposition of turbidity currents with different slope changes[J]. Acta Sedimentologica Sinica, 2013, 31(6): 994-1000.
    [40] El-Gawad S M A, Pirmez C, Cantelli A, et al. 3-D numerical simulation of turbidity currents in submarine canyons off the Niger Delta[J]. Marine Geology, 2012, 326-328: 55-66.
    [41] Wu Y, Lu Y, Sun H, Huang H.. Checking dilute subaqueous density flows from the specific energy diagram[J]. Journal of Hydraulic Research, 2020, 58(2): 283-288.
    [42] Wilcock P R, McArdell B W. Partial transport of a sand/gravel sediment[J]. Water Resources Research, 1997, 33(1): 235-245.
    [43] Garcia M H. Depositing and eroding sediment-driven flows: Turbidity currents[D]. Minneapolis: University of Minnesota, 1990.
    [44] Garcia M, Parker G. Experiments on the entrainment of sediment into suspension by a dense bottom current[J]. Journal of Geophysical Research: Oceans, 1993, 98(C3): 4793-4807.
    [45] Huang H, Tao L, Lu Z, et al. Slope control on ambient fluid entrainment of subaqueous density flows with steady sustained inflows[J]. Journal of Hydraulic Research, 2020, DOI: 10.1080/00221686.2020.1780495 .
    [46] Ellison T H, Turner J S. Turbulent entrainment in stratified flows[J]. Journal of Fluid Mechanics, 1959, 6(3): 423-448.
  • 加载中
通讯作者: 陈斌, bchen63@163.com
  • 1. 

    沈阳化工大学材料科学与工程学院 沈阳 110142

  1. 本站搜索
  2. 百度学术搜索
  3. 万方数据库搜索
  4. CNKI搜索

Figures(7)  / Tables(1)

Article Metrics

Article views(185) PDF downloads(254) Cited by()

Proportional views
Related
Publishing history
  • Received:  2020-01-23
  • Revised:  2020-11-12
  • Published:  2022-06-10

Numerical Simulation of Flow and Deposition of Sudden Release Turbidity on Different Slope Breaks

doi: 10.14027/j.issn.1000-0550.2020.053
Funds:

National Natural Science Foundation of China 40972086, 41172103, 4137071

Abstract: This work studied the flow and deposition of sudden-release turbidity currents with equal initial volume passing over different slope breaks by applying the Bussinesq-assumption adopted RANS model. The following main conclusions are obtained: the growth rate of the current velocity becomes slower with the bed slope increasing due to the enhancement of entrainment; the depth-averaged speed and concentration are similar in that they are big at head and linear decreasing towards the tail. Deposit occurs at the small slope break, the thickest deposition is not far from the slope break, the average particle size of the upstream and downstream is not much different, and toward the downstream thickness decreases linearly. Erosion occurs at larger slope break. With slope increasing this erosion deepens and deposition happens further from the slope break and the average particle diameter of the upstream and downstream varies greatly, and the deposition is arched in shape. These understandings have a certain reference role in predicting the formation environment according to the characteristics of turbid current deposition.

JI XueGua, TAO LiYun, HUANG HeQing. Numerical Simulation of Flow and Deposition of Sudden Release Turbidity on Different Slope Breaks[J]. Acta Sedimentologica Sinica, 2022, 40(3): 730-738. doi: 10.14027/j.issn.1000-0550.2020.053
Citation: JI XueGua, TAO LiYun, HUANG HeQing. Numerical Simulation of Flow and Deposition of Sudden Release Turbidity on Different Slope Breaks[J]. Acta Sedimentologica Sinica, 2022, 40(3): 730-738. doi: 10.14027/j.issn.1000-0550.2020.053
  • 浊流(turbidity currents)是含泥沙水体在重力作用下沿水下斜坡流动的重力流[1]。非稳定沉积体在外力作用下的水下滑坡可形成突然释放型浊流(sudden-release TC),其流动及沉积特性为海洋地质学、海底油气勘探与开采以及海底灾害防护等关注的重点[2-8]。如鄂尔多斯盆地和加利福尼亚文图拉盆地产生的浊流沉积均与海底油气的形成和储集有着密切关系[9-10]

    海底浊流发生的突然性和其对观察设备的破坏性使得野外直接观察浊流的流动较为困难,只测得了少量的海底浊流的流动速度及浓度分布[11-13],更多的是对其沉积特性的观察与描述:通过对沉积的形态、岩相及构造等特点分析得到海底沉积扇相模式,认识到海底峡谷是陆源沉积物向洋底搬运的重要通道,且浊流在其流动过程中会重塑陆架边缘及海底沉积地貌[14-19]

    早期的突然释放型重力流实验研究多为水平渠道上的闸门释放型盐水流,探讨了重力流在水平渠道中滑塌的动力学机理以及其头部运行速度与环境流体卷吸(entrainment)之间的关系,并详细描述了其头部形态以及K-H涡等[20]。近期水平渠道上闸门释放型单粒径与多粒径颗粒的浊流研究表明:砂体发育的规模与其坡度、高度差及流速外界条件有关,高差大、坡度较陡及水位越高,浊流的水动力就比较大,形成的沉积砂体范围和厚度则越大;混合粒径要比单一粒径向前流动的距离要远,沉积厚度在上下游呈现不同的形态分布[21-26]

    随着计算机硬件及计算技术的迅猛发展,浊流的数值模拟取得了丰硕的研究成果。现阶段浊流的直接数值模拟(DNS)及大涡模拟(LES)主要集中在低至中雷诺数(Re ≈ 2 000~200 000)的实验室尺度且水平突然释放型重力流的模拟上,值得注意的是二维LES重力流浊流头部及和环境流体界面处的Kelvin-Helmholtz渦比实验显示的过分发展,需要三维的LES才能获得更加接近实验观察的涡动[27-32]。尽管雷诺平均(RANS)模型在揭示重力流机理和湍流涡动方面有所不足,但却能较好地再现实验室尺度下突然释放型和连续入流型的多种盐水重力流及浊流的厚度、深度平均浓度、头部运行速度等以及单粒径至多粒径浊流的沉积特性等[33-38],并且也在中至大尺度海底浊流的模拟中取得了与实验观察接近的流动及沉积特征[39-40]

    最新的关于连续入流的重力流研究显示,坡度对重力流的流动起着显著的控制作用[41],坡度对突然释放型浊流流动及沉积影响的研究尚且不足。本研究拟通过模拟等量的突然释放型浊流在1°~10°不同坡折渠道中的流动与沉积,探索坡度对突然释放型浊流的控制作用。

  • 模拟对象为采用布辛尼斯克假设的低密度突然释放型浊流,浊流和环境流体一起可看作不可压缩流体,应用如下雷诺平均后的质量及动量方程[35]

    U j x j = 0 (1)
    U i t + ( U i U j ) x j = - P ρ 0 x i + υ t x j ( U i x j ) + ρ - ρ 0 ρ 0 g i (2)

    式中:Ui xi 方向上的雷诺平均速度分量;P为雷诺平均压力;ρρ 0分别为浊流及其环境流体密度;gi 是重力加速度;涡黏度νt 通过浮力项修正的湍流k⁃ε模型确定[34-35]。对于分选差的低密度浊流沉积物,将其分成k个粒径组并假设其随环境流体一同运动的同时在重力方向上有一自由沉降速度Vsk 来模拟。

    C k t + U j - V s k C k x j = x j υ t S c C k x j (3)

    式中:Ck k粒径组沉积物的体积比浓度;δj2 是克罗内克数;Sc是施密特数,本研究中取其值为1。

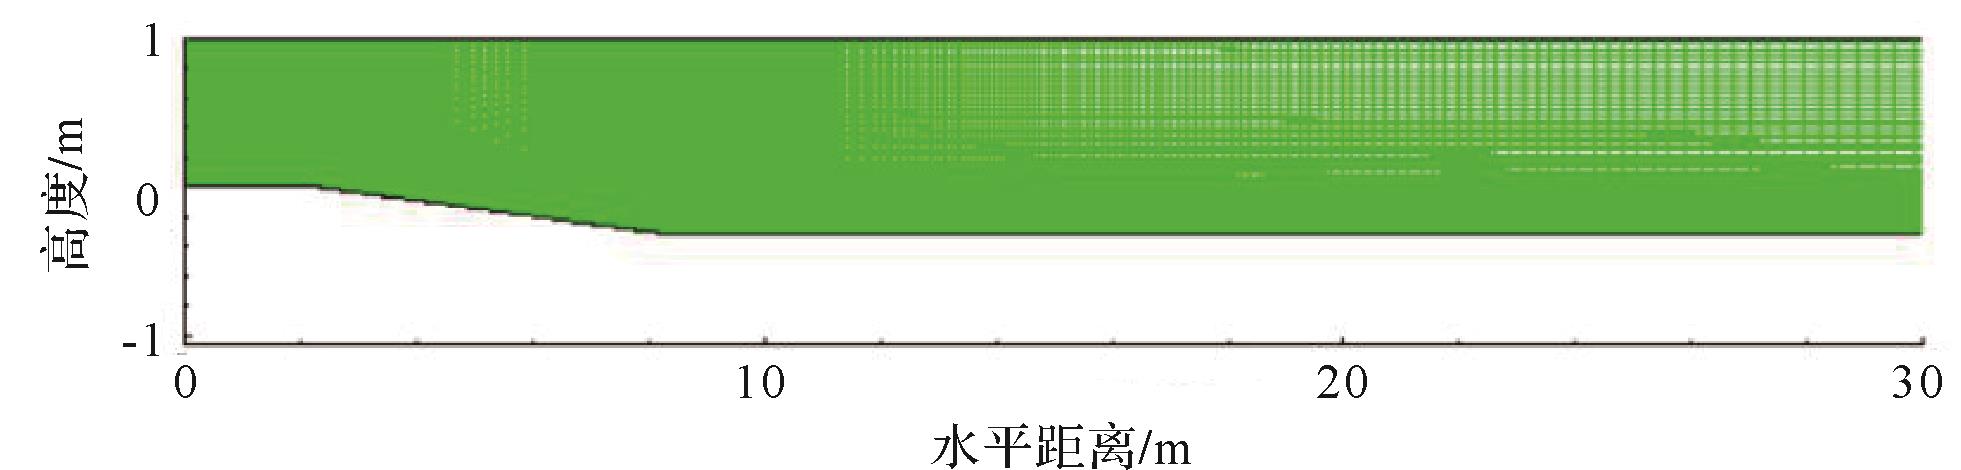
    图1是本研究模拟等量浊流在斜坡上方的闸门释放后沿斜坡及经过波折渠道的流动与沉积的二维渠道示意图。左右边界均设定固体墙面,模拟一定时长的浊流流动,在其流至右边墙面前停止,以防止墙面反射的影响。上部水面作对称界面处理,底部边界对流场应用固体边界的墙面律,假设其粗糙度为入流沉积物的平均粒径,同时以如下的Exner方程(式4)综合考虑各粒径组颗粒的如等号右边第1~3项所分别代表的推移质搬运、沉降及夹带所引起的底部边界的变化[35]

    1 - λ y b k t = F k q b k + C b i V s k - F k E k (4)

    式中:λ为河床物质孔隙率;yb 为底床高度,下标b表示和底床相关的量;推移质搬运通量qb 及沉积物的夹带系数E采用文献[3542]的经验公式计算;Fk k粒径组颗粒在混合层内部的的体积分量,关于模型的详细介绍及各参数的取值与计算请参见模型提出文献[35]。该模型较好地取得了和二维坡折渠道上的具连续入流的浊流实验、水平渠道上的突然释放型浊流实验以及浊流在三维直渠道、弯道渠道内流动及沉积的较为一致的模拟结果[35-37]

    Figure 1.  Geometric diagram (ρ 1: density of the initial turbidity current; ρ 0: density of the environmental fluid; θ: angle of the slope bed)

  • 按原型1∶100的比例缩小的带坡折的突然释放型浊流在二维渠道内流动的模拟设定如图1所示。第一段闸门后左边2.25 m × 1 m的水平段是初始密度为ρ 1的浊流混合悬浮液。其内所含沉积物的比重设为2.65,总体积比浓度为2%,如表1所示,5种不同粒径按由小至大的顺序含量分别为10%、20%、40%、20%和10%。粒径的选择考量了其自由沉降速度满足密度弗雷德数准则[43-44]。紧接着水平坡的后面为水平长度6 m的斜坡连接至一段长度为60 m的水平底坡。

    粒径/μm 6 10 25 35 50
    初始体积比浓度 0.002 0.004 0.008 0.004 0.002
    百分比/% 10 20 40 20 10

    Table 1.  Preset value of uneven sediment particles in the initial mixed suspension

    将研究等量的突然释放浊流在1°、3°、7°、10°四种不同坡折上的流动及沉积。主要通过第一次浊流事件来观察流动特征,通过重复六次等量的突然释放型浊流来模拟自然界多发性浊流事件。每次模拟时长为400 s,其时初始浊流中的沉积物大部分已沉积完毕且可以有效防止墙面反射的影响。

    由自主开发软件SIMUSOFT所智能生成3°坡折网格前30 m如图2所示,网格密度为600 × 60,在浊流流动的底部及2个坡折处都自动加密等比扩展,以捕捉到对应处速度及浓度的较大梯度变化。对低(400×40)、中(600×60)及高(900×90)三种密度网格进行了模拟验证。对比观察60 s时密度云图可见(图3a~c),低密度网格所模拟的浊流流动速度及形态已经和中等密度网格的非常接近,但中等密度网格所模拟的在头部后边的涡形态更接近于高密度网格的;并且,此时由中高密度网格模拟所获得的X = 8.25 m处的断面速度和浓度(图3d,e)更加接近,可认为中密度网格的模拟接近收敛,适用于本研究。

    Figure 2.  Grid for 3° slope break numerical simulation of a sudden⁃release turbidity current

    Figure 3.  Density cloud comparison 60 s after release (a⁃c); 8.25 m cross⁃sectional concentration (d) and velocity (e) from three different grids

  • 本节通过对比突然释放型浊流在1°、3°、7°和10°四种不同坡折渠道上的密度云图、典型剖面浓度、速度以及它们的深度平均量来分析坡度对流动的控制作用,并通过六次浊流事件后的沉积特征分析坡度对沉积的影响。

  • 等量的(2.25 m×1.0 m)突然释放型浊流释放至坡折分别为1°、3°、7°和10°的渠道后在20 s、40 s、100 s时的密度云如图4所示,在斜坡为1°~10°的范围内:浊流头部运行速度与浊流头部高度及上部的卷吸涡随着坡度的增加而增加(图4a,b),这和Gladstone et al.[23-24]在水平渠道内所观察的流量或浓度增加的浊流实验现象类似。同时我们也观察到另一个现象,即浊流速度并不是与坡度的增加呈线性增加,其头部速度的增加有着逐渐减缓的趋势,反映了突然释放性浊流和连续入流型的浊流类似,其环境流体的卷吸(entrainment)也是随着坡度的增加而增加[45],进而会带来阻力的增加,致使浊流头部运行速度随底坡增加的速率减缓。浊流释放后40 s时的浓度云图(图4b)显示,越靠近底部及头部,浊流的密度越高;并且,由于大坡折浊流具有相对较强的卷吸作用,其头部的浓度衰减则更快(图4c)。

    Figure 4.  Density contours of equal⁃volume turbidity currents passing 4 different slope breaks at 20 s (a), 40 s (b), and 100 s (c)

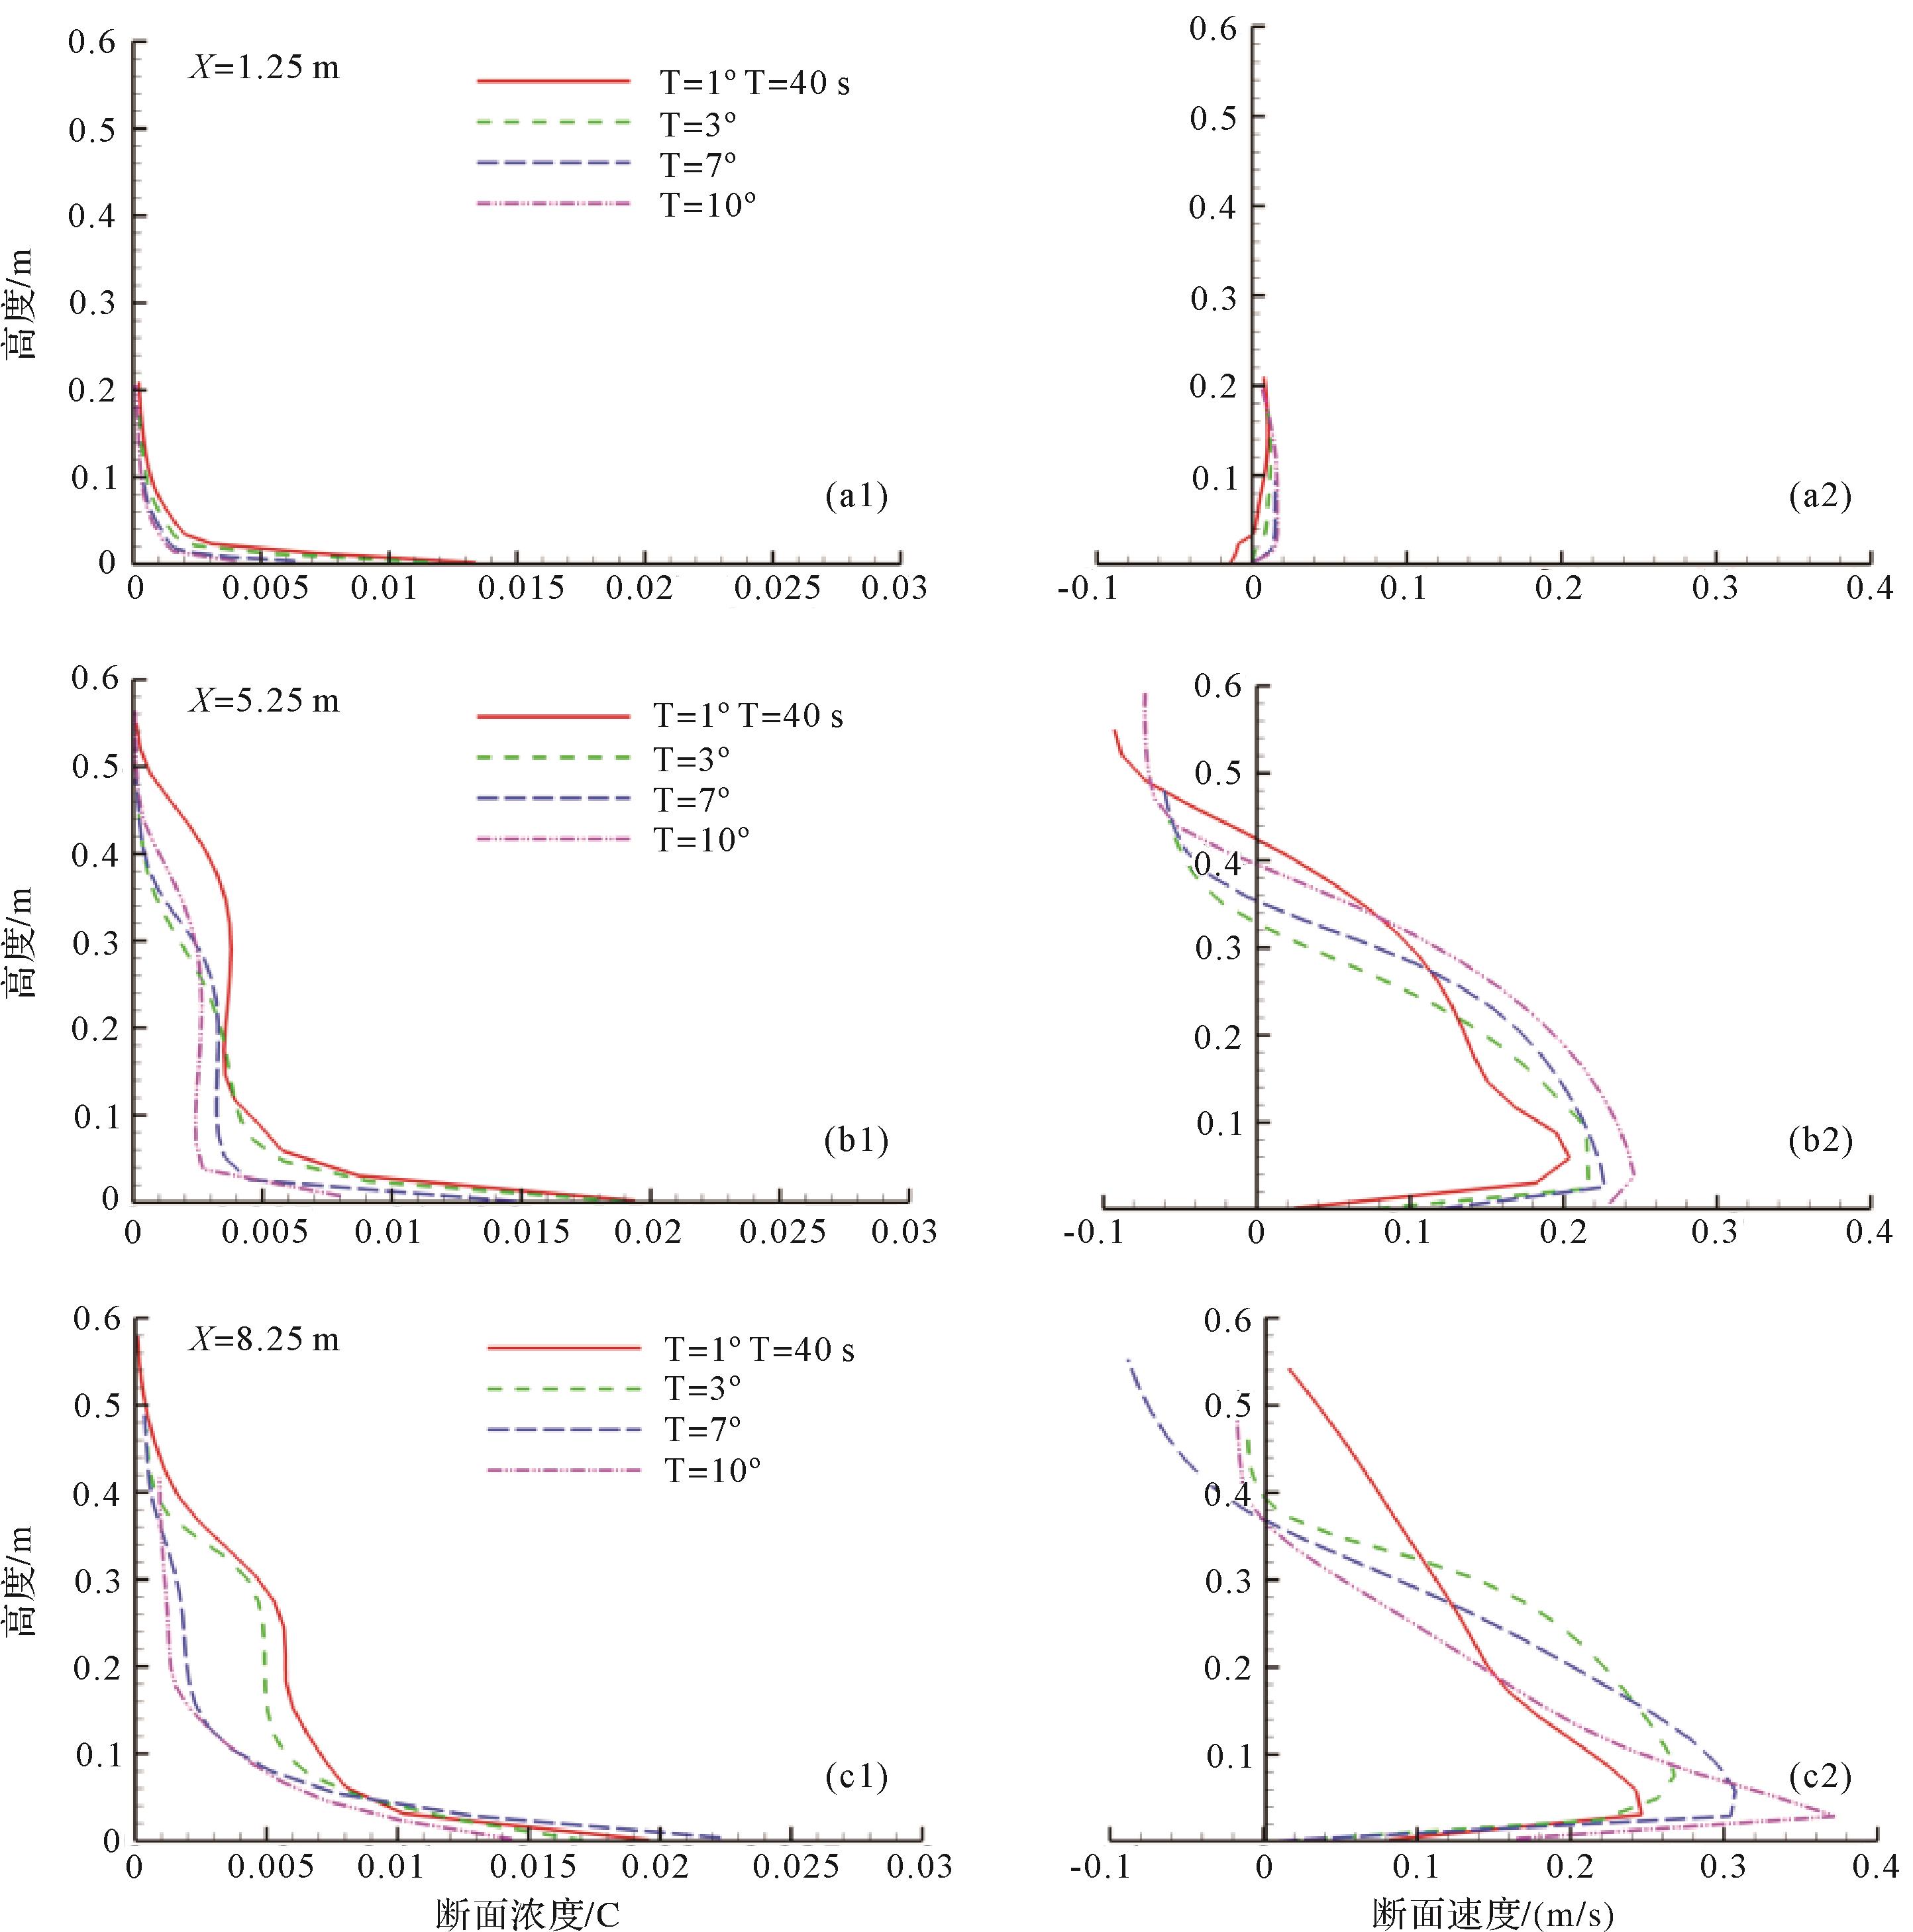
  • 对比浊流释放后40 s(图4b)三个不同断面X = 1.25 m(初始段)、X = 5.25 m (斜坡段)、X = 8.25 m(坡折处)浊流断面速度和浓度图(图5)可见:坡上水平段浊流浓度及速度均衰减快,表明只要有斜坡提供浊流,不论斜坡大小,40 s后浓度及速度都衰减至很小(图5a),这点和连续入流浊流有很大不同[33-35,43-44];浊流头部经过后的尾部的坡上(图5b)及波折处(图5c)垂向断面速度分布和连续入流的浊流类似,在离底部不远处有一极大值,反映了两种不同启动机理(连续注入和突然释放型)的浊流在流动上的本质类似之处,即最大速度之下为壁面剪切层、之上为混合层剪切区[23,38];垂向断面的最大速度随着坡度的增加而增加;垂向断面上存在浓度的密度分层,特别是在底部断面最大流速之下的壁面剪切层内,浓度梯度大;坡度越大,浊流断面浓度相对较低,反映了浊流卷吸作用随着坡度的增加而增强。

    Figure 5.  Concentration and velocity comparison of turbidity currents 40 s after sudden⁃release via 4 different slope breaks at three different cross⁃sections

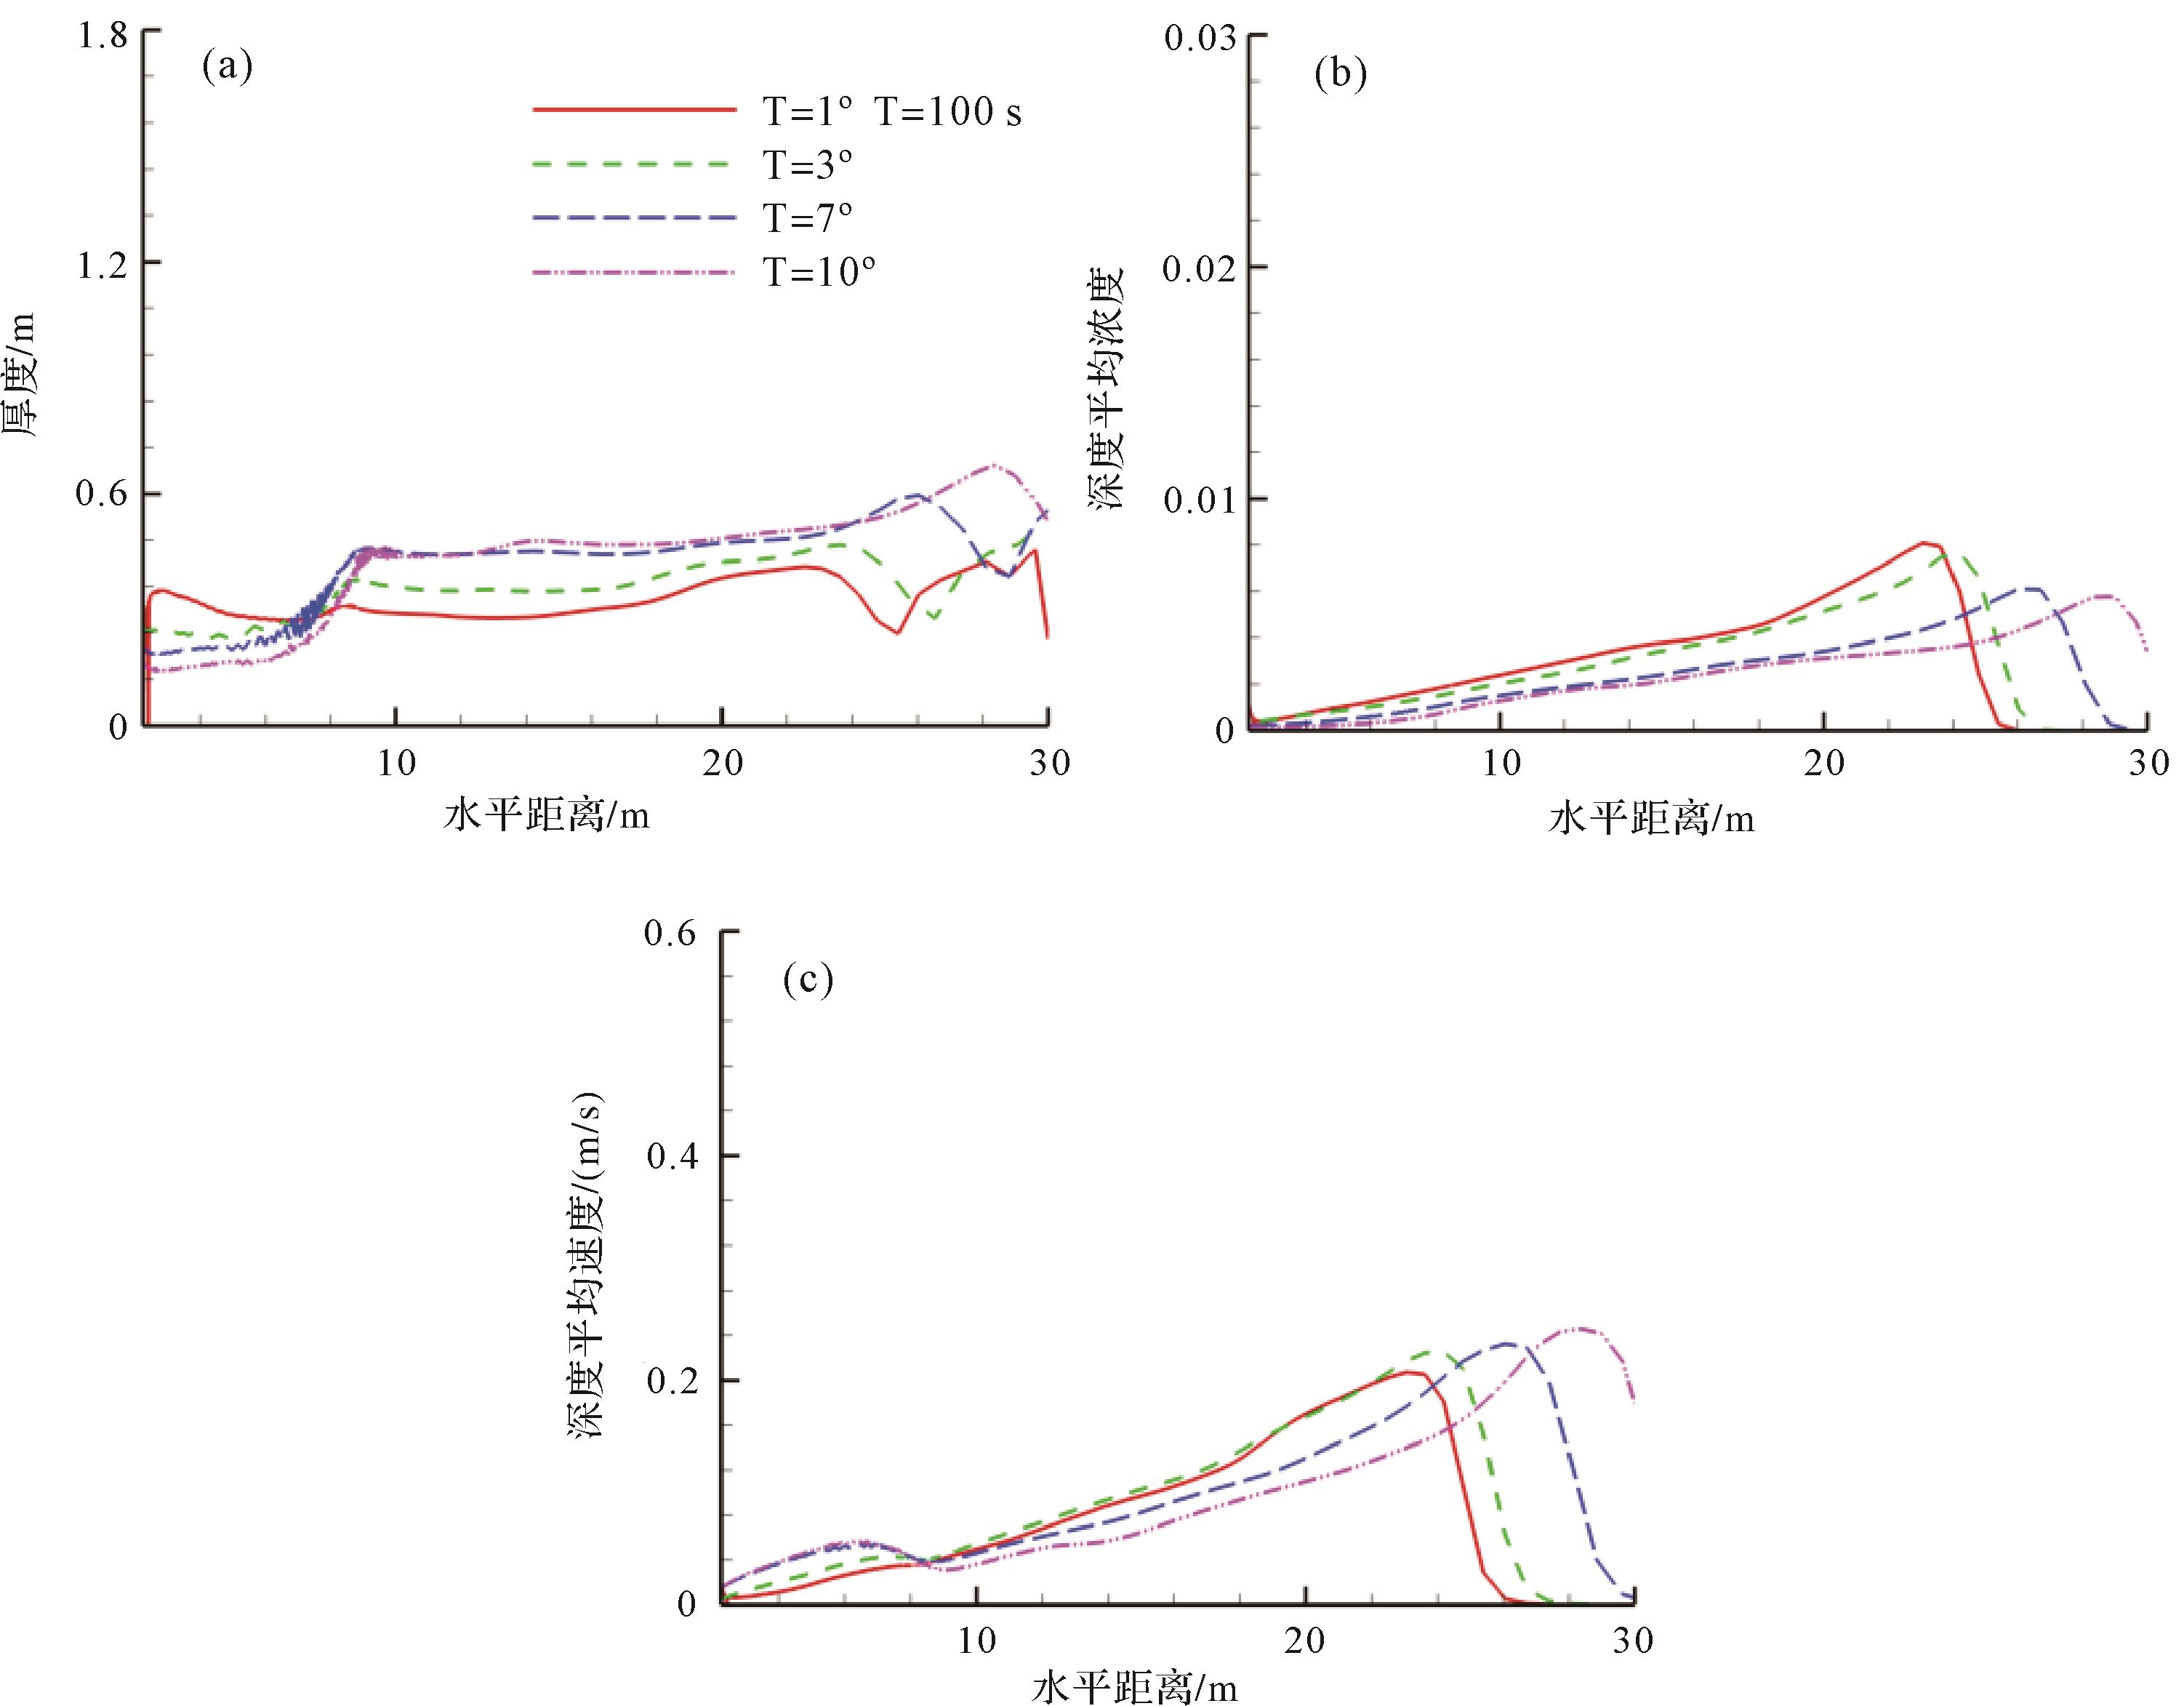
  • 浊流在流动过程中不断地携带环境流体,使浊流与外界没有清晰的分界点,研究者多采用如式5~7所定义的重力流厚度h,深度平均速度 U ¯ 及深度平均浓度 C ¯ 来描述浊流[23,38,46]

    h = 0 U d y 2 0 U 2 d y (5)
    U ¯ = 0 U 2 d y 0 U d y (6)
    C ¯ = 0 U C d y U ¯ h ¯ (7)

    式中:U表示浊流的水平速度,C表示浊流的体积浓度,y为垂直于主流向的方向。

    突然释放型浊流在不同坡折上释放后100 s时的厚度、深度平均速度及浓度如图6所示。可以看出,单个浊流的头部最厚,浊流的厚度随着坡折的增大而增大,但在7度以后增加不明显(图6a);深度平均浓度(图6b)和连续入流型的[43-44]恰相反,头部最高,向尾部接近于线性地下降,坡折影响不明显;另一个特点为坡折小的整体浓度高、坡折大的整体低,这是因为坡度高卷吸强,和图4c的观察一致;单次浊流的深度平均速度形态和深度平均浓度类似,头部高,由头部至尾部近似线性下降(图6c)。

    Figure 6.  The thickness (a), depth⁃averaged concentration (b), and velocity (c) of turbidity currents 100 s after sudden⁃release via 4 different slope breaks

  • 在1°、3°、7°和10°坡折渠道上都重复进行了6次等体积浊流突然释放400 s模拟,通过方程4跟踪记录底床的高度及粒径分布,最后得到浊流在不同波折渠道上的沉积或侵蚀沉积物粒径分布云如图7所示。

    Figure 7.  The average particle diameter deposit contours for six runs of equal⁃volume sudden⁃release turbidity currents on different slope breaks

    可以看出,小坡折(1°、3°)处产生大量沉积,沉积最厚处出现在离坡折不远的下游,其后沉积厚度近线性减小或略呈上凹形;小坡折渠道上沉积的平均粒径上下游差别不大,几近平均粒径,沉积隆起最高处附近稍大些,隐约可见各次浊流沉积底部颗粒大上面小的沉积纹理。大坡折(7°、10°)处有一定的侵蚀,坡折愈大、侵蚀越多,其后才开始大量沉积,其形态和小坡折不同的是呈上拱状,最厚处出现在离坡折更远处(图7d);大坡折浊流沉积的平均粒径分布和小坡折不同之处为上游的较大,往下游逐渐减小,在沉积隆起的各次浊流沉积底部颗粒大、上面小的沉积纹理比小波折的更加清晰明显。

  • 本研究应用雷诺平均纳维尔—斯托克斯模型对低密度等量突然释放型浊流在不同坡折渠道内的流动进行了二维数值模拟,得出如下主要结论:

    (1) 突然释放型浊流的流动速度随着底坡坡度的增加而增加,但随着坡度增大因增强了对环境流体的卷吸作用而减缓了其速度增长率。

    (2) 突然释放型浊流的垂向断面速度和浓度分布与连续入流型浊流有着较高的类似,速度在靠近底部处存在一个最大值,浓度在底部最大,往上指数式地下降,反映了两种入流机制的浊流在受到底部边界层及上部混合层作用方面的一致性。

    (3) 突然释放型浊流的厚度、速度及浓度和连续入流的对比有很大的不同。突然释放型浊流厚度在头部最厚,随着坡度的增加而增加,深度平均速度和浓度形态非常相似,均是头部最大且向尾部呈线性下降。

    (4) 突然释放型浊流的沉积形态在小、大坡折上明显不同。小坡折(1°,3°)上在坡折处产生沉积,沉积最厚处离坡折处不远且上下游平均粒径相差不大;而大坡折(7°,10°)在坡折处遭受侵蚀,随着坡度的增大侵蚀增加,沉积最厚处离坡折处较远且上游平均粒径较下游的明显大。从厚度上观察浊流沉积由最厚处至下游的沉积形态,小坡折呈线性减小或接近上凹形,而大坡折呈上拱状。

Reference (46)

Catalog

    /

    DownLoad:  Full-Size Img  PowerPoint
    Return
    Return