Advanced Search
Volume 39 Issue 2
Apr.  2021
Turn off MathJax
Article Contents

OU ChengHua, LIANG ChengGang, LUO Li, YANG Xiao, LI Dan, LI ZhaoLiang. The Lithofacies Classification and Its Influence on the Gas Production Capacity in the Shale Gas Production Area[J]. Acta Sedimentologica Sinica, 2021, 39(2): 269-280. doi: 10.14027/j.issn.1000-0550.2020.132
Citation: OU ChengHua, LIANG ChengGang, LUO Li, YANG Xiao, LI Dan, LI ZhaoLiang. The Lithofacies Classification and Its Influence on the Gas Production Capacity in the Shale Gas Production Area[J]. Acta Sedimentologica Sinica, 2021, 39(2): 269-280. doi: 10.14027/j.issn.1000-0550.2020.132

The Lithofacies Classification and Its Influence on the Gas Production Capacity in the Shale Gas Production Area

doi: 10.14027/j.issn.1000-0550.2020.132
Funds:

Sichuan Science and Technology Program 2021YFQ0049

National Science and Technology Major Project 2017ZX0503 5003

National Key Basic Research Program of China 2014CB239205

  • Received Date: 2020-05-28
  • Publish Date: 2021-04-23
  • The gas production capacity difference among single wells and the difficulties in sustaining stable production are the key problems faced by shale gas production areas. Based on the typical characteristics of the shale gas production areas, a technical process for the lithofacies classification of high-quality marine shale affected by the gas production capacity was established in this paper. Firstly, for the high-quality marine shale in the shale gas production area, the main gas production capacity difference control factors were analyzed, and the lithofacies classification scheme was determined. Then, using the developed logging calculation model of total organic carbon (TOC) content, porosity, clay, siliceous, and calcareous mineral content, the single well parameter calculation and the lithofacies identification in one shale gas producing area were completed. A total of 10 types of shale lithofacies were identified in one shale gas production area, and the relationship between shale lithofacies type and gas production capacity difference was revealed by comparing the gas content of each lithofacies. Finally, a three-dimensional (3D) lithofacies model in one shale gas production area was established by using the truncated Gaussian simulation algorithm and the sedimentary microfacies confined lithofacies strategies, the spatial distribution characteristics of each kind of lithofacies were shown, and the gas production capacity difference in the Wufeng-Longmaxi black shale in the study area was revealed. At the same time, according to the two conditions of large volume proportion and great gas potential in 3D space, the three different lithofacies with excellent gas production capacity in the study area were determined as i. rich in carbon, high in porosity, calcium, muddy siliceous shale, ii. rich in both carbon and porosity mixed shale, and iii. high in carbon, medium to high in porosity, calcium, muddy siliceous shale. The above results are helpful for explaining the essential causes for the great difference in the decline amplitude and output effect of shale gas production areas, laying a solid theory foundation and technical support for fine production management in shale gas production areas.
  • [1] 赵群,杨慎,王红岩,等. 中国页岩气开发现状及前景预判[J]. 环境影响评价,2019,41(1):6-10.

    Zhao Qun, Yang Shen, Wang Hongyan, et al. China's shale gas development and its prospects[J]. Environmental Impact Assessment, 2019, 41(1): 6-10.
    [2] 王科,李海涛,李留杰,等. 3种常用页岩气井经验递减方法:以四川盆地威远区块为例[J]. 天然气地球科学,2019,30(7):946-954.

    Wang Ke, Li Haitao, Li Liujie, et al. Research on three widely-used empirical decline methods for shale gas wells in Weiyuan block of the Sichuan Basin[J]. Natural Gas Geoscience, 2019, 30(7): 946-954.
    [3] Abouelresh M O, Slatt R M. Lithofacies and sequence stratigraphy of the Barnett Shale in east-central Fort Worth Basin, Texas[J]. AAPG Bulletin, 2012, 96(1): 1-22.
    [4] Hickey J J, Henk B. Lithofacies summary of the Mississippian Barnett Shale, Mitchell 2 T.P. Sims well, Wise County, Texa[J]. AAPG Bulletin, 2007, 91(4): 437-443.
    [5] Dong T, Harris N B, Ayranci K, et al. Porosity characteristics of the Devonian Horn River shale, Canada: Insights from lithofacies classification and shale composition[J]. International Journal of Coal Geology, 2015, 141-142: 74-90.
    [6] Liang C, Jiang Z X, Zhang C M, et al. The shale characteristics and shale gas exploration prospects of the Lower Silurian Longmaxi shale, Sichuan Basin, South China[J]. Journal of Natural Gas Science and Engineering, 2014, 21: 636-648.
    [7] Ou C H, Li C C, Rui Z H, et al. Lithofacies distribution and gas-controlling characteristics of the Wufeng–Longmaxi black shales in the southeastern region of the Sichuan Basin, China[J]. Journal of Petroleum Science and Engineering, 2018, 165: 269-283.
    [8] 郭彤楼,张汉荣. 四川盆地焦石坝页岩气田形成与富集高产模式[J]. 石油勘探与开发,2014,41(1):28-36.

    Guo Tonglou, Zhang Hanrong. Formation and enrichment mode of Jiaoshiba shale gas field, Sichuan Basin[J]. Petroleum Exploration and Development, 2014, 41(1): 28-36.
    [9] Chen S F, Wilson C J L, Luo Z L, et al. The evolution of the western Sichuan foreland basin, southwestern China[J]. Journal of Southeast Asian Earth Sciences, 1994, 10(3/4): 159-168.
    [10] Chen L, Lu Y C, Jiang S, et al. Sequence stratigraphy and its application in marine shale gas exploration: A case study of the Lower Silurian Longmaxi Formation in the Jiaoshiba shale gas field and its adjacent area in Southeast Sichuan Basin, SW China[J]. Journal of Natural Gas Science and Engineering, 2015, 27: 410-423.
    [11] Liang C, Jiang Z X, Cao Y C, et al. Deep-water depositional mechanisms and significance for unconventional hydrocarbon exploration: A case study from the Lower Silurian Longmaxi shale in the southeastern Sichuan Basin[J]. AAPG Bulletin, 2016, 100(5): 773-794.
    [12] Ma Y Q, Fan M J, Lu Y C, et al. Geochemistry and sedimentology of the Lower Silurian Longmaxi mudstone in southwestern China: Implications for depositional controls on organic matter accumulation[J]. Marine and Petroleum Geology, 2016, 75: 291-309.
    [13] Tang X L, Jiang Z X, Huang H X, et al. Lithofacies characteristics and its effect on gas storage of the Silurian Longmaxi marine shale in the Southeast Sichuan Basin, China[J]. Journal of Natural Gas Science and Engineering, 2016, 28: 338-346.
    [14] 王玉满,王宏坤,张晨晨,等. 四川盆地南部深层五峰组—龙马溪组裂缝孔隙评价[J]. 石油勘探与开发,2017,44(4):531-539.

    Wang Yuman, Wang Hongkun, Zhang Chenchen, et al. Fracture pore evaluation of the Upper Ordovician Wufeng to Lower Silurian Longmaxi Formations in southern Sichuan Basin, SW China[J]. Petroleum Exploration and Development, 2017, 44(4): 531-539.
    [15] Ou C H, Li C C, Huang S Y, et al. Remigration and leakage from continuous shale reservoirs: Insights from the Sichuan Basin and its periphery, China[J]. AAPG Bulletin, 2019, 103(8): 2009-2030.
    [16] 蒋裕强,宋益滔,漆麟,等. 中国海相页岩岩相精细划分及测井预测:以四川盆地南部威远地区龙马溪组为例[J]. 地学前缘,2016,23(1):107-118.

    Jiang Yuqiang, Song Yitao, Qi Lin, et al. Fine lithofacies of China’s marine shale and its logging prediction: A case study of the Lower Silurian Longmaxi marine shale in Weiyuan area, southern Sichuan Basin, China[J]. Earth Science Frontiers, 2016, 23(1): 107-118.
    [17] 欧成华,董建蓉,陈朝刚,等. 页岩气开发评价技术[M]. 北京:石油工业出版社,2019.

    Chenghua Ou, Dong Jianrong, Chen Chaogang, et al. Shale gas development evaluation technology[M]. Beijing: Petroleum Industry Press, 2019.
    [18] Passey Q R, Creaney S, Kulla J B, et al. A practical model for organic richness from porosity and resistivity logs[J]. AAPG Bulletin, 1990, 74(12): 1777-1794.
    [19] Fertl W H, Chilingar G V. Total organic carbon content determined from well logs[J]. SPE Formation Evaluation, 1988, 3(2): 407-419.
    [20] 李延钧,张烈辉,冯媛媛,等. 页岩有机碳含量测井评价方法及其应用[J]. 天然气地球科学,2013,24(1):169-175.

    Li Yanjun, Zhang Liehui, Feng Yuanyuan, et al. Logging evaluation method and its application for measuring the total organic carbon content in shale gas[J]. Natural Gas Geoscience, 2013, 24(1): 169-175.
    [21] 张译戈. 长宁地区页岩气测井精细解释方法研究[D]. 成都:西南石油大学,2014.

    Zhang Yige. Fine logging interpretation of shale gas in Changning area[D]. Chengdu: Southwest Petroleum University, 2014.
    [22] 刘璐. 威远—长宁构造页岩气储层测井精细评价[D]. 成都:西南石油大学,2017.

    Liu Lu. Fine logging evaluation of shale gas reservoir in the Weiyuan-Changning area[D]. Chengdu: Southwest Petroleum University, 2017.
    [23] 程华国,袁祖贵. 用地层元素测井(ECS)资料评价复杂地层岩性变化[J]. 核电子学与探测技术,2005,25(3):233-238.

    Cheng Huaguo, Yuan Zugui. Evaluation of formation lithology changes using elemental capture spectroscopy (ECS) logging[J]. Nuclear Electronics & Detection Technology, 2005, 25(3): 233-238.
    [24] 王玉满,董大忠,黄金亮,等. 四川盆地及周边上奥陶统五峰组观音桥段岩相特征及对页岩气选区意义[J]. 石油勘探与开发,2016,43(1):42-50.

    Wang Yuman, Dong Dazhong, Huang Jinliang, et al. Guanyinqiao member lithofacies of the Upper Ordovician Wufeng Formation around the Sichuan Basin and the significance to shale gas plays, SW China[J]. Petroleum Exploration and Development, 2016, 43(1): 42-50.
    [25] 李立尧,魏久传,李梁宁,等. 截断高斯模拟与沉积特征在煤系含隔水层三维空间分布的应用研究[J]. 矿业研究与开发,2018,38(2):48-52.

    Li Liyao, Wei Jiuchuan, Li Liangning, et al. Application research on the 3D space distribution of truncated Gaussian Simulation and sedimentary characteristics in the coal-measures bearing aquiclude[J]. Mining Research & Development, 2018, 38(2): 48-52.
    [26] Pinheiro M, Emery X, Miranda T, et al. Truncated Gaussian Simulation to map the spatial heterogeneity of rock mass rating[J]. Rock Mechanics and Rock Engineering, 2016, 49(8): 3371-3376.
  • 加载中
通讯作者: 陈斌, bchen63@163.com
  • 1. 

    沈阳化工大学材料科学与工程学院 沈阳 110142

  1. 本站搜索
  2. 百度学术搜索
  3. 万方数据库搜索
  4. CNKI搜索

Figures(9)  / Tables(1)

Article Metrics

Article views(603) PDF downloads(311) Cited by()

Proportional views
Related
Publishing history
  • Received:  2020-05-28
  • Published:  2021-04-23

The Lithofacies Classification and Its Influence on the Gas Production Capacity in the Shale Gas Production Area

doi: 10.14027/j.issn.1000-0550.2020.132
Funds:

Sichuan Science and Technology Program 2021YFQ0049

National Science and Technology Major Project 2017ZX0503 5003

National Key Basic Research Program of China 2014CB239205

Abstract: The gas production capacity difference among single wells and the difficulties in sustaining stable production are the key problems faced by shale gas production areas. Based on the typical characteristics of the shale gas production areas, a technical process for the lithofacies classification of high-quality marine shale affected by the gas production capacity was established in this paper. Firstly, for the high-quality marine shale in the shale gas production area, the main gas production capacity difference control factors were analyzed, and the lithofacies classification scheme was determined. Then, using the developed logging calculation model of total organic carbon (TOC) content, porosity, clay, siliceous, and calcareous mineral content, the single well parameter calculation and the lithofacies identification in one shale gas producing area were completed. A total of 10 types of shale lithofacies were identified in one shale gas production area, and the relationship between shale lithofacies type and gas production capacity difference was revealed by comparing the gas content of each lithofacies. Finally, a three-dimensional (3D) lithofacies model in one shale gas production area was established by using the truncated Gaussian simulation algorithm and the sedimentary microfacies confined lithofacies strategies, the spatial distribution characteristics of each kind of lithofacies were shown, and the gas production capacity difference in the Wufeng-Longmaxi black shale in the study area was revealed. At the same time, according to the two conditions of large volume proportion and great gas potential in 3D space, the three different lithofacies with excellent gas production capacity in the study area were determined as i. rich in carbon, high in porosity, calcium, muddy siliceous shale, ii. rich in both carbon and porosity mixed shale, and iii. high in carbon, medium to high in porosity, calcium, muddy siliceous shale. The above results are helpful for explaining the essential causes for the great difference in the decline amplitude and output effect of shale gas production areas, laying a solid theory foundation and technical support for fine production management in shale gas production areas.

OU ChengHua, LIANG ChengGang, LUO Li, YANG Xiao, LI Dan, LI ZhaoLiang. The Lithofacies Classification and Its Influence on the Gas Production Capacity in the Shale Gas Production Area[J]. Acta Sedimentologica Sinica, 2021, 39(2): 269-280. doi: 10.14027/j.issn.1000-0550.2020.132
Citation: OU ChengHua, LIANG ChengGang, LUO Li, YANG Xiao, LI Dan, LI ZhaoLiang. The Lithofacies Classification and Its Influence on the Gas Production Capacity in the Shale Gas Production Area[J]. Acta Sedimentologica Sinica, 2021, 39(2): 269-280. doi: 10.14027/j.issn.1000-0550.2020.132
  • 优质海相页岩是国际上页岩气勘探开发的热点,也是当前中国页岩气取得突破的重点领域。2009年以来,以四川盆地晚奥陶世至早志留世沉积的五峰组—龙马溪组优质海相页岩为靶点目标,中国先后在涪陵、威远、长宁等地区建成了页岩气工业化规模生产基地[1](简称建产区,下同)。经过十余年的攻关与建设,涪陵、威远、长宁页岩气建产区先后进入到规模上产与持续稳产阶段,各建产区内页岩气单井产气能力差异大、持续稳产困难等问题日渐突出[1-2]。如何解析造成建产区内产气能力巨大差异的关键因素?成为制约中国页岩气规模建产的技术瓶颈。

    页岩气的规模建产源起于北美地区,该区规模建产最成功的Barnett与Horn River优质海相页岩的生产实践[3-5]表明,页岩气能否大规模产出,除了受工程技术水平高低的影响外,更受控于优质页岩岩相类型分布的影响;国内有关四川盆地五峰组—龙马溪组优质海相页岩的研究成果[6-8]则表明,页岩岩相与产气能力间具有一定程度的相关关系。由此可见,开展优质海相页岩岩相分类表征研究,对于解析中国页岩气建产区内单井产气能力的差异意义重大。

    为此,本文拟从中国页岩气建产区的地质及开发特点出发,建立起考虑单井产气能力影响的优质海相页岩岩相分类表征方案及技术流程;以威远页岩气建产区为主要对象,解析优质海相页岩的岩相差异,揭示不同页岩岩相类别具有的产气能力差异及其空间分布规律;所获成果将为建产区精细化生产管理及规模建产奠定理论基础、提供技术支撑。

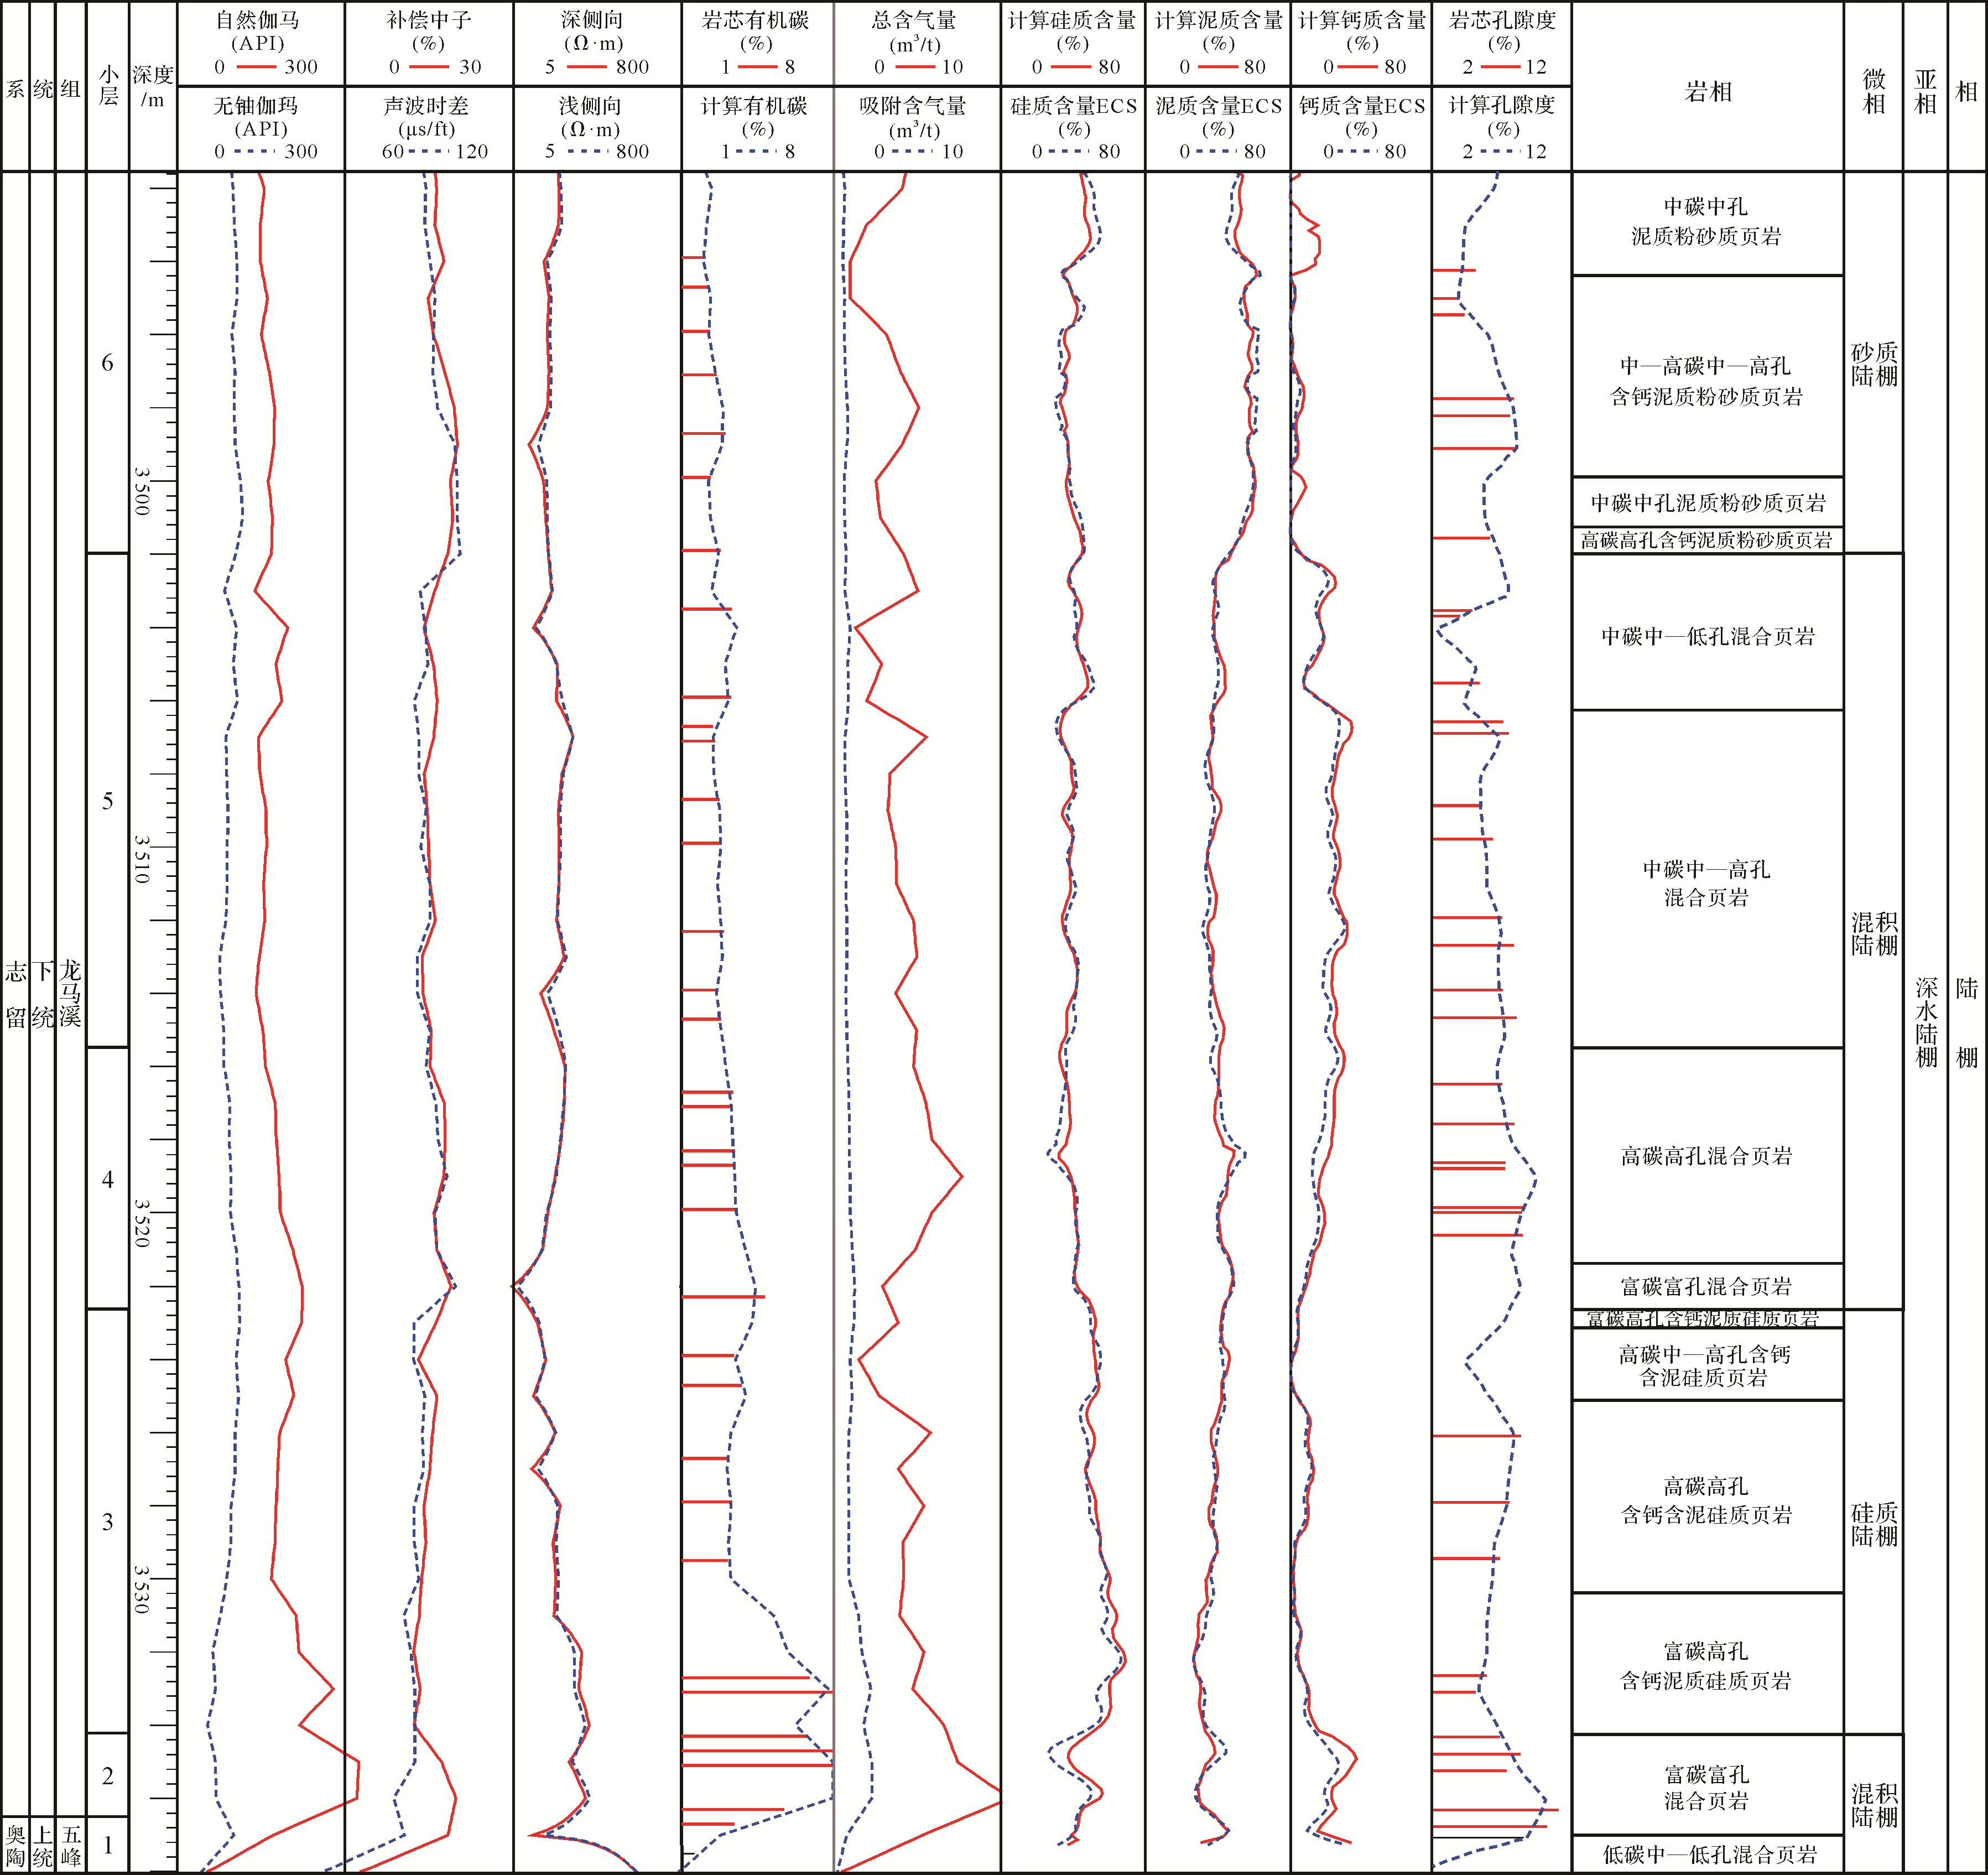
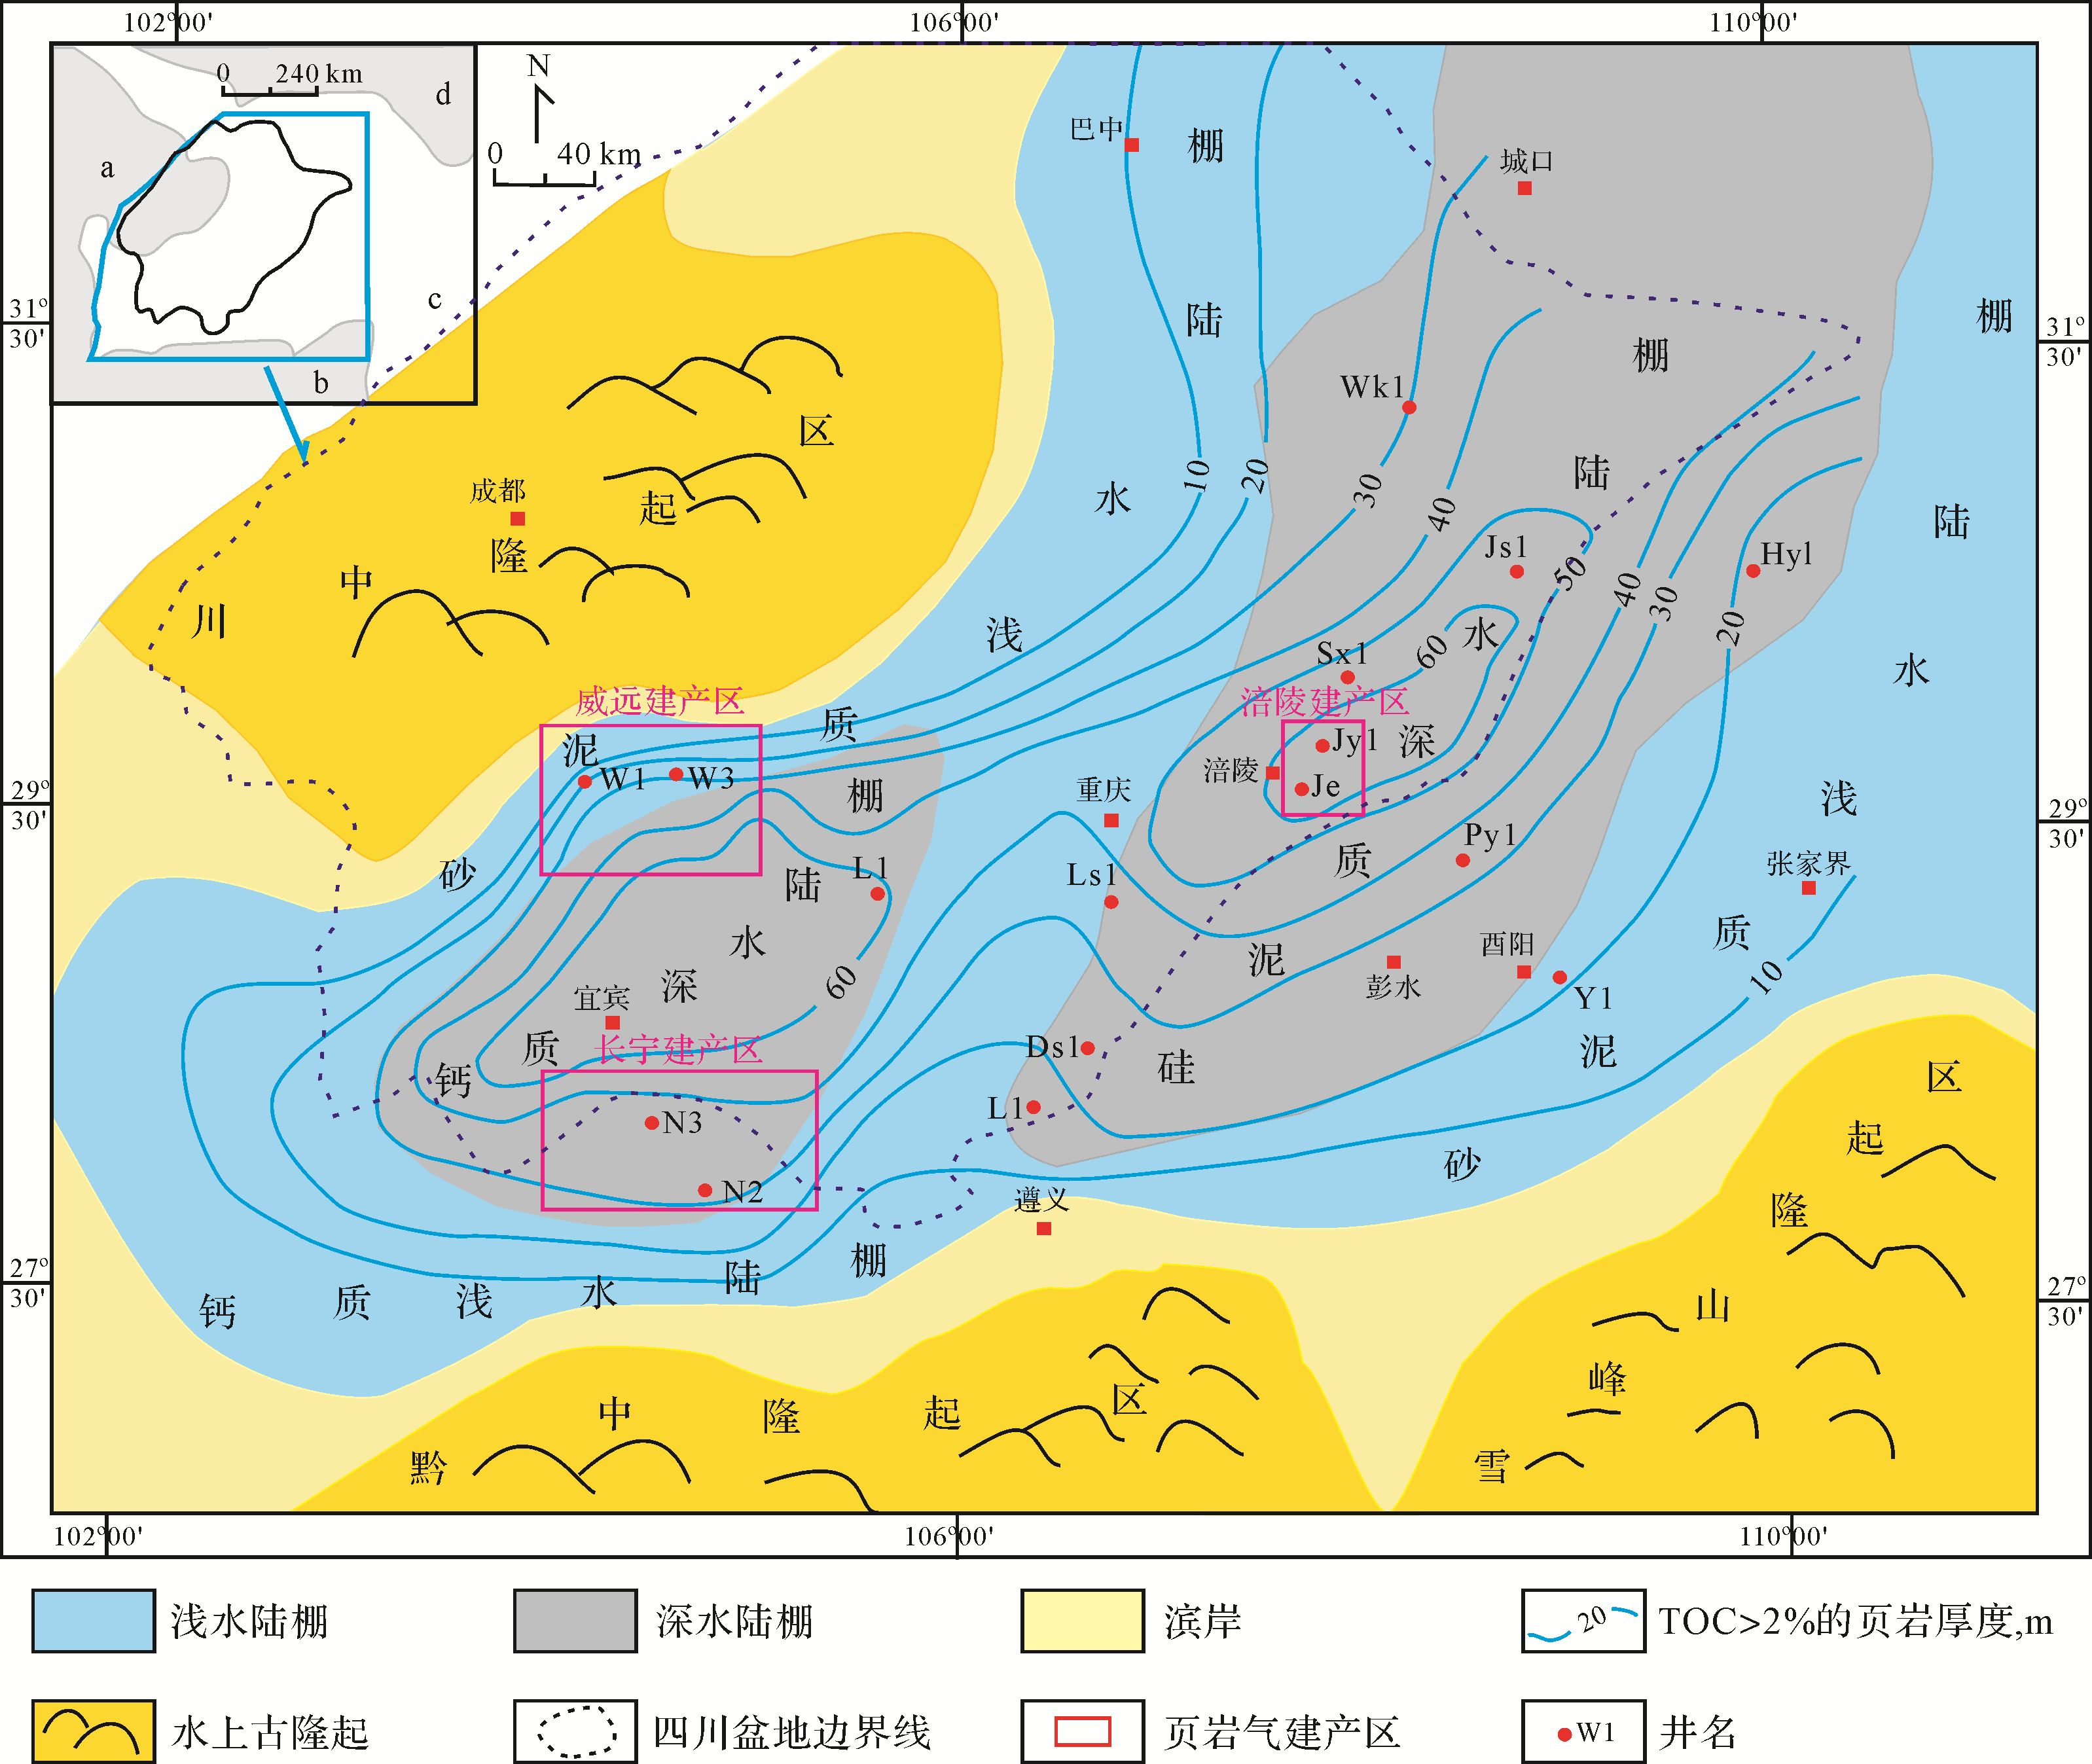
  • 四川盆地五峰组—龙马溪组海相页岩构造及沉积演化研究表明:1)晚奥陶世至早志留世,川渝地区为多个古隆起围限的隆后局限海盆地,发育宜宾和涪陵两个沉积中心,沉积了广泛分布于全盆地的五峰组—龙马溪组海相页岩[6-10]图1);2)由于所处位置不同,威远、长宁和涪陵页岩气建产区的沉积亚相呈现差异,长宁建产区以钙质深水陆棚亚相为主,涪陵建产区以硅泥质深水陆棚亚相为主,威远建产区包括砂泥质浅水陆棚与钙质深水陆棚两类沉积亚相[7,11-13]图1);3)三个建产区发育的沉积微相类型也有差异,长宁与涪陵建产区发育泥质陆棚、砂质陆棚、硅质陆棚和混积陆棚四类微相[7,11-13],威远建产区主要发育砂质陆棚、硅质陆棚和混积陆棚三类微相(图2);4)建产区内的沉积微相平面分布广泛,变化较小,但纵向相变频繁,体现出较强的非均质性[7,11-13]图2)。

    Figure 1.  Geotectonics and sedimentary background of the shale gas production areas in the Sichuan Basin[613]

    Figure 2.  Comprehensive histogram of sedimentary facies, lithofacies, mineral content, organic matter content, porosity, gas content, and logging response characteristics in the Weiyuan shale gas production area

  • 生产实践表明:威远、长宁和涪陵页岩气建产区均存在单井页岩气产量递减速度快、递减幅度大、产出效果差异明显等突出问题,严重制约了规模建产工作的顺利开展。

    上述地质及开发特点预示着建产区内的优质海相页岩存在着强烈的非均质性,而这种非均质性显然无法利用页岩沉积微相的平面分布来刻画,需要另辟蹊径,以反映建产区出现的平面上的产气能力差异。

  • 大量研究[1-2,7-8,13-15]表明:作为自生自储的页岩气,其单井产气能力的高低,不仅要受到构造、沉积、成岩、成烃演化历史与地质环境条件的控制,还与有机质含量高低及压裂缝网构建好坏息息相关,即同时受到地质与工程等多因素影响。

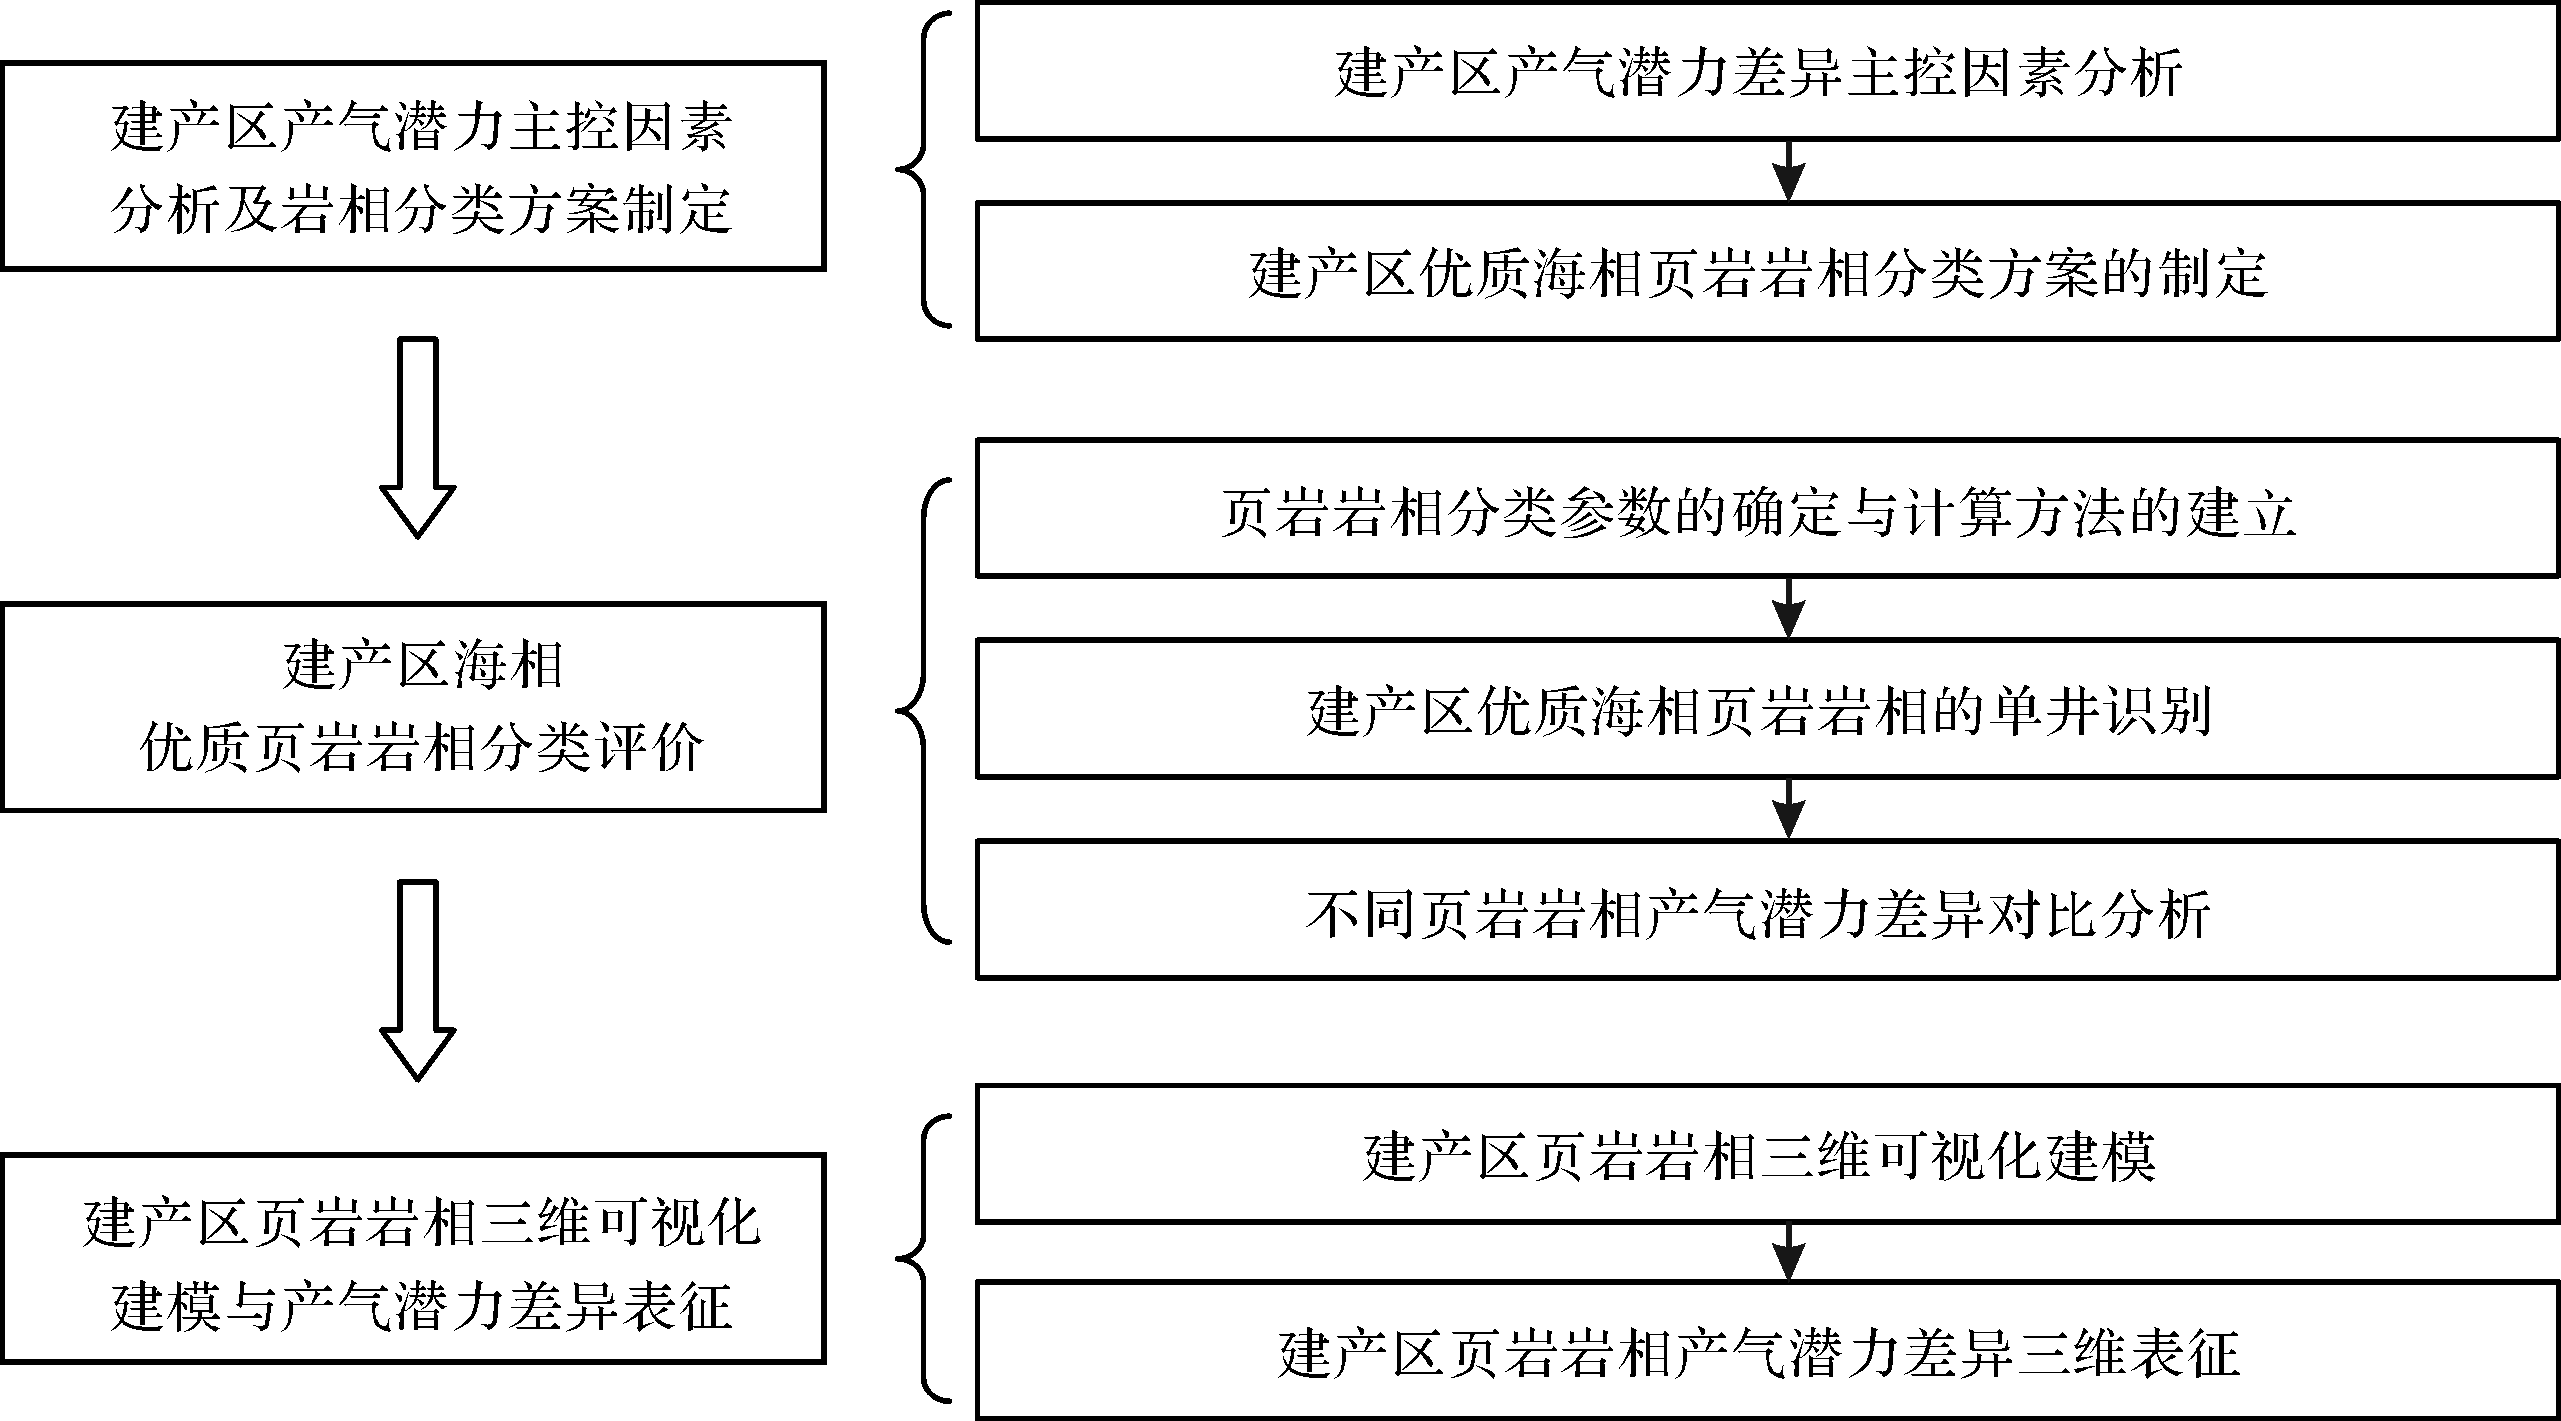
    科学刻画建产区优质海相页岩产气能力差异的基本前提,就是要通过对地质与工程等多因素的对比分析,从中提取优质海相页岩产气能力差异的主控因素,制定优质海相页岩岩相的分类方案。在此基础上,确定出页岩岩相分类参数,建立起实用的页岩岩相分类参数计算方法,以便完整计算、合理识别建产区内每口页岩水平井贯穿的整个目标层段的页岩岩相类别。对比分析不同类别的页岩岩相产气能力差异,通过优中选优,确定优质海相页岩内的甜点岩相类别。利用离散变量随机模拟方法,建立优质海相页岩全部岩相类别的三维可视化地质模型,在三维空间展示具有不同产气能力差异的不同类别页岩岩相的空间分布特征,揭示建产区内优质海相页岩岩相对页岩气产气能力差异分布的影响程度与作用特征。上述技术思路详见图3所示。

    Figure 3.  Research ideas and technical processes

  • 由于不同页岩气建产区之间往往存在构造、沉积、成岩、成烃演化历史与地质环境条件等的差异,同一建产区内部则在构造、沉积、成岩、成烃演化历史与地质环境条件等方面保持一致,或差异不大,因此,建产区内的产气能力差异主要取决于不同区域有机质含量的不同及压裂缝网构建的好坏。若能同时筛选得到反映有机质含量高低差异的地质因素,以及反映压裂缝网构建难易不同的工程因素,并利用这些因素划分建产区优质海相页岩岩相,获得的不同岩相类别必然具有不同的页岩气产气能力,由此实现利用页岩岩相鉴别建产区页岩气产气能力差异的研究目标。

    有关页岩气开发评价的研究成果[5,7,11-17]表明:1)来源于不同沉积微相中的页岩成因类型,不仅显示出岩石学特征差异,更代表了有机质原始产气能力的不同,因此,页岩成因类型代表了页岩气富集的物质基础;2)页岩气层中有机质含量虽然仅仅代表了残存有机质的多少,但由于页岩气建产区的范围一般都较小,其沉积成岩过程、生烃演化历史差别不大,地层温度压力变化也不大,现存的有机质含量多,意味着历史上也多,有机质的生产力水平也就高,所以,建产区页岩气层中有机质含量高,预示着含气性能更加优越;3)与常规天然气一样,页岩气层孔隙空间的大小,决定了游离天然气储存量的多少,孔隙空间大,游离天然气量多,反之,则少;4)矿物种类与含量的不同,代表了产生天然及人工裂缝能力及维持水平的高低差异,脆性矿物含量高,产生天然及人工裂缝的能力及维持水平相对较高。

    同一建产区内承担钻井与压裂施工任务单位的技术水平和方案大体趋同,从而可以认为钻井与压裂工艺对气体产出的影响也基本一致,因此,筛选出的页岩成因类型、有机质含量、孔隙度、矿物组成这四大要素,既能代表海相页岩有机质含量的高低差异,又能反映压裂缝网构建的难易不同,从而能够成为建产区优质海相页岩产气能力差异的主控地质因素。

  • 包括作者[7]在内的众多研究者[3-4,11-13,16]都曾提出过页岩岩相分类方案,这些方案分别考虑了页岩的岩石学特征、成因类型和有机质含量,主要应用于勘探阶段的页岩气甜点识别与勘探潜力分析,且大多采用定性方法识别页岩岩相。如2.1节所述,作为优质海相页岩甜点所在的建产区,本文需要在建立的岩相分类方案中同时考虑海相页岩的成因类型、有机质含量、孔隙度、矿物组成这四大要素,并利用建产区丰富的开发井资料开展优质海相页岩岩相的定量识别。

    首先,依据建产区所属沉积微相差异获得产气页岩的成因类型,并确定为岩相主名。比如,四川盆地五峰组—龙马溪组黑色页岩中识别出了硅质陆棚、砂质陆棚、混积陆棚和泥质陆棚微相,将硅质陆棚微相中的页岩岩相主名确定为硅质页岩,砂质陆棚微相中的页岩岩相主名确定为粉砂质页岩,混积陆棚微相中的页岩岩相主名确定为混合页岩,泥质陆棚微相中的页岩岩相主名确定为泥质页岩(图2)。
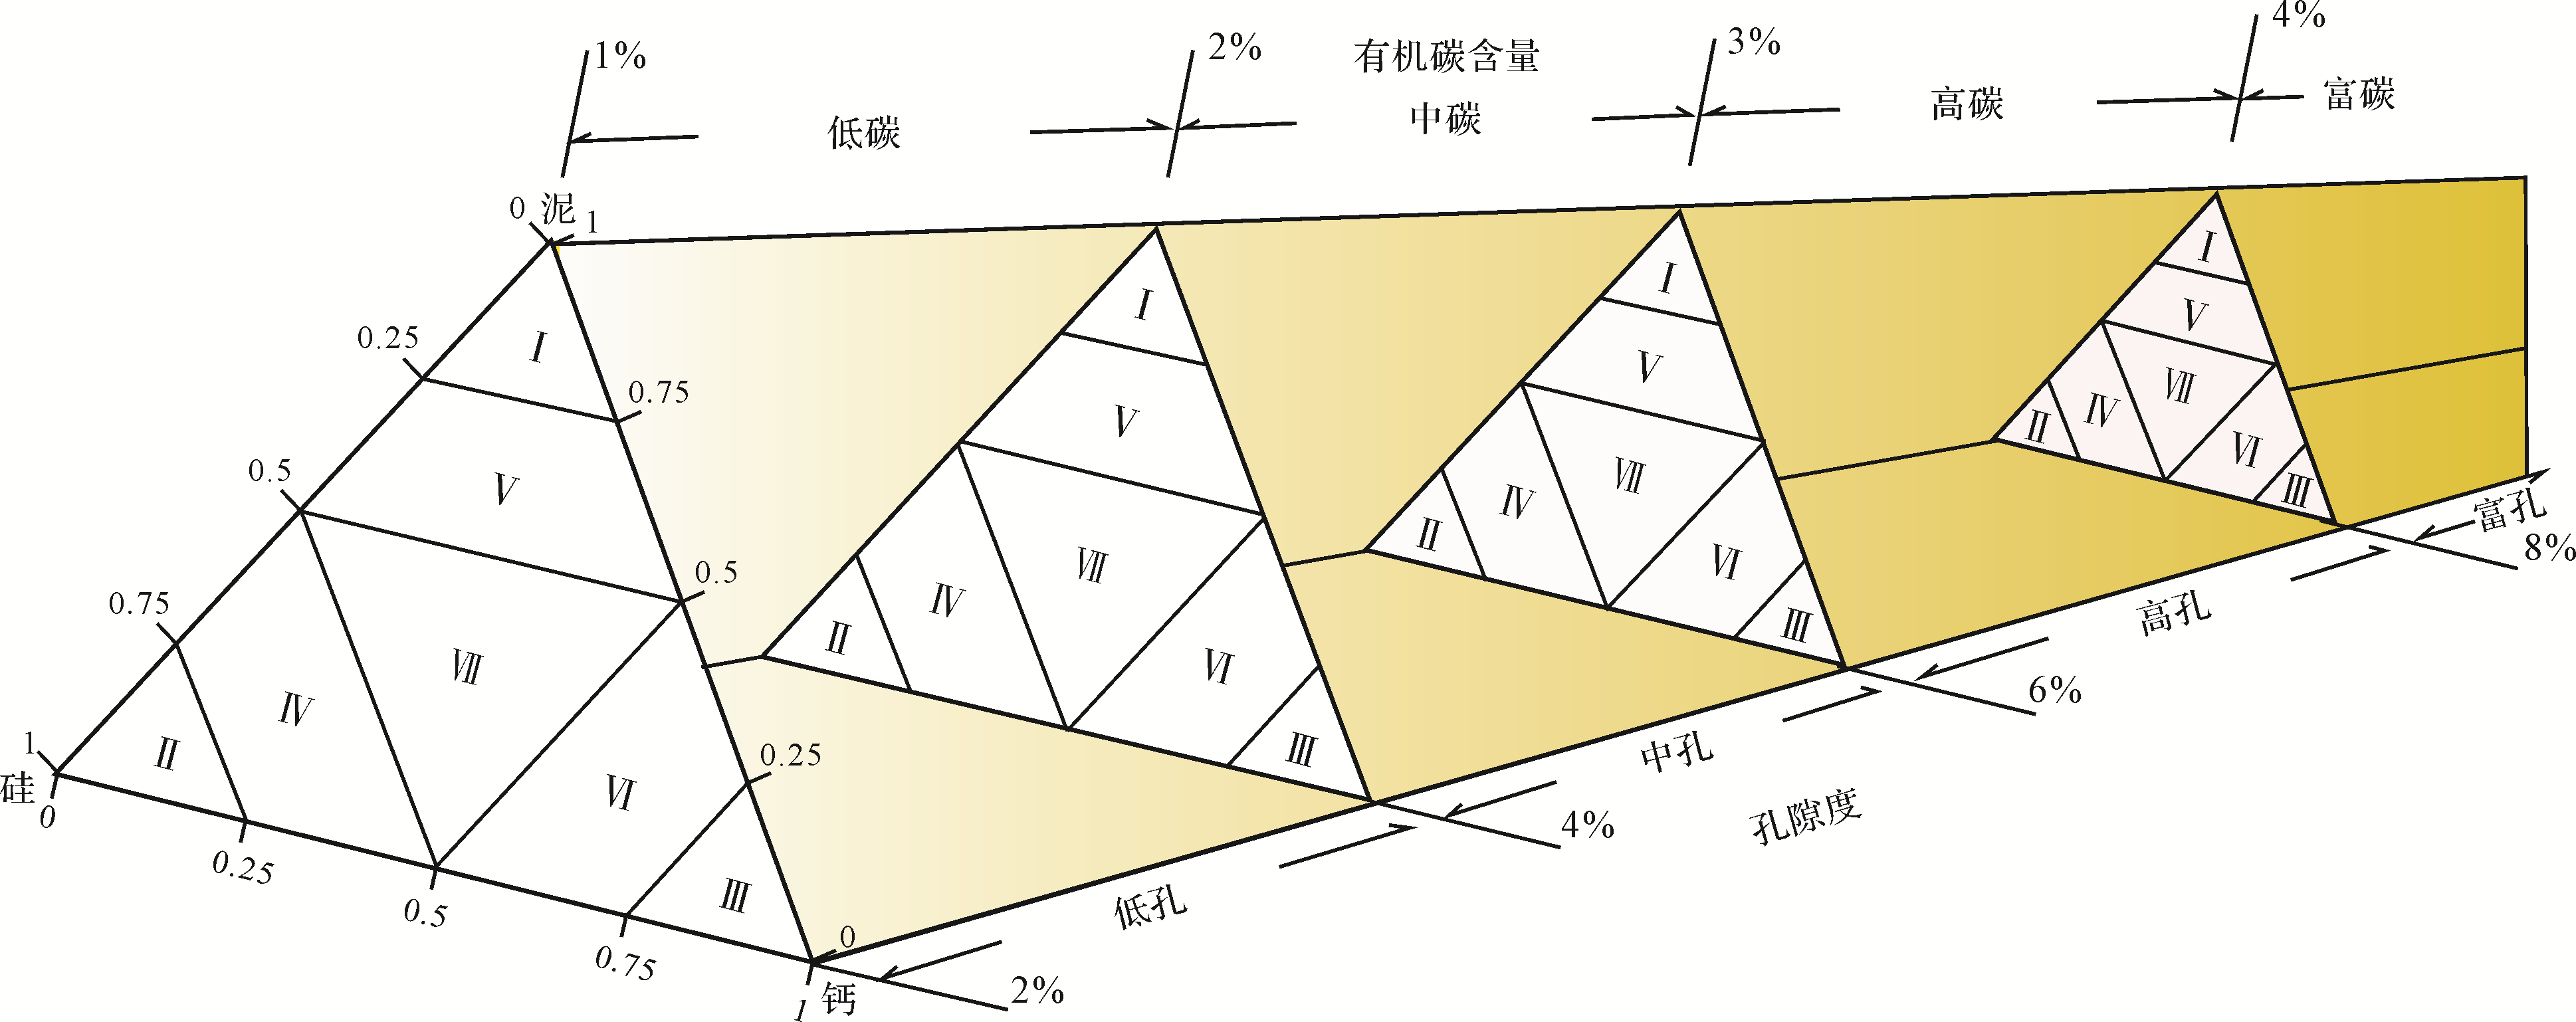
    然后,选择代表性的硅质矿物、钙质矿物和泥质矿物,形成矿物含量三角图[7]图4)。利用矿物含量三角图,在页岩成因类型确定的岩相主名前,添加第一级前缀名称;含量大于75%的分别为硅岩、灰岩和泥岩,因不是页岩,不属本文的研究范畴;含量在50%~75%之间的第一级前缀名称确定为“质”,25%~50%间确定为“含”。页岩岩相主名前加上第一级前缀名称构成页岩岩相分类基础方案[7],如图4所示。需要说明的是,混合页岩的各类矿物均存在,且含量差异较小,为避免页岩岩相名称冗长,一般忽略第一级前缀名称(图2)。

    Figure 4.  The marine shale lithofacies classification pattern in the shale gas production area based on the five⁃terminal elements of organic carbon content, porosity, siliceous, muddy, and calcareous content (I mudstone, II siliceous or siltstone, III limestone or dolomite, IV siliceous or silty shale, V muddy shale, VI calcareous shale, and VII hybrid shale)

    最后,在基础方案上,加上有机质含量和孔隙度分别作为页岩岩相的第二级和第三级修饰前缀。参考众多学者的研究成果[11-13,16-17],按有机质含量(TOC)和孔隙度(POR)的高低分别添加第二、第三级修饰前缀富碳(TOC>4%)、富孔(POR>8%),高碳(TOC=3%~4%)、高孔(POR=6%~8%),中碳(TOC=2%~3%)、中孔(POR=4%~6%),低碳(TOC=1%~2%)、低孔(POR=2%~4%),获得图4所示海相页岩岩相分类方案。

  • 利用编制的页岩岩相分类方案开展建产区优质海相页岩岩相的分类评价,需要建立有机碳含量(TOC),孔隙度(POR),硅质、钙质和泥质矿物含量的定量计算模型。考虑到岩芯分析化验资料无法覆盖整个建产区平面及各单井纵向的目标层范围,地震资料难以精确计算出页岩小层内部的储层参数,本文选用测井方法建立上述各参数的定量计算模型。

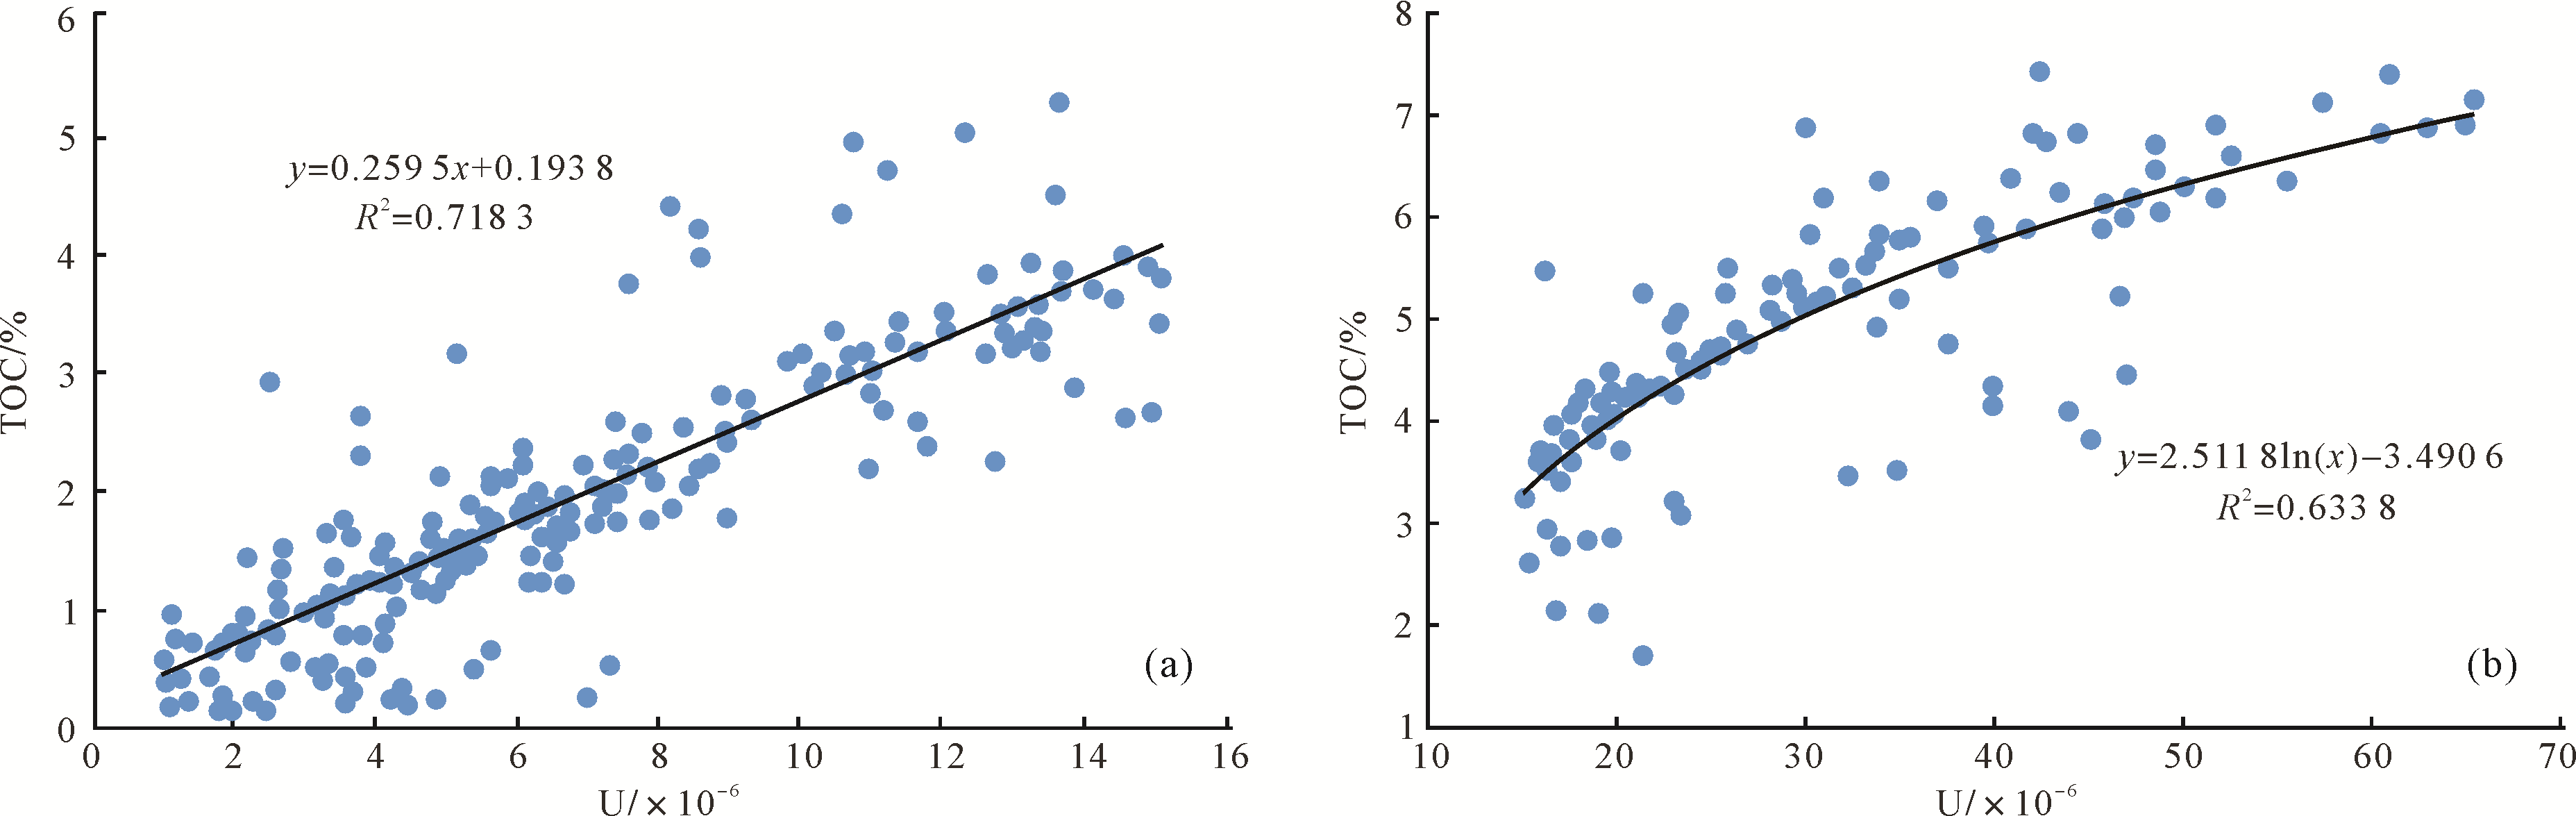
  • 国内外学者[18-20]分别采用电阻率—声波重叠法、密度拟合法、自然伽马能谱法和多元回归法等建立了有机碳含量(TOC)测井计算模型。对岩芯分析TOC与自然伽马能谱铀值测井数据进行相关拟合(图5)表明:采用分段自然伽马能谱法得到的计算公式(1)和(2),对四川盆地威远页岩气建产区TOC计算效果较好(图2)。

    T O C = 0.2503 U + 0.288            U 15 × 10 - 6 (1)
    T O C = 2.471 l n U - 3.3517         U > 15 × 10 - 6 (2)

    式中:U为自然伽马能谱铀值测井数据,×10-6;TOC为有机碳含量,%。

    Figure 5.  The total organic carbon (TOC) and uranium (U) relationship in the Weiyuan shale gas production area

  • 前人研究[18-20]表明:采用泥质含量和TOC校正后的补偿中子,可以较好地表征页岩储层孔隙度的变化。依靠四川盆地威远页岩气建产区岩芯分析孔隙度校正泥质含量和TOC后,得到孔隙度补偿中子测井计算模型(3);将该模型计算孔隙度与岩芯分析孔隙度相比(图6),两者基本保持在45度角的直线上,典型井的计算结果也充分显示,该模型对四川盆地威远页岩气建产区孔隙度计算的效果较好(图2)。

    Figure 6.  Porosity comparison of core analysis and log calculation in the Weiyuan shale gas production area

    ϕ = C N L - 0.163 V S H - 0.95 T O C (3)

    式中:CNLVSH、TOC分别为补偿中子测井值(%)、泥质含量(%)、有机碳含量(%),ϕ为计算的孔隙度(%)。

  • 页岩气层中的矿物一般分为泥质、硅质、钙质、铁质四类,经对比分析,本文采用全组分体积模型预测法[21-22]来计算泥质、硅质、钙质和铁质矿物含量,公式(4)为建立的全组分体积模型,利用模拟退火算法求解,编制了计算软件,完成了四川盆地威远页岩气建产区泥质、硅质、钙质和铁质矿物的计算。

    A C = A C 1 × V 1 + A C 2 × V 2 + A C 3 × V 3 + A C 4 × V 4 + A C 5 × V 5 + A C 6 × ϕ C N L = C N L 1 × V 1 + C N L 2 × V 2 + C N L 3 × V 3 + C N L 4 × V 4 + C N L 5 × V 5 + C N L 6 × ϕ D E N = D E N 1 × V 1 + D E N 2 × V 2 + D E N 3 × V 3 + D E N 4 × V 4 + D E N 5 × V 5 + D E N 6 × ϕ P E = P E 1 × V 1 + P E 2 × V 2 + P E 3 × V 3 + P E 4 × V 4 + P E 5 × V 5 + P E 6 × ϕ V 1 + V 2 + V 3 + V 4 + V 5 + ϕ = 100 (4)

    式中:ACCNLDEN……PE代表与页岩组成相关的测井曲线;ϕ代表孔隙度,%;V代表第i种矿物组分所占体积百分数,%;ACi CNLi DENi ……PEi 代表第i种组分的测井响应值,i=(1,2,3,4,5,6),其中1代表硅质(石英),2代表钙质(方解石、白云石),3代表铁质(黄铁矿),4代表泥质(伊利石、蒙脱石、绿泥石),5代表干酪根,6代表孔隙流体。

    地层元素测井(ECS)是近年来提出的一种新的测井方法,其原理是利用对地层Si、Ca、Fe、S、Ti、Cl、Cr、Gd等元素的准确测量,实现对地层岩石类型及组成特征的准确判定[23]。该方法能实现全井筒范围岩石类型的识别与判断,相比岩芯分析识别地层岩性具有较大的优势,但该方法现场实施费用昂贵,因而常常用来作为常规测井岩性识别的标准。图2展示了采用上述全组分体积模型预测法识别的矿物含量结果与ECS解释结果的对比,从对比结果来看,计算结果与ECS测井解释结果具有良好的一致性,能较好地用来计算页岩气建产区单井矿物含量。

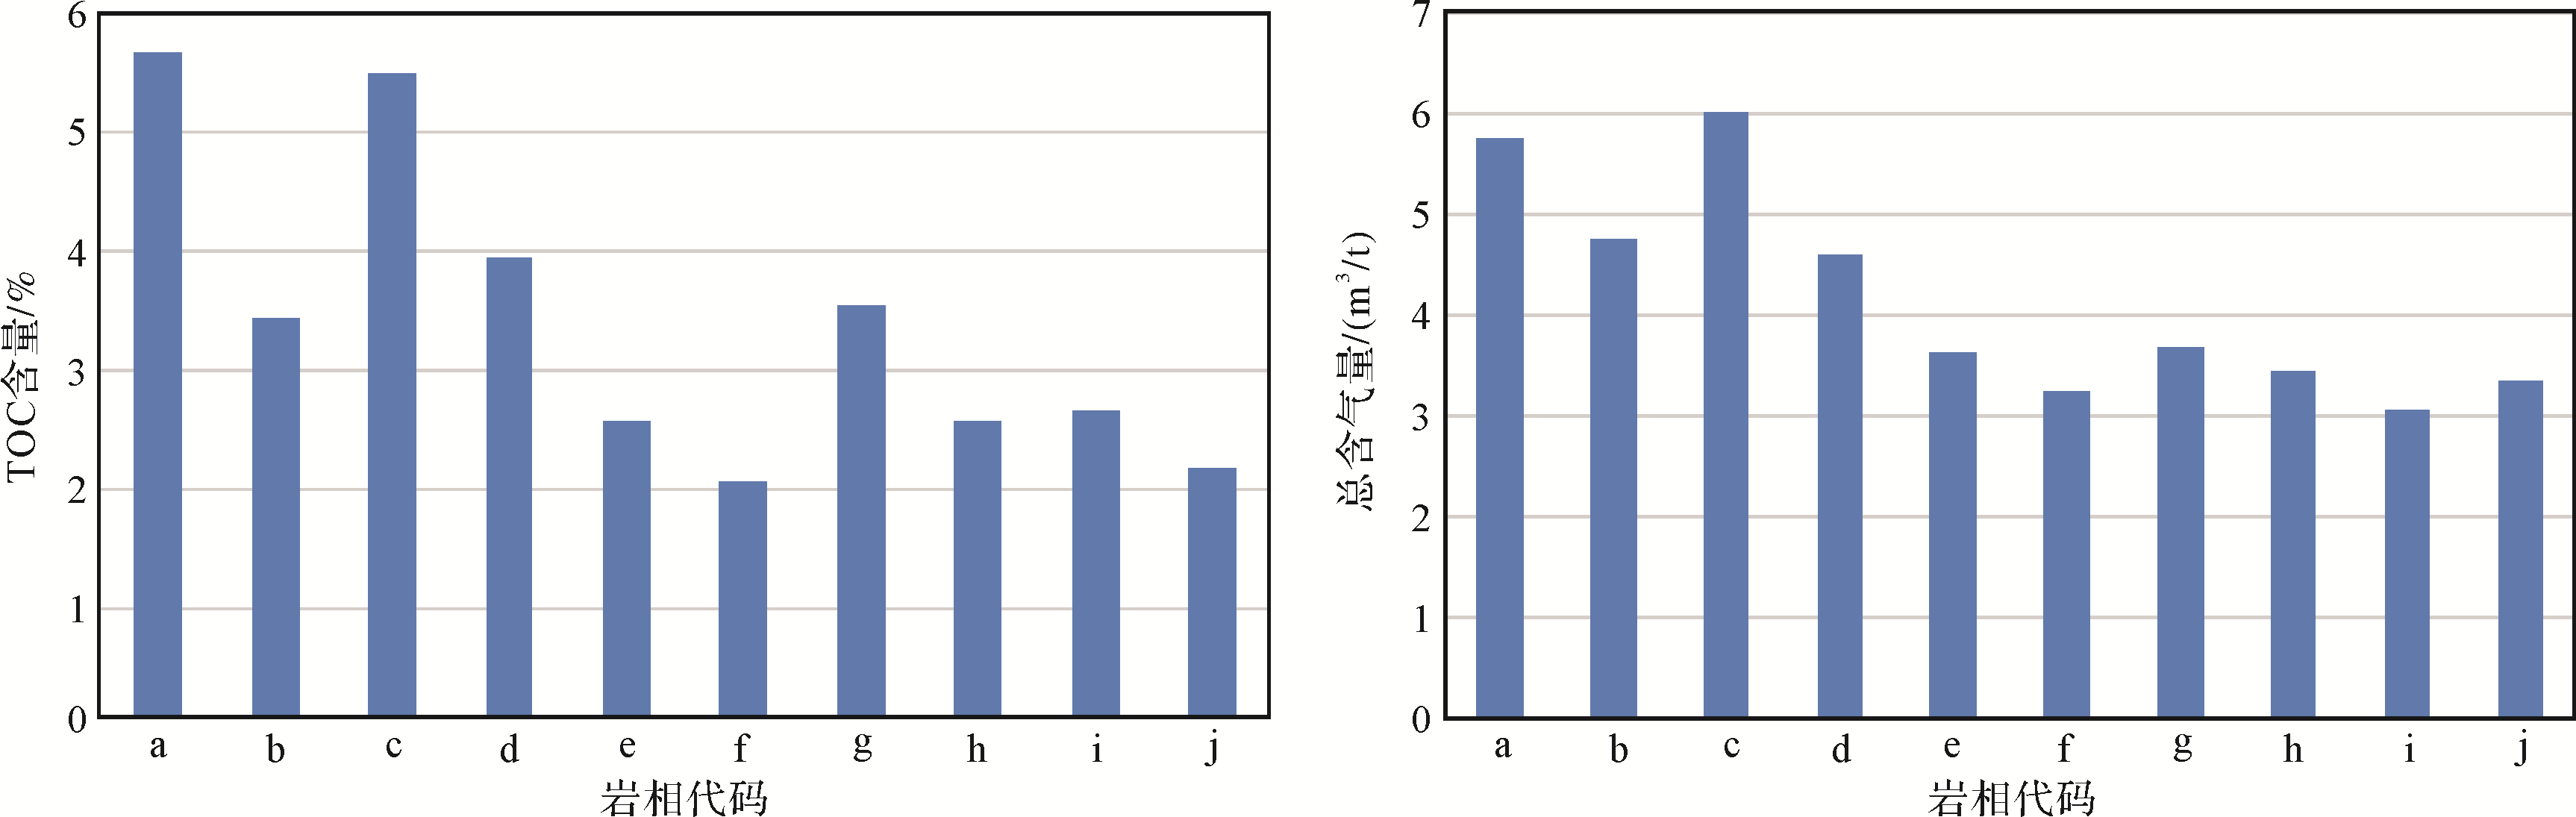
  • 采用上述测井计算模型,先后完成了四川盆地威远页岩气建产区中15口水平井TOC含量,孔隙度,泥质、硅质、钙质矿物含量的计算,利用前述建立的页岩岩相分类方案实施了各单井页岩岩相的分类识别,对比了不同岩相类型的TOC含量及其含气性,分析了不同页岩岩相的产气能力差异。完成上述工作后,在四川盆地威远页岩气建产区中识别出10类岩相,统计出了各类岩相的TOC含量与含气量特征(表1图7),得到如下三条认识。

    岩相 代码 岩相类型 微相 类型 统计量 TOC含量/% 自由气含量 /(m3/t) 吸附气含量 /(m3/t) 总含气量 /(m3/t) 3D模型中的 体积百分比/%
    a 富碳高孔含钙泥质硅质页岩 硅 质 陆 棚 最小—最大 3.48~11.38 0.15~10.75 0.32~2.71 0.71~14.18 23.35
    平均值 5.67 3.44 1.47 5.74
    d 高碳中—高孔含钙含泥硅质页岩 最小—最大 2.52~4.58 0.17~11.24 0.25~2.01 0.60~12.23 17.04
    平均值 3.41 3.70 1.03 4.74
    b 富碳富孔混合页岩 混 积 陆 棚 最小—最大 3.62~9.19 0.29~11.82 0.18~2.21 0.63~12.06 10.35
    平均值 5.48 3.96 1.46 6.01
    e 高碳高孔混合页岩 最小—最大 2.85~4.15 0.27~11.19 0.33~1.71 0.61~11.54 10.64
    平均值 3.91 2.81 0.81 4.58
    h 中碳中—高孔混合页岩 最小—最大 1.78~5.03 0.26~10.38 0.15~1.72 0.53~10.75 6.21
    平均值 2.53 2.92 0.71 3.61
    j 中、低碳中—低孔混合页岩 最小—最大 0~6.19 0.82~4.53 0~1.68 0.24~5.33 6.32
    平均值 2.01 2.68 0.65 3.23
    c 高碳高孔含钙泥质粉砂质页岩 砂 质 陆 棚 最小—最大 2.69~5.29 0.04~6.34 0.16~1.61 0.20~6.41 4.48
    平均值 3.52 2.95 0.83 3.68
    f 中碳中孔泥质粉砂质页岩 最小—最大 1.85~3.56 0.26~7.22 0.42~1.08 0.75~6.23 7.52
    平均值 2.52 2.76 0.7 3.45
    g 中—高碳中—高孔含钙泥质粉砂质页岩 最小—最大 1.63~4.31 0.03~4.97 0.13~1.68 0.17~5.91 10.98
    平均值 2.63 2.53 0.68 3.05
    i 中碳中孔泥质粉砂质页岩 最小—最大 1.97~2.36 0.09~8.77 0.15~2.18 0.26~7.73 3.11
    平均值 2.13 2.79 0.58 3.34

    Table 1.  Statistics of different lithofacies types and their gas production capacity in the Weiyuan shale gas production area

    Figure 7.  Comparison of the average TOC content (left) and the average total gas content (right) of different lithofacies (lithofacies codes are shown in Table 1) in the Weiyuan shale gas production area

    (1) 对比分析不同岩相的含气性特征,不难看出,无论是自由气、吸附气,还是总含气量,这10类岩相间均体现出较大的差异性;由于页岩气是致密储层,水平井压裂后产出的气体基本来源于页岩气井周缘区域,远井地带的页岩气没有渗流通道,极难渗流到达井筒,因此,井周含气性能优越,页岩气井的产气能力就越强,否则,就弱。表1展现出来的含气性差异,将直接体现出不同岩相产气能力的不同,即是说,表1可以算作四川盆地威远页岩气建产区页岩岩相与产气能力间的关系模型,依据这个模型,就可以利用页岩岩相来直接判断产气能力的优良程度。

    (2) 四川盆地威远页岩气建产区内TOC含量相对较高的五类岩相为:a富碳高孔含钙泥质硅质页岩,c富碳富孔混合页岩,d高碳高孔混合页岩,g高碳高孔含钙泥质粉砂质页岩,b高碳中—高孔含钙含泥硅质页岩;含气性相对较好的五类岩相为:c富碳富孔混合页岩、a富碳高孔含钙泥质硅质页岩,b高碳中—高孔含钙含泥硅质页岩,d高碳高孔混合页岩,g高碳高孔含钙泥质粉砂质页岩。

    (3) 四川盆地威远海相页岩气建产区内TOC含量高的岩相与含气性较好的岩相类型基本一致(表1图7),但由于页岩层内气体在生成后的漫长地史时期会发生局部微运移[15]。因此,含气性除了与TOC息息相关外,还受到页岩成因类型、孔隙度和矿物含量的影响,这从另一个角度证实了采用页岩成因类型、有机质含量、孔隙度、矿物组成四要素编制建产区优质海相页岩岩相分类方案的科学合理性。

  • 在沉积微相纵向分布差异性分析基础上,同时考虑岩相类型的不同,以及测井曲线显示的沉积旋回差异,将四川盆地威远页岩气建产区产气页岩层由下到上细分为6个小层(图2),其中,混积陆棚分布在1号、2号、4号、5号三个小层,硅质陆棚分布在3号小层,砂质陆棚分布在6号小层;利用发育于五峰组顶部、整个四川盆地广泛发育的观音桥薄层(<1 m)灰质泥岩及介壳灰岩[24]作为区域标志层,完成区内各小层的多井横向对比,结果表明,各小层平面沉积微相在建产区内没有变化。为此,采用确定性算法,直接按层建立获得四川盆地威远页岩气建产区沉积微相三维模型,如图8图2所示,1号和2号小层为混积陆棚,3号小层为硅质陆棚,4号和5号小层为混积陆棚,6号小层为砂质陆棚。

    Figure 8.  The grid map of the three⁃dimensional (3D) sedimentary microfacies model in the Weiyuan shale gas production area

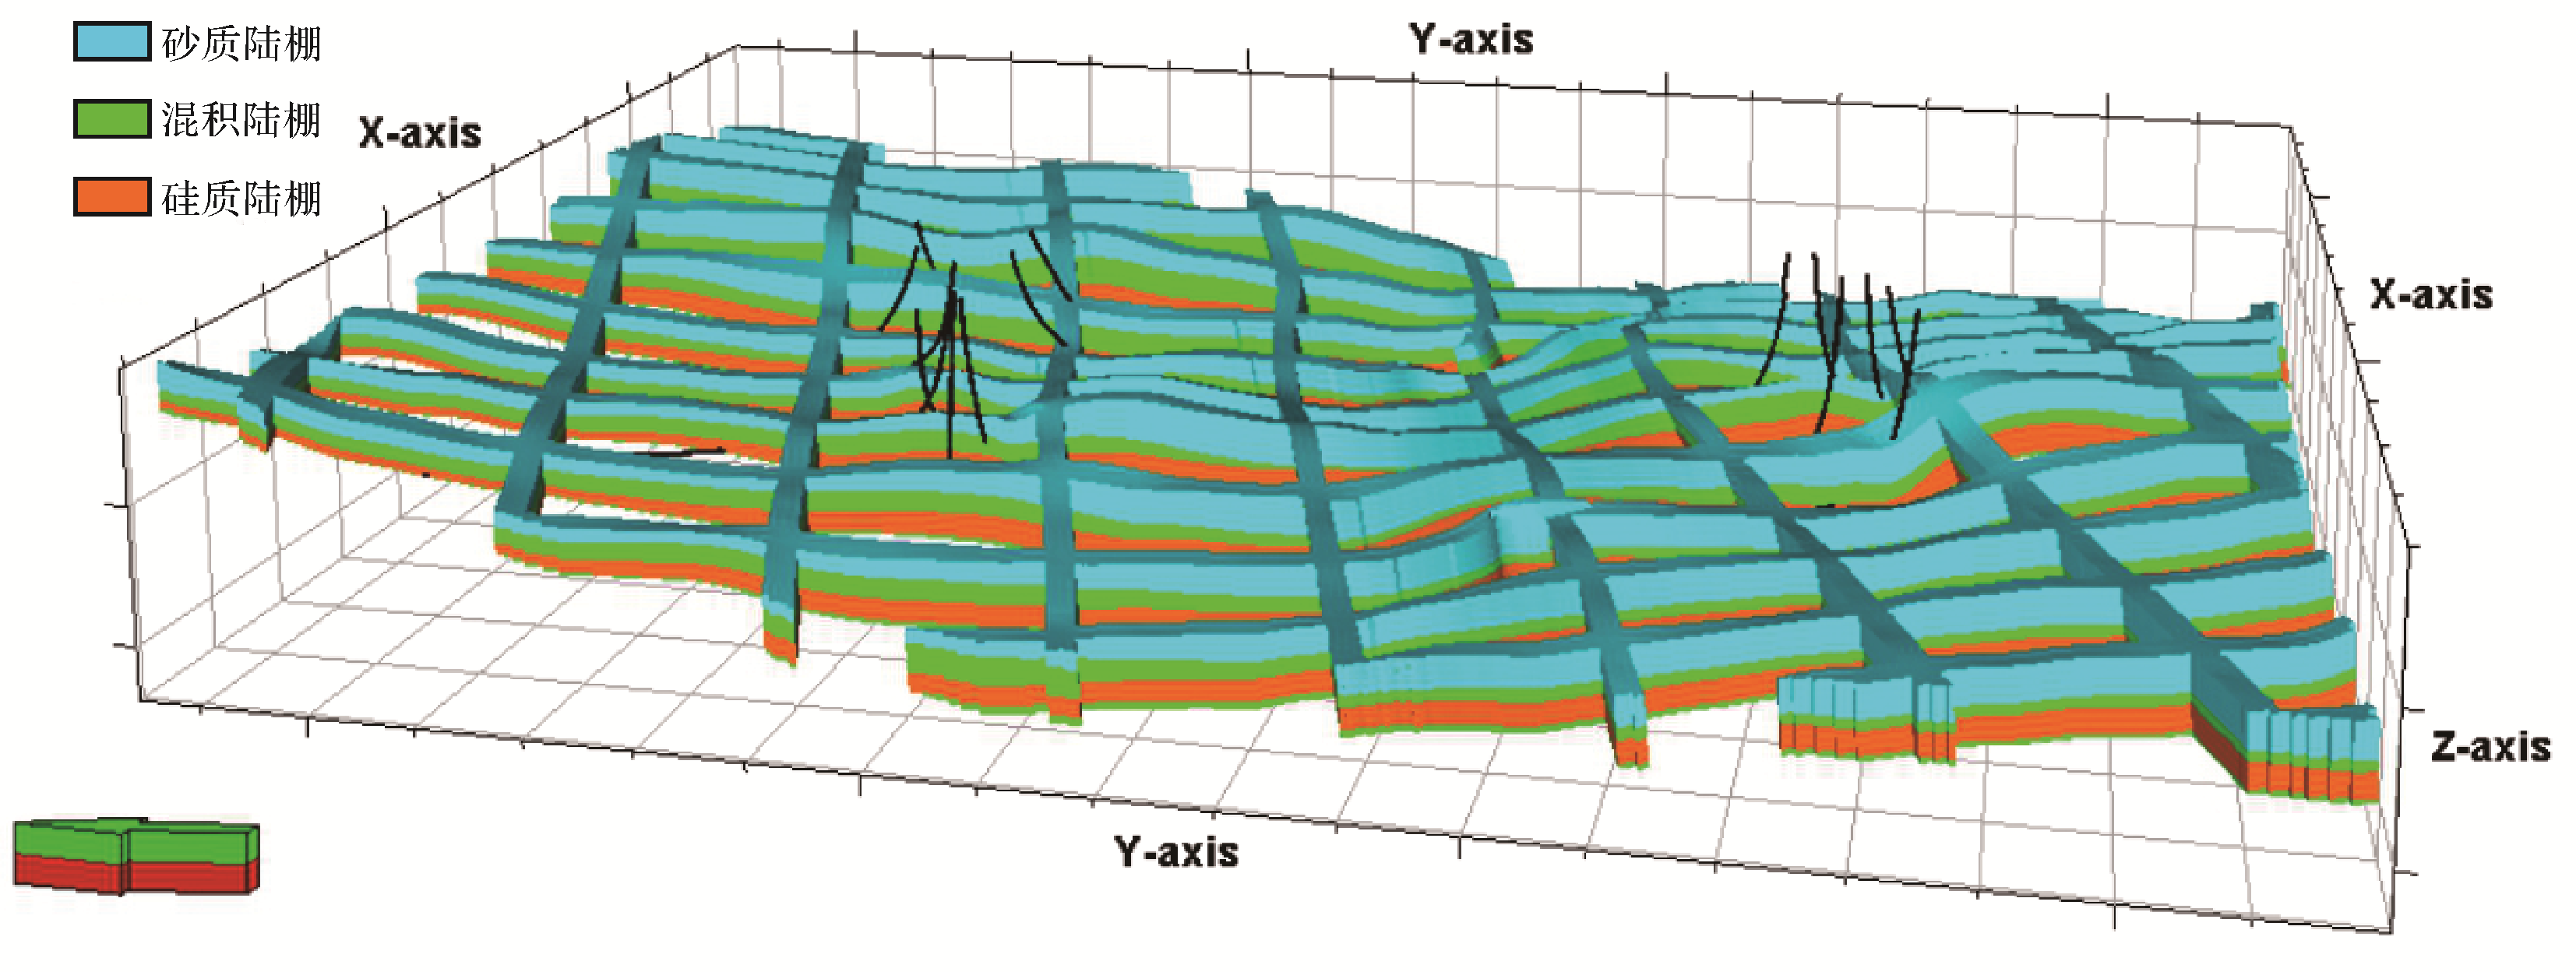
    将建产区内所有单井岩相数据数值化,生成沿井轨迹的岩相曲线,按照沉积微相约束岩相的策略,优选截断高斯模拟算法[25-26]建立了四川盆地威远页岩气建产区的岩相三维模型(图9)。

    Figure 9.  The 3D lithofacies model in the Weiyuan shale gas production area (The black line is a straight or horizontal well trajectory)

  • 由建立的研究区三维岩相模型,统计分析区内三维空间中所占体积比例较多的五类岩相分别为:a富碳高孔含钙泥质硅质页岩,d高碳中—高孔含钙含泥硅质页岩,g中—高碳中—高孔含钙含泥粉砂质页岩,e高碳中—高孔混合页岩,b富碳富孔混合页岩(表1)。结合3.2节的分析结果,四川盆地威远海相页岩气建产区五峰组—龙马溪组优质海相黑色页岩内,同时满足在三维空间中所占体积比例大和生气潜力大的三种优良岩相类型为:a富碳高孔含钙泥质硅质页岩,b富碳富孔混合页岩,d高碳中—高孔含钙含泥硅质页岩。

    依靠表1建立的页岩岩相与产气能力间的关系及统计的各类岩相在三维空间所占的体积比例,利用图9给出的建产区各小层各类页岩岩相在三维空间的分布特征,即可得到建产区内产气能力高低差异特征和规律。图9g展示了沿A、B两口水平井轨迹剖切的三维岩相模型。其中,A井测试产量11.07万方/日,压裂长度1 458 m,加砂量2 600方;B井测试产量21.8万方/日,压裂长度1 438 m,加砂量1 500方。两口井的压裂长度近等,加砂量A井比B井多接近1倍,而测试产量A井只有B井的1半。两口井的生产结果充分表明,A井的产气能力明显低于B井,而其中的原因正好能从两口井的井轨迹穿越的岩相类型的产气能力差异得到解释;从图9g明显可以看出,左侧A井井周分布的岩相的产气能力明显低于右侧B井。由此可见,利用本文所建立的三维岩相模型能够有效揭示页岩气井产气能力差异的原因,从而为合理安排气井生产工作制度,实现页岩气建产区的精细化生产管理提供坚实的理论基础与有力的技术支撑。

  • (1) 当前,中国页岩气建产区面临着单井产量大幅度递减,井间递减幅度及产出效果差异巨大等科学技术难题,急需开展建产区优质海相页岩内部产气能力差异原因解析,页岩岩相分类评价与三维可视化建模则是解决上述难题的有效手段。

    (2) 围绕页岩气建产区典型特点,建立了优质海相页岩岩相分类评价与三维可视化建模技术流程,包括建产区优质海相页岩产气能力主控因素分析及岩相分类方案编制、岩相分类评价、岩相三维可视化建模与产气能力差异表征等3个关键技术环节,各个技术环节相互关联、缺一不可,具体应用时需要从建产区的实际特征出发,按照文中论述的各个技术环节的具体操作步骤逐一开展各项工作;需要说明的是,将上述方法应用于开发初期,考虑到井网密度较小,需要利用地震预测以增加井间插值的可靠性,同时由于地震资料分辨率的限制,岩相纵向的描述精度只能到层组级别。

    (3) 采用所建立的技术流程完成的应用实例,揭示了页岩岩相类型与产气能力间的关系,依靠这个关系,利用所建的岩相三维模型,展示了区内五峰—龙马溪组海相黑色页岩内部产气能力的差异特征,同时优选出该区产气能力较好的三类岩相——富碳高孔含钙泥质硅质页岩、富碳富孔混合页岩和高碳中—高孔含钙含泥硅质页岩,从而为建产区精细化生产管理提供了理论基础与技术支撑。

Reference (26)

Catalog

    /

    DownLoad:  Full-Size Img  PowerPoint
    Return
    Return