Advanced Search
Volume 40 Issue 3
Jun.  2022
Turn off MathJax
Article Contents

ZHANG Han, HUANG Wei, JIANG Ying, CHEN ZiYuan, SHEN ChuanChou, DONG JinGuo. Structure Characteristics of DO 12 Climate Abrupt Event: Evidence from the stalagmite record, Shanxi province, in northern China[J]. Acta Sedimentologica Sinica, 2022, 40(3): 765-773. doi: 10.14027/j.issn.1000-0550.2021.005
Citation: ZHANG Han, HUANG Wei, JIANG Ying, CHEN ZiYuan, SHEN ChuanChou, DONG JinGuo. Structure Characteristics of DO 12 Climate Abrupt Event: Evidence from the stalagmite record, Shanxi province, in northern China[J]. Acta Sedimentologica Sinica, 2022, 40(3): 765-773. doi: 10.14027/j.issn.1000-0550.2021.005

Structure Characteristics of DO 12 Climate Abrupt Event: Evidence from the stalagmite record, Shanxi province, in northern China

doi: 10.14027/j.issn.1000-0550.2021.005
Funds:

National Natural Science Foundation of China 41102216, 41472317, 41877287

Jiangsu Students’Projects for Innovation and Entrepreneur⁃ship Training Program 201910304116Y, 202010304116Y

  • Received Date: 2020-04-09
  • Rev Recd Date: 2021-01-06
  • Publish Date: 2022-06-10
  • To date, the pattern of Dansgaard-Oeschger (DO) events in response to monsoon climate is a question of greatest interest in paleoclimate research. Whether it is manifested as a single pattern or as multiple patterns remains controversial. A high-resolution oxygen isotope profile established with 239 oxygen isotope and 15 230Th dates from the Dragon Cave, Shanxi province, North China, provides a detailed history of the East Asian summer monsoon (EASM) variation during the middle marine isotope stage (MIS 3). Our records show significant millennial-scale variability, and are consistent in rate with DO events 11⁃12 and Heinrich event 5 recorded in other Chinese caves and in the Greenland ice core. Their close consistency supports a strong climatic link between high and low latitudes.Early in the DO 12 event, the δ18O values of stalagmite L2 remained negative, indicating the persistent intensification of the Asian summer monsoon, which is quite different from the pattern of stepwise temperature decrease recorded in the Greenland ice core after approaching the maximum. Comparison of records from different regions demonstrates that the response to the DO event of the Asian summer monsoon, and to the tropical low-latitude hydrological process, was characterized by an asymmetrical inverted V-shape. This may have been related to the release of latent heat from the southern ocean and a strengthened cross-equatorial flow (later weakened), resulting in the intertropical convergence zone (ITCZ) gradually north (south). By extension, the summer monsoon in Northern China started to increase continuously, and eventually wane.
  • [1] Dansgaard W, Johnsen S J, Clausen H B, et al. Evidence for general instability of past climate from a 250-kyr ice-core record[J]. Nature, 1993, 364(6434): 218-220.
    [2] Voelker A H L, Participants W. Global distribution of centennial-scale records for Marine Isotope Stage (MIS) 3: A database[J]. Quaternary Science Reviews, 2002, 21(10): 1185-1212.
    [3] Wolff E W, Chappellaz J, Blunier T, et al. Millennial-scale variability during the last glacial: The ice core record[J]. Quaternary Science Reviews, 2010, 29(21/22): 2828-2838.
    [4] Hinnov L A, Schulz M, Yiou P. Interhemispheric space–time attributes of the Dansgaard–Oeschger oscillations between 100 and 0 ka[J]. Quaternary Science Reviews, 2002, 21(10): 1213-1228.
    [5] McManus J F, Oppo D W, Cullen J L. A 0.5-million-year record of millennial-scale climate variability in the North Atlantic[J]. Science, 1999, 283(5404): 971-975.
    [6] Sachs J P, Lehman S J. Subtropical North Atlantic temperatures 60,000 to 30,000 years ago[J]. Science, 1999, 286(5440): 756-759.
    [7] Ganopolski A, Rahmstorf S. Abrupt glacial climate changes due to stochastic resonance[J]. Physical Review Letters, 2002, 88(3): 038501.
    [8] Landais A, Masson-Delmotte V, Stenni B, et al. A review of the bipolar see–saw from synchronized and high resolution ice core water stable isotope records from Greenland and East Antarctica[J]. Quaternary Science Reviews, 2015, 114: 18-32.
    [9] Schulz H, von Rad U, Erlenkeuser H, et al. Correlation between Arabian Sea and Greenland climate oscillations of the past 110,000 years[J]. Nature, 1998, 393(6680): 54-57.
    [10] Wang Y J, Cheng H, Edwards R L, et al. A high-resolution absolute-dated Late Pleistocene Monsoon record from Hulu Cave, China[J]. Science, 2001, 294(5550): 2345-2348.
    [11] Burns S J, Fleitmann D, Matter A, et al. Indian ocean climate and an absolute chronology over Dansgaard/Oeschger events 9 to 13[J]. Science, 2003, 301(5638): 1365-1367.
    [12] Duan W H, Cheng H, Tan M, et al. Onset and duration of transitions into Greenland Interstadials 15.2 and 14 in northern China constrained by an annually laminated stalagmite[J]. Scientific Reports, 2016, 6: 20844.
    [13] Cai Y J, An Z S, Cheng H, et al. High-resolution absolute-dated Indian Monsoon record between 53 and 36 ka from Xiaobailong Cave, southwestern China[J]. Geology, 2006, 34(8): 621-624.
    [14] Duan F C, Liu D B, Cheng H, et al. A high-resolution monsoon record of millennial-scale oscillations during Late MIS 3 from Wulu Cave, south-west China[J]. Journal of Quaternary Science, 2014, 29(1): 83-90.
    [15] Han L Y, Li T Y, Cheng H, et al. Potential influence of temperature changes in the southern Hemisphere on the evolution of the Asian summer monsoon during the last glacial Period[J]. Quaternary International, 2016, 392: 239-250.
    [16] Li T Y, Han L Y, Cheng H, et al. Evolution of the Asian summer monsoon during Dansgaard/Oeschger events 13–17 recorded in a stalagmite constrained by high-precision chronology from southwest China[J]. Quaternary Research, 2017, 88(1): 121-128.
    [17] Zhang T T, Li T Y, Cheng H, et al. Stalagmite-inferred centennial variability of the Asian summer monsoon in southwest China between 58 and 79 ka BP[J]. Quaternary Science Reviews, 2017, 160: 1-12.
    [18] Song J L, Sun H Y, Tian M Z, et al. Heinrich events recorded in a loess–paleosol sequence from Hexigten, Inner Mongolia[J]. Geoscience Frontiers, 2018, 9(2): 431-439.
    [19] 朱芸,赵志军,陈晔,等. 神农架泥炭记录的MIS 3阶段环境变化及千年尺度气候波动[J]. 第四纪研究,2013,33(1):155-166.

    Zhu Yun, Zhao Zhijun, Chen Ye, et al. Record of environmental and millennial-scale climatic changes during MIS 3 by peat at Shennongjia[J]. Quaternary Sciences, 2013, 33(1): 155-166.
    [20] Chen S T, Wang Y J, Cheng H, et al. Strong coupling of Asian Monsoon and Antarctic climates on sub-orbital timescales[J]. Scientific Reports, 2016, 6: 32995.
    [21] 刘殿兵,汪永进,陈仕涛,等. 东亚季风MIS 3早期DO事件的亚旋回及全球意义[J]. 第四纪研究,2008,28(1):169-176.

    Liu Dianbing, Wang Yongjin, Chen Shitao, et al. Sub-Dansgaard-Oeschger events of East Asian Monsoon and their global significance[J]. Quaternary Sciences, 2008, 28(1): 169-176.
    [22] Cosford J, Qing H R, Yuan D X, et al. Millennial-scale variability in the Asian monsoon: Evidence from oxygen isotope records from stalagmites in Southeastern China[J]. Palaeogeography, Palaeoclimatology, Palaeoecology, 2008, 266(1/2): 3-12.
    [23] Zhang H B, Griffiths M L, Huang J H, et al. Antarctic link with East Asian summer monsoon variability during the Heinrich Stadial–Bølling interstadial transition[J]. Earth and Planetary Science Letters, 2016, 453: 243-251.
    [24] Dong J G, Shen C C, Kong X G, et al. Asian monsoon dynamics at Dansgaard/Oeschger events 14–8 and Heinrich events 5–4 in northern China[J]. Quaternary Geochronology, 2018, 47: 72-80.
    [25] Shen C C, Edwards R L, Cheng H, et al. Uranium and thorium isotopic and concentration measurements by magnetic sector inductively coupled plasma mass spectrometry[J]. Chemical Geology, 2002, 185(3/4): 165-178.
    [26] Shen C C, Wu C C, Cheng H, et al. High-precision and high-resolution carbonate 230Th dating by MC-ICP-MS with SEM protocols[J]. Geochimica et Cosmochimica Acta, 2012, 99: 71-86.
    [27] Cheng H, Edwards R L, Shen C C, et al. Improvements in 230Th dating, 230Th and 234U half-life values, and U–Th isotopic measurements by multi-collector inductively coupled plasma mass spectrometry[J]. Earth and Planetary Science Letters, 2013, 371-372: 82-91.
    [28] Hercman H, Pawlak J. MOD-AGE: An age-depth model construction algorithm[J]. Quaternary Geochronology, 2012, 12: 1-10.
    [29] Mühlinghaus C, Scholz D, Mangini A. Modelling stalagmite growth and δ13C as a function of drip interval and temperature[J]. Geochimica et Cosmochimica Acta, 2007, 71(11): 2780-2790.
    [30] Svensson A, Andersen K K, Bigler M, et al. A 60 000 year Greenland stratigraphic ice core chronology[J]. Climate of the Past, 2008, 4(1): 47-57.
    [31] Liang Y J, Wang Y J, Wang Q, et al. East Asian summer monsoon climates and cave hydrological cycles over Dansgaard-Oeschger events 14 to 11 revealed by a new stalagmite record from Hulu Cave[J]. Quaternary Research, 2019, 92(3): 725-737.
    [32] Dong J G, Shen C C, Kong X G, et al. Reconciliation of hydroclimate sequences from the Chinese Loess Plateau and low-latitude East Asian Summer Monsoon regions over the past 14,500 years[J]. Palaeogeography, Palaeoclimatology, Palaeoecology, 2015, 435: 127-135.
    [33] Sun Y B, Clemens S C, Morrill C, et al. Influence of Atlantic meridional overturning circulation on the East Asian winter monsoon[J]. Nature Geoscience, 2012, 5(1): 46-49.
    [34] Bard E. Climate shock: Abrupt changes over millennial time scales[J]. Physics Today, 2002, 55(12): 32-38.
    [35] Deplazes G, Lückge A, Peterson L C, et al. Links between tropical rainfall and North Atlantic climate during the last glacial Period[J]. Nature Geoscience, 2013, 6(3): 213-217.
    [36] Dyez K A, Zahn R, Hall I R. Multicentennial Agulhas leakage variability and links to North Atlantic climate during the past 80,000 years[J]. Paleoceanography, 2014, 29(12): 1238-1248.
    [37] EPICA Community Members. One-to-one coupling of glacial climate variability in Greenland and Antarctica[J]. Nature, 2006, 444(7116): 195-198.
    [38] Fleitmann D, Cheng H, Badertscher S, et al. Timing and climatic impact of Greenland interstadials recorded in stalagmites from northern Turkey[J]. Geophysical Research Letters, 2009, 36(19): L19707.
    [39] Kathayat G, Cheng H, Sinha A, et al. Indian monsoon variability on millennial-orbital timescales[J]. Scientific Reports, 2016, 6: 24374.
    [40] Vautravers M J, Shackleton N J, Lopez‐Martinez C, et al. Gulf Stream variability during marine isotope Stage 3[J]. Paleoceanography, 2004, 19(2): PA2011.
    [41] Stocker T F, Johnsen S J. A minimum thermodynamic model for the bipolar seesaw[J]. Paleoceanography, 2003, 18(4): 1087.
    [42] Broccoli A J, Dahl K A, Stouffer R J. Response of the ITCZ to northern Hemisphere cooling[J]. Geophysical Research Letters, 2006, 33(1): L01702.
    [43] Webster P J, Magaña V O, Palmer T N, et al. Monsoons: Processes, predictability, and the prospects for prediction[J]. Journal of Geophysical Research: Oceans, 1998, 103(C7): 14451-14510.
    [44] Zhu Y L. Variations of the summer Somali and Australia cross-equatorial flows and the implications for the Asian summer monsoon[J]. Advances in Atmospheric Sciences, 2012, 29(3): 509-518.
    [45] Lynch-Stieglitz J. The Atlantic meridional overturning circulation and abrupt climate change[J]. Annual Review of Marine Science, 2017, 9: 83-104.
    [46] Anderson R F, Ali S, Bradtmiller L I, et al. Wind-driven upwelling in the southern Ocean and the deglacial rise in atmospheric CO2 [J]. Science, 2009, 323(5920): 1443-1448.
    [47] Zhou H Y, Zhao J X, Qing W, et al. Speleothem-derived Asian summer monsoon variations in Central China, 54-46 ka[J]. Journal of Quaternary Science, 2011, 26(8): 781-790.
    [48] Cheng H, Edwards R L, Sinha A, et al. The Asian monsoon over the past 640,000 years and ice age terminations[J]. Nature, 2016, 534(7609): 640-646.
    [49] Zhou H Y, Zhao J X, Feng Y X, et al. Heinrich event 4 and Dansgaard/Oeschger events 5–10 recorded by high-resolution speleothem oxygen isotope data from central China[J]. Quaternary Research, 2014, 82(2): 394-404.
    [50] Zhou H Y, Zhao J X, Zhang P Z, et al. Decoupling of stalagmite-derived Asian summer monsoon records from North Atlantic temperature change during marine oxygen isotope stage 5d[J]. Quaternary Research, 2008, 70(2): 315-321.
    [51] 王权,汪永进,刘殿兵,等. DO3事件的湖北神农架高分辨率年纹层石笋记录[J]. 第四纪研究,2017,37(1):108-117.

    Wang Quan, Wang Yongjin, Liu Dianbing, et al. The DO3 event in Asian monsoon climates evidenced by an annually laminated stalagmite from Qingtian Cave, Mt. Shennongjia[J]. Quaternary Sciences, 2017, 37(1): 108-117.
    [52] Zhao K, Wang Y J, Edwards R L, et al. High-resolution stalagmite δ18O records of Asian monsoon changes in central and southern China spanning the MIS 3/2 transition[J]. Earth and Planetary Science Letters, 2010, 298(1/2): 191-198.
  • 加载中
通讯作者: 陈斌, bchen63@163.com
  • 1. 

    沈阳化工大学材料科学与工程学院 沈阳 110142

  1. 本站搜索
  2. 百度学术搜索
  3. 万方数据库搜索
  4. CNKI搜索

Figures(4)  / Tables(1)

Article Metrics

Article views(186) PDF downloads(76) Cited by()

Proportional views
Related
Publishing history
  • Received:  2020-04-09
  • Revised:  2021-01-06
  • Published:  2022-06-10

Structure Characteristics of DO 12 Climate Abrupt Event: Evidence from the stalagmite record, Shanxi province, in northern China

doi: 10.14027/j.issn.1000-0550.2021.005
Funds:

National Natural Science Foundation of China 41102216, 41472317, 41877287

Jiangsu Students’Projects for Innovation and Entrepreneur⁃ship Training Program 201910304116Y, 202010304116Y

Abstract: To date, the pattern of Dansgaard-Oeschger (DO) events in response to monsoon climate is a question of greatest interest in paleoclimate research. Whether it is manifested as a single pattern or as multiple patterns remains controversial. A high-resolution oxygen isotope profile established with 239 oxygen isotope and 15 230Th dates from the Dragon Cave, Shanxi province, North China, provides a detailed history of the East Asian summer monsoon (EASM) variation during the middle marine isotope stage (MIS 3). Our records show significant millennial-scale variability, and are consistent in rate with DO events 11⁃12 and Heinrich event 5 recorded in other Chinese caves and in the Greenland ice core. Their close consistency supports a strong climatic link between high and low latitudes.Early in the DO 12 event, the δ18O values of stalagmite L2 remained negative, indicating the persistent intensification of the Asian summer monsoon, which is quite different from the pattern of stepwise temperature decrease recorded in the Greenland ice core after approaching the maximum. Comparison of records from different regions demonstrates that the response to the DO event of the Asian summer monsoon, and to the tropical low-latitude hydrological process, was characterized by an asymmetrical inverted V-shape. This may have been related to the release of latent heat from the southern ocean and a strengthened cross-equatorial flow (later weakened), resulting in the intertropical convergence zone (ITCZ) gradually north (south). By extension, the summer monsoon in Northern China started to increase continuously, and eventually wane.

ZHANG Han, HUANG Wei, JIANG Ying, CHEN ZiYuan, SHEN ChuanChou, DONG JinGuo. Structure Characteristics of DO 12 Climate Abrupt Event: Evidence from the stalagmite record, Shanxi province, in northern China[J]. Acta Sedimentologica Sinica, 2022, 40(3): 765-773. doi: 10.14027/j.issn.1000-0550.2021.005
Citation: ZHANG Han, HUANG Wei, JIANG Ying, CHEN ZiYuan, SHEN ChuanChou, DONG JinGuo. Structure Characteristics of DO 12 Climate Abrupt Event: Evidence from the stalagmite record, Shanxi province, in northern China[J]. Acta Sedimentologica Sinica, 2022, 40(3): 765-773. doi: 10.14027/j.issn.1000-0550.2021.005
  • 一系列千年尺度突变事件是末次冰期气候重要特征之一[1],其中Dansgaard-Oeschger(DO)旋回成为古气候学家关注的焦点。尽管DO事件在空间分布上具有全球性特征[2],但其变化模式和结构特征存在时空差异。在时间上,DO事件的持续时间不尽相同,如格陵兰冰芯记录的DO3间冰阶持续时间为100 a,DO12则为2 600 a[3]。在深海氧同位素(MIS)4阶段,DO气候事件表现为“低频高幅”特征;在MIS3阶段则表现为“高频高幅”并达到鼎盛期[4],这可能与该时段中等大陆冰盖规模、太阳辐射量、大气CO2浓度等气候边界条件有关[5-6]。在这种气候背景下,全球气候边界条件接近阀值状态,易引发各种气候要素快速变化[7]

    在空间上,两极冰芯记录在DO气候旋回中表现出固定的变化模式,即格陵兰冰芯以突变形式开始的“类直角梯形”,而南极冰芯呈现出缓慢升温、缓慢降温的“类等腰三角形”[8]。尽管目前研究已经建立了亚洲季风记录与北大西洋气候的联系,揭示了北高纬气候对低纬水文循环的驱动机制[9-11],但亚洲季风对DO事件的响应模式仍然存在多种可能性。Duan et al.[12]通过中国北方年纹层石笋记录研究认为,其δ 18O记录的DO15.2和14事件开始阶段无论是持续时间还是突变特征均与格陵兰冰芯记录高度一致。然而,中国南方石笋记录则表明,其在DO事件起始过程中普遍呈现出类南极冰芯的“缓变”响应特征[13-17]。另外,经棚黄土剖面记录的DO12事件呈现出不对称的“两峰一谷”形态[18],神农架大九湖泥炭记录与之类似[19],但重建的大气湿度变化则呈现出四个“冷暖旋回”的高频变化。在石笋记录中,湖北永兴洞在DO12事件过程中呈现出一系列百年尺度的次级波动[20-21],广西响水洞则刻画了“双峰”形态[22];在Heinrich 1事件(简称H1事件)向冰消阶段转型过程中,石笋指示的夏季风变化呈现“两相位”模式[23],其可能在其他气候转换时段也存在类似的变化特征。由此,目前面临的问题是:季风响应的类DO事件是否具有统一的变化模式和过程?如果的确存在区域差异,其背后的驱动机制又是什么?

    黄土高原位于现代东亚夏季风影响的边缘区,对东亚夏季风强/弱变化非常敏感。本文利用山西龙洞(编号:L2)高分辨率石笋δ 18O序列重建了MIS3中期东亚夏季风的演化历史,尝试解析千年尺度DO12事件的变化模式,并初步探讨高、低纬气候系统联系的动力学机制。

  • 山西省地处大陆东岸中纬度内陆,是典型黄土广泛覆盖的山地高原,其地势东北高西南低,有利于东亚夏季风的入侵。同时,该区域又位于东亚夏季风影响的边缘区,对冬、夏季风环流的进退变化非常敏感[24]

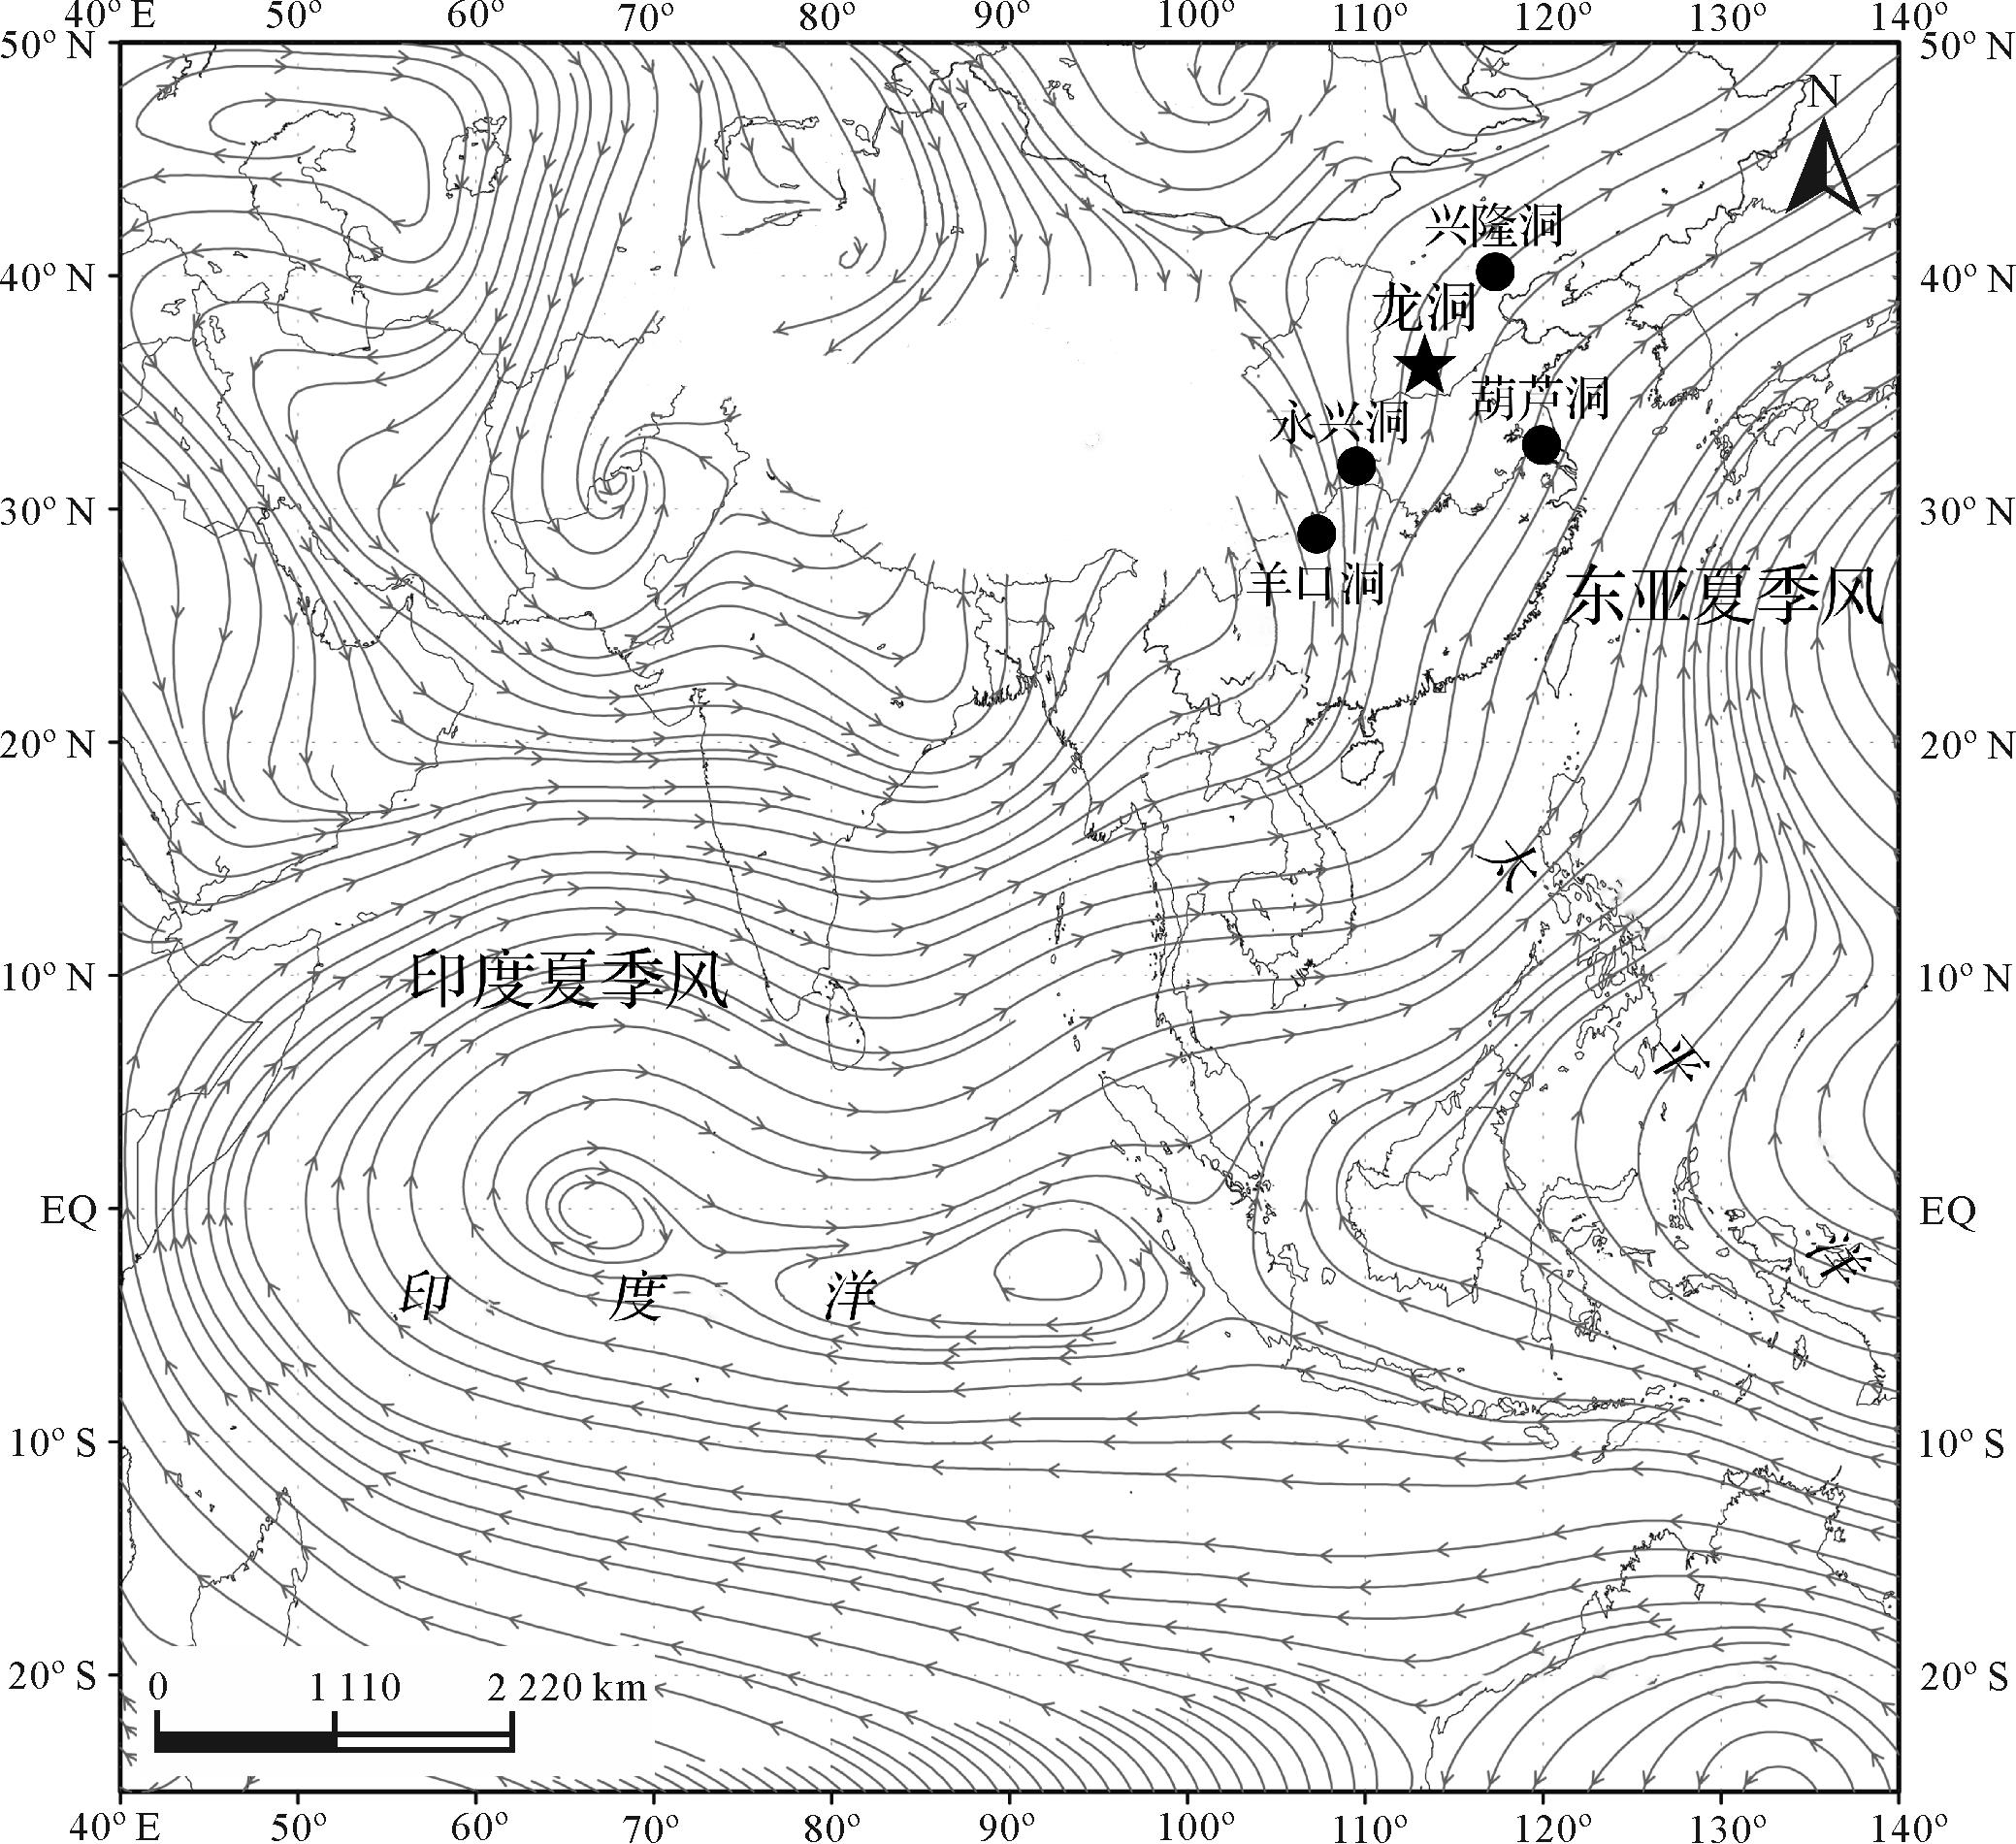
    太行龙洞(36º46΄ N,113º16΄ E,图1)位于山西省长治市东南60 km处,洞口海拔为1 600 m。洞长约1 000 m,洞内实测温度为11 ℃,湿度接近100%(2014年7月测量结果)。受东亚夏季风影响,区域年平均降雨量约为530 mm,集中分布在5—10月,约占全年降雨量的87%。洞穴外部植被覆盖较好,主要由灌木和乔木组成。

    Figure 1.  Location of Dragon Cave (star) and other caves (circles)

  • L2采集时已停止生长,高约250 mm,外表皮光滑且颜色泛白。样品呈柱形尖头状,底部直径约为84 mm。取其一半打磨剖光,在日光下可见清晰水平状生长层。样品自上而下均由纯净碳酸盐方解石组成,岩性致密无溶孔。在抛光面上,用直径为0.9 mm牙钻沿石笋地层顺序钻取13个年代样,每个样品重量约为100~200 mg,化学分析和测试在台湾大学高精度质谱与环境变迁实验室完成测试[25],采用同位素稀释法修正质量偏差,测定U-Th含量和同位素组成[26],U-Th半衰期数值参照Cheng et al.[27];分析仪器为多接收器电感耦合等离子体质谱仪(MC-ICP-MS Neptune),年龄分析误差为±2σ,结果见表1。同时,沿石笋生长中心轴采用0.3 mm的钻头,以1 mm为间距获取239个氧同位素数据。使用碳酸盐自动进样装置(KIEL CARBONATE DEVICE Ⅲ),将磷酸与CaCO3反应提取CO2,其经纯化后送入MAT-253质谱仪上进行加速离子化检测,每批测试样品插入4个标准样品(NBS-19)进行仪器状态监测。分析误差小于±0.06‰,实验标准为VPDB,由南京师范大学地理科学学院同位素实验室完成。

    样品号 深度/mm 238U/×10-9 232Th/×10-12 234U/测量值a [230Th/238U]活度比b 未校正年龄(a B.P.) 校正年龄(a B.P.)c,d δ 234Uinitial校正初始值c
    L2-10 1 403.3±4.5 112.9±7.6 3 579±18 1.5149±0.005 9 41 579±269 41 579±269 4 026±21
    L2-31 1 665.54±2.46 18.6±4.2 3 558.2±7.0 1.527±0.002 6 42 139±111 42 139±111 4 007.5±20.1
    L2-38 1 896.96±2.81 21.8±4.4 3 553.2±6.8 1.533 4±0.003 0 42 398±121 42 398±121 4 004.8±5.2
    L2-55 1 438.6±5.2 63.6±5.5 3 573.3±14.3 1.544 03±0.006 13 42 521±251 42 520±251 4 029±16
    L2-61 1 486.32±2.39 9.8±3.1 3 561.4±7.3 1.550 3±0.002 8 42 854±122 42 854±122 4 019.3±7.7
    L2-79 1 858.85±2.88 9.1±3.7 3 546±6.8 1.553 5±0.002 9 43 128±120 43 128±120 4 005±25.8
    L2-110 1 016±1.5 2.8±6.1 3 521.3±6.6 1.581 33±0.003 88 44 316±149 44 316±149 3 990.4±7.7
    L2-131 1 321.33±1.88 89.2±3.4 3 505.8±6.9 1.584±0.002 7 44 585±120 44 585±120 3 975.9±217
    L2-164 1 304.3±2.3 25.4±4.6 3 501.3±8.4 1.599 74±0.004 03 45 158±167 45 158±167 3 977.2±9.7
    L2-174 1 341.1±2.1 36.1±5.1 3 550.1±5.8 1.630 4±0.003 5 45 587±135 45 586±135 4 037.5±6.8
    L2-209 1 541.78±2.31 106.4±4.5 3 525.5±6.4 1.664 1±0.003 1 47 006±131 47 005±131 4 025.6±81.2
    L2-240 1 110.8±3.6 150.8±6.5 3 505±16 1.675 6±0.006 7 47 706±308 47 705±308 4 011±19
    L2-247 847.4±1.19 454.1±4.3 3 481.9±6.0 1.676 3±0.003 2 47 967±132 47 964±132 3 986.5±7.1

    Table 1.  MC⁃ICP⁃MS 230Th dates for stalagmite L2
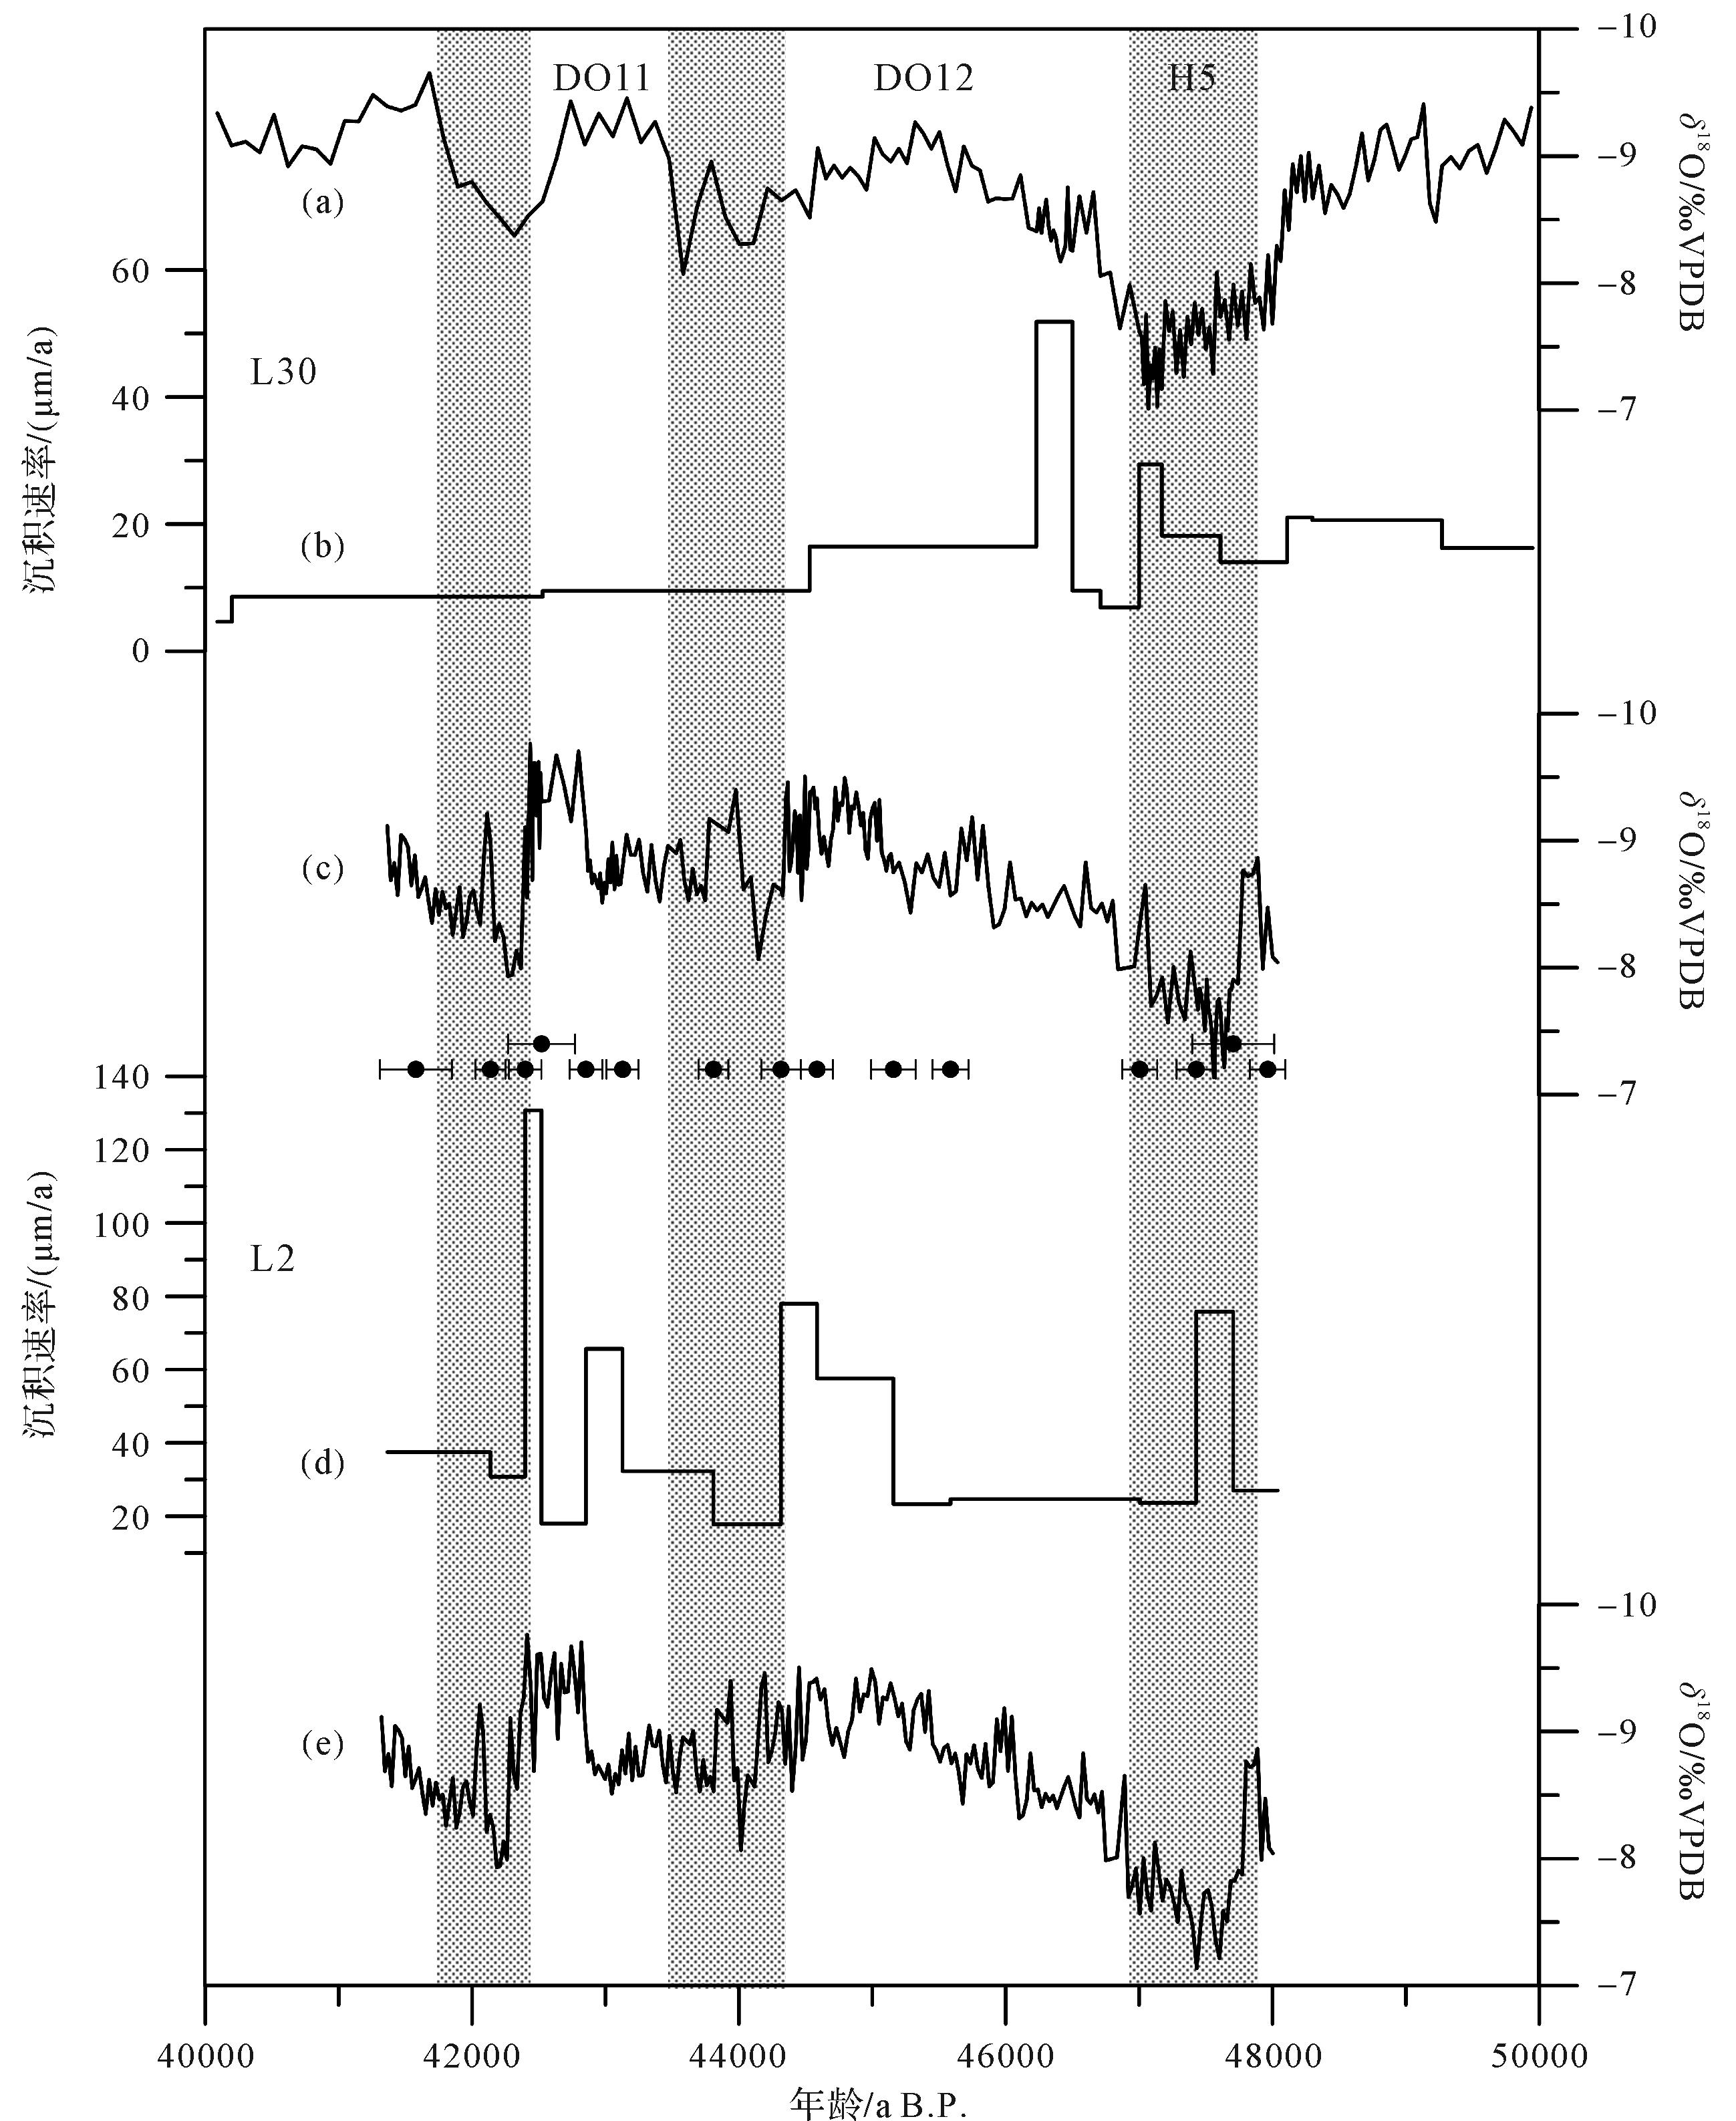
  • 表1可知,石笋238U含量相对较高(0.8~1.9)×10-6,而232Th含量相对较低(0.003~0.45)×10-9,因此测年精度整体较高。本文所测年龄均按沉积先后序列排列,通过对实测年龄点线性等间距内插建立MIS3中期48~41 ka B.P.时段石笋沉积演化时间序列(图2c)。同时,考虑到L2样品沉积速率不稳定(图2d),笔者根据Hercman et al.[28]提出的深度—年龄算法,重构了模拟时标(图2e)。对比结果显示:模拟时标与同一洞穴L30石笋时间序列相对更为吻合(图2a,e)。因此,本文利用模拟时标建立了石笋L2 δ 18O时标序列。

    Figure 2.  Comparisons of δ 18O record and growth rate from Dragon Cave during the last glacial period for (a, b) L30[24]; (c, d) L2 (this study); (e) model age reconstructed for L2 record with depths and dates[28]

  • 石笋L2 δ 18O在-9.7‰~-7.1‰之间波动(图2c),振幅约为2.6‰。在46.9 ka B.P.,δ 18O值突然变轻(振幅达到1‰),指示H5事件的结束;随后δ 18O值持续偏轻,在45 ka B.P.时达到最小值(-9.5‰)。在此期间,石笋δ 18O值在亚千年—百年尺度上存在明显波动。在42.9 ka B.P.,δ 18O值由-8.5‰负偏至-9.7‰,可能对应于DO11事件,最后在42.2 ka B.P. 左右正偏至-8‰。

  • 来自同一洞穴L30的δ 18O记录[24]在测年误差范围内与L2共同记录了H5,DO12和DO11等千年尺度气候事件,表明龙洞石笋记录具有重要的气候参考意义。然而,两支石笋记录也存在一些细节差异,主要表现为:1)L30记录的DO11事件始于43.5 ka B.P.,并持续了1 ka左右;而L2记录的时间则较晚,持续时间明显受到“压缩”(图2c)。2)在DO12事件期间,L30 δ 18O值逐渐偏负,并在45.3 ka B.P.开始转为逐渐偏正(至-8.3‰)的过程;而L2 δ 18O值则整体呈现出持续偏负的过程,在结束时开始快速正偏,并呈现出明显的次级波动信号。3)在H5事件内部,L30 δ 18O值持续偏正,变幅达到1‰;相反,L2 δ 18O则呈现出偏负趋势。笔者基于测年点计算出了两支石笋的沉积速率变化,结果显示(图2b,d),L30石笋沉积速率偏低(均值为16.5 μm/a),但较为稳定,大部分在4.7~29.4 μm/a范围波动,只有在46.5~46.2 ka B.P.时段的沉积速率显著上升(51.8 μm/a);L2石笋的沉积速率则较高(均值为43.8 μm/a),但不稳定,在17~130 μm/a范围波动。因此,考虑到洞穴岩溶系统不同位置渗水通道差异所引起的石笋生长速率的快慢变化,结合本文采用的模拟时间序列(图2c),石笋各阶段真实的沉积速率并不能完全反映出来。同时,石笋沉积速率变率太大也会导致其沉积过程中存在不同程度的同位素动力分馏效应[29],这些洞内非气候因素可能是造成同一洞穴两支相同生长时段石笋δ 18O记录存在细节差异的原因之一。然而,正如图3所示,在千年—亚千年尺度气候事件和长期趋势变化方面,L2和L30记录之间具有良好的对应性和协同性,即δ 18O变化主要取决于洞穴外界气候环境的变化。

    Figure 3.  Comparisons between (a) NGRIP ice core δ 18O record (GICC05 timescale) [30]; (b) stalagmite δ 18O records including L30[28]; (c) L2 (model age, this study); (d) Yongxing Cave[2021]; (e) stalagmites MSL (black) [10] and HL161 (gray)[31] from Hulu Cave; and (f) from Yangkou Cave[15]

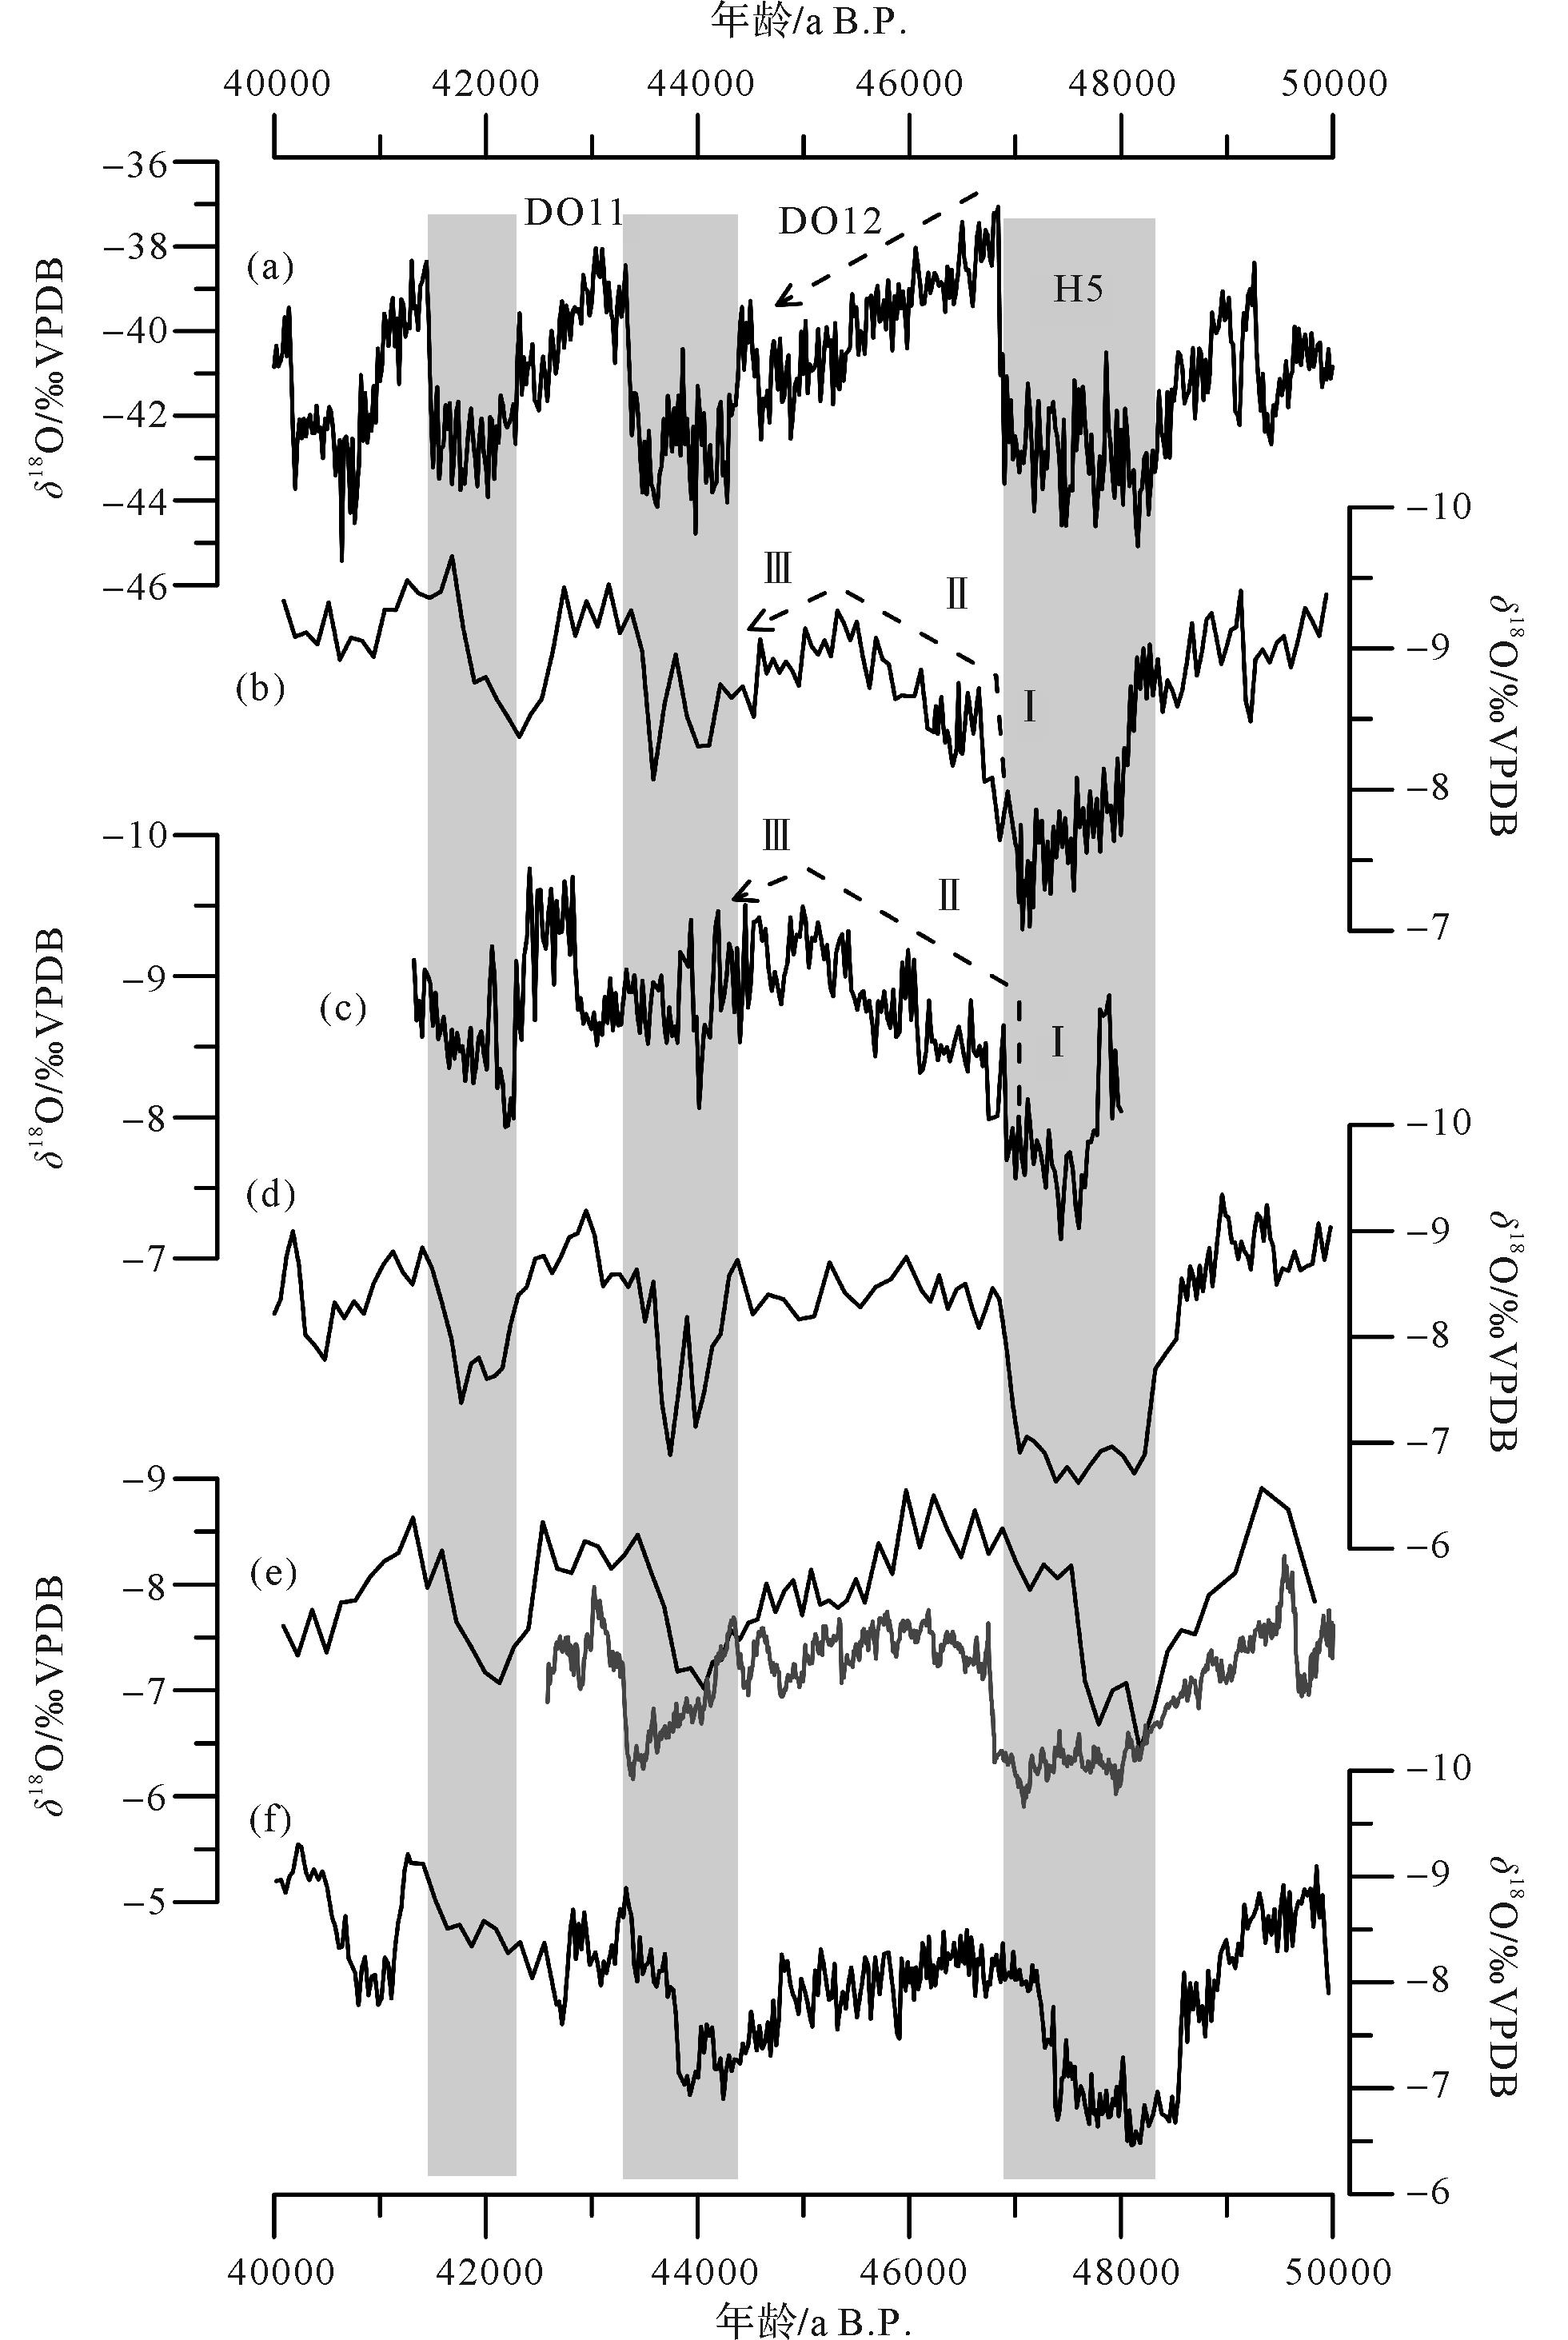
    过去的研究工作已表明:山西石笋δ 18O值越偏负,指示亚洲夏季风越强,夏季风边界北移,区域季风降水愈多;反之,δ 18O值越偏正,夏季风降水越少[24,32]。龙洞石笋δ 18O记录(图3b,c)在轨道趋势以及千年尺度波动变化特征方面与湖北永兴洞(图3d)、南京葫芦洞(图3e)、重庆羊口洞(图3f)记录具有很好的一致性,清晰地记录了3次显著的弱季风事件和2次强季风事件如DO12和DO11事件。而且,自弱季风事件结束后,中低纬石笋记录的季风气候总体呈现短暂的“突变”特征,即本文称之为“第一相位I”(图3),与格陵兰地区气温快速增温过程相对应,暗示其可能受到北高纬气候的控制[9-10]。例如,在H5事件结束后,L2和L30 δ 18O值在数十年内从-7.7‰负偏至-8.7‰(图3c);同样,重庆羊口洞(图3f)、湖北永兴洞(图3c)δ 18O振幅在不足100年内也超过了1‰。南京葫芦洞(图3e,灰色曲线)的“突变性”特征更加类似格陵兰冰芯记录,表明洞穴石笋δ 18O信号在气候过渡阶段的高敏感性。总体而言,在各自测年误差范围内,这些千年尺度的弱、强季风事件与格陵兰冰芯记录的冷、暖气候突变事件在起、止时间上可视为同步变化。这种较好的一致性表明,高、低纬气候系统之间存在紧密的遥相关联系,也支持了北大西洋地区通过海—气耦合对低纬季风环流起调控作用的观点[10,33]

  • 在DO12事件中,亚洲夏季风强度与格陵兰温度变化特征具有趋势上的显著差异(图34)。格陵兰冰芯δ 18O记录显示,H5冷事件结束时当地气温快速回升到最高值,后而开始逐渐下降,呈明显的“类直角梯形”。然而,在中低纬亚洲季风区,山西龙洞两记录显示,东亚夏季风强度在H5事件结束后先是突然增强,而后缓慢地持续增强达到最大,随后开始逐渐减弱直到下一个冰阶的来临,呈不对称倒“V”形。同样,南京葫芦洞MSL和HL161记录在该时段也呈现倒“V”形(图3e),尽管HL161 δ 18O记录在此过程中表现的不够明显。在西南地区,高分辨率的羊口洞石笋记录在DO12事件过程也呈现出不对称倒“V”形(图3f),而长江中游地区湖北永兴洞石笋记录的这一特征不够明显,呈现出相对平稳的状态(图3d)。

    Figure 4.  Comparisons of multi⁃proxy records for the DO12 stage from high to low latitudes

    除了中国季风区的石笋记录外,其他地区如地中海Sofular洞[38]、印度北部Bittoo洞[39]和也门Moomi洞记录[11]均呈现出相似的不对称倒“V”形变化模式。无独有偶,北亚热带大西洋海表温度在DO12期间的变化特征与格陵兰温度逐渐下降的趋势也具有明显差异(图4c)。而且众多海洋钻孔记录显示,末次冰期北大西洋30°~40°区域的间冰阶海表温度变化均呈现出类倒“V”形的相对稳定特征[40],尤其是冬春季温度变化表现的更为明显,可能受到大范围风场变化的控制。在DO12期间,科里亚科海盆岩芯反照率指示的热带辐合带(ITCZ)位置在H5事件结束后快速北进,随后总体向北逐渐推进,在DO12事件后半段开始逐步南撤(图4d),其结构特征也呈不对称倒“V”形,但整体上保持了相对稳定的水汽输送能力,为丰沛的低纬季风降水以及活跃的大气对流活动提供了必要条件。另外,我们也注意到南大西洋海表温度(图4e)和南极气温(图4f)在DO12期间呈持续下降。在Seesaw模式调控下[41],南北半球由于温差和气压差导致ITCZ位置的南北移动,以及越赤道气流方向和影响范围的变化[42],澳—亚季风系统得以建立和维持[43-44]。当DO12暖阶开始时,北大西洋深层流恢复[45],南大洋不断将潜热输送到亚洲大陆,ITCZ(图4d)和南半球西风带逐渐向北移动[46],北半球快速变暖,亚洲夏季风开始显著增强(对应于第一相位I)。在此期间,印度季风区得到越赤道气流带来的充沛水汽,大气对流活动显著增强[35],季风降水增加。这种持续供给的水汽源通过印度季风和东亚季风环流向我国北部输送,带来大范围降水(对应于第二相位Ⅱ)。相反,到DO12暖阶后期,南大洋热量积累逐渐被释放,导致越赤道气流规模和强度有所减弱;而且,格陵兰地区气温持续降低可能导致北半球西风带强度增强,致使低纬ITCZ的位置随之南移,亚洲夏季风强度开始呈下降趋势(对应于第三相位Ⅲ),即表现为石笋δ 18O记录中的倒“V”形模式。这一推测能够解释华北和西南两处跨越数千公里的洞穴石笋δ 18O记录共同响应了DO12期间亚洲夏季风从持续增强到逐渐减弱的历史(图34)。

    以龙洞等为代表的亚洲季风区洞穴石笋记录在千年尺度冷暖事件转型上具有鲜明的特征。以DO12事件为例,山西石笋记录的夏季风状态呈现出先快速上升(Ⅰ),再逐渐平稳变化达到最大值(Ⅱ)后开始逐渐减弱(Ⅲ)的“三相位”特征(图34),这与以往中国中部和西南地区的石笋记录特征相一致[15,47]。除此之外,诸如DO1、DO8、DO12、DO17、DO19、DO20、DO22等持续较长时间的千年尺度事件在南方石笋记录中均呈现“三相位”转型模式[10,14,20,23,47-50];在靠近南大洋一侧的贵州和湖北西南部石笋记录显示,持续时间较短的DO事件也详细印刻了此类特征的痕迹[51-52]。在北方地区,具有年纹层时标控制的高分辨率河北兴隆洞石笋δ 18O记录显示,持续时间较长的DO14强季风事件也具有类似的“三相位”变化特征[12]。石笋XL-1 δ 18O值在DO15冷阶结束后十几年内突然偏负,随后缓慢持续负偏至-10‰,后又在DO14下半阶段开始呈现逐渐偏正过程[12],与龙洞记录的DO12,14事件一样具有倒“V”形结构特征[24]

    综上所述,亚洲季风区石笋δ 18O记录的DO事件“第一相位I”突变特征与格陵兰冰芯记录的快速增温过程相一致,体现了北高纬气候对低纬季风环流的调控作用。同时,其“第二相位Ⅱ”缓变特征与南大洋温度变化趋势相似,暗示了南大洋水文过程对低纬季风的影响,随后“第三相位Ⅲ”缓变特征又与格陵兰地区持续降温过程相类似,表明了北高纬气候再次对低纬季风环流的主导调控作用。为此,低纬夏季风强度变化响应的DO事件表现为南北半球的“混合模式”。

  • 地处现代季风边缘区的山西龙洞石笋记录了MIS3中期(48~41 ka B.P.)以来东亚夏季风强度演化历史。通过高精度铀钍定年,建立了高分辨率的石笋δ 18O时间序列,清晰记录了类H5,DO12和DO11等千年尺度气候事件,并初步得出以下结论:

    (1) 龙洞石笋δ 18O记录与中国其他地区的石笋记录在变化趋势和千年尺度变化特征方面具有较好的一致性,表明了大区域范围内中国石笋δ 18O气候信号的真实性和可靠性;山西石笋记录的千年尺度季风事件响应于格陵兰地区气温的冷暖波动,进一步支持北大西洋气候通过海—气耦合机制对低纬季风环流的调控作用。

    (2) 在H5/DO12或者冷阶/暖阶转型阶段,石笋记录的亚洲夏季风表现为“三相位”变化特征;在DO事件过程的变化模式上,低纬水文过程总体呈现出不对称倒“V”形模式。DO12期间,L2 δ 18O值在突变后呈“阶梯式”持续偏负,并在临近结束时快速偏正,与中国中部、东部和西南地区的记录相似,但与格陵兰冰芯记录不同,体现了低纬季风所记录的南北半球信号的“混合模式”,这可能与南大洋潜热释放以及ITCZ南北移动施加的影响有关。

Reference (52)

Catalog

    /

    DownLoad:  Full-Size Img  PowerPoint
    Return
    Return