Advanced Search
Volume 40 Issue 5
Oct.  2022
Turn off MathJax
Article Contents

HOU QingJie, LIU XianTai, HAN HongWei, LIU HaoJie, WEI GuoHua, CHEN YuMao, YU WenZheng, WANG QiYun. Fractal Characteristics, Prediction and Application for Pores in a Tight Beach-bar Sand Reservoir: A case study for Dongying Sag[J]. Acta Sedimentologica Sinica, 2022, 40(5): 1439-1450. doi: 10.14027/j.issn.1000-0550.2021.060
Citation: HOU QingJie, LIU XianTai, HAN HongWei, LIU HaoJie, WEI GuoHua, CHEN YuMao, YU WenZheng, WANG QiYun. Fractal Characteristics, Prediction and Application for Pores in a Tight Beach-bar Sand Reservoir: A case study for Dongying Sag[J]. Acta Sedimentologica Sinica, 2022, 40(5): 1439-1450. doi: 10.14027/j.issn.1000-0550.2021.060

Fractal Characteristics, Prediction and Application for Pores in a Tight Beach-bar Sand Reservoir: A case study for Dongying Sag

doi: 10.14027/j.issn.1000-0550.2021.060
Funds:

Post-Doctoral Research Station, Shengli Oilfield Company YKB1907

Scientific Research Project of SINOPEC Corporation PE19008-6

  • Received Date: 2020-07-02
  • Publish Date: 2022-10-10
  • Reservoir pore fractals effectively describe reservoir porosity and permeability, as well as comprehensively reflecting reservoir pore structure and evaluating the level of reservoir development. To calculate the pore fractal dimension of tight beach-bar sand reservoirs and determine the order of production in these reservoirs and increase their production rate, the tight beach-bar sands of the upper Fourth member of the Shahejie Formation were chosen as the research target. First, 12 typical samples were selected for thin section observation, physical property testing and mercury intrusion testing. Second, the fractal dimension D of the samples was calculated from the mercury intrusion test data, wetting phase saturation definition and fractal theory. The correlation between D and physical properties and pore structure parameters are shown, and a logging prediction model for tight beach bar sand was established using the following procedure. (1) The correlation between D and conventional logging curves was analyzed; four logging parameters with a correlation coefficient r>0.86 were then selected. (2) Intervals of non-beach-bar sand facies were excluded. (3) To minimize the impact of the differences in magnitude of various logging parameters, standard normalization was performed on the selected logging curves. (4) The normalized logging parameters were fitted to the D value to establish a logging prediction formula for D. (5) The value of D predicted by the formula was compared with that calculated from the mercury intrusion data to assess the prediction accuracy and effect. (6) A correlation analysis between D and oil well productivity established a reservoir evaluation criterion for tight beach-bar sand reservoirs in the western block of the Dongying Sag, and four favorable development areas were selected. It was found that the porosity of beach-bar sand reservoirs lies mainly in the range 5%⁃18% (average 11.8%); permeability is mainly 0.01×10⁻³ to 1×10⁻³ μm2 (average 0.92×10⁻³ μm2). The porosity of beach sand reservoirs is mainly between 3% and 16% (average 8.9%), and permeability is mainly from 0.01×10⁻³ to 1×10⁻³ μm2 (average 0.67×10⁻³ μm2). All of these values are typical of tight sandstone reservoirs. The pore throat radius mostly has a single-peak distribution in the range 0.1 to1 μm, but with different peak values for beach-bar sand (0.183⁃1.529 μm, average 0.8 μm) and beach sand (0.059⁃0.189 μm, average 0.119 μm). The fractal dimensions of the 12 samples all lie within the range 2≤D≤3 (bar sand 2.222 4⁃2.531 9, average 2.441 2; beach sand 2.585 0⁃2.742 4, average 2.650 9). Analysis of the correlation between D and reservoir porosity, permeability and pore structure parameters showed that D is negatively correlated with total porosity, permeability, maximum pore throat radius, median throat radius and mercury removal efficiency, and positively correlated with displacement pressure, median pressure and sorting coefficient: in other words, an increase in D indicates worsening reservoir porosity, permeability, pore throat radius, sorting and connectivity. Four log curve parameters were selected for standard normalization, fitting and establishing a fractal dimension log prediction model: the absolute value of the micro-potential and micro-gradient difference; acoustic time difference; natural gamma radiation; and resistivity. Correlation between D predicted by the proposed model and the value calculated from the mercury intrusion data reached R2=0.936, which meets the requirements of field production and scientific research. For the blocks in the Dongying Sag not using fracturing measures, the relationship between daily oil production, cumulative oil production and fractal dimension were selected to establish an evaluation criterion based on the value of D for tight beach-bar sand reservoirs. The range 2≤D≤2.35 indicates a high-quality reservoir; 2.35≤D≤2.55 indicates a general reservoir; and 2.55≤D≤3 indicates a poor reservoir. Based on the proposed model, the presence of favorable reservoirs of tight beach-bar sands was predicted in the upper fourth member of Shahejie Formation in the western block of the Dongying Sag. High-quality reservoirs are concentrated mainly in the B424 and C107⁃C66⁃B3 well areas. This study provides a theoretical basis for determining the next step in the reservoir production sequence.
  • [1] 孙赞东,贾承造,李相方,等. 非常规油气勘探与开发(上册)[M]. 北京:石油工业出版社,2011:1-150.

    Sun Zandong, Jia Chengzao, Li Xiangfang, et al. Unconventional oil & gas exploration and development (upper volumes)[M]. Beijing: Petroleum Industry Press, 2011: 1-150.
    [2] 邹才能,陶士振,杨智,等. 中国非常规油气勘探与研究新进展[J]. 矿物岩石地球化学通报,2012, 31(4): 312-322.

    Zou Caineng, Tao Shizhen, Yang Zhi, et al. New advance in unconventional petroleum exploration and research in China[J]. Bulletin of Mineralogy, Petrology and Geochemistry, 2012, 31(4): 312-322.
    [3] 贾承造,邹才能,李建忠,等. 中国致密油评价标准、主要类型、基本特征及资源前景[J]. 石油学报,2012,33(3):343-350.

    Jia Chengzao, Zou Caineng, Li Jianzhong, et al. Assessment criteria, main types, basic features and resource prospects of the tight oil in China[J]. Acta Petrolei Sinica, 2012, 33(3): 343-350.
    [4]
    [5] 刘新,张玉纬,张威,等. 全球致密油的概念、特征、分布及潜力预测[J]. 大庆石油地质与开发,2013,32(4):168-174.

    Liu Xin, Zhang Yuwei, Zhang Wei, et al. Concept, characteristics, distribution and potential prediction of the tight oil in the world[J]. Petroleum Geology and Oilfield Development in Daqing, 2013, 32(4): 168-174.
    [6] 殷艳玲,孙志刚,王军,等. 胜利油田致密砂岩油藏微观孔隙结构特征[J]. 新疆石油地质,2015,36(6):693-695.

    Yin Yanling, Sun Zhigang, Wang Jun, et al. Micro pore structure characteristics of tight sandstone reservoirs in Shengli oilfield[J]. Xinjiang Petroleum Geology, 2015, 36(6): 693-695.
    [7] 杨勇强,邱隆伟,姜在兴,等. 陆相断陷湖盆滩坝沉积模式:以东营凹陷古近系沙四上亚段为例[J]. 石油学报,2011,32(3):417-423.

    Yang Yongqiang, Qiu Longwei, Jiang Zaixing, et al. A depositional pattern of beach bar in continental rift lake basins: A case study on the upper part of the Fourth member of the Shahejie Formation in the Dongying Sag[J]. Acta Petrolei Sinica, 2011, 32(3): 417-423.
    [8] 操应长,王健,刘惠民,等. 东营凹陷南坡沙四上亚段滩坝砂体的沉积特征及模式[J]. 中国石油大学学报(自然科学版),2009,33(6):5-10.

    Cao Yingchang, Wang Jian, Liu Huimin, et al. Sedimentary characteristics and models of beach-bar sandbodies in the upper part of the Fourth member of Paleogene in the south slope of Dongying Depression[J]. Journal of China University of Petroleum, 2009, 33(6): 5-10.
    [9] 冯动军,肖开华. 恒速压汞及核磁共振技术在四川盆地西部致密砂岩储层评价中的应用[J]. 石油实验地质,2021,43(2):368-376.

    Feng Dongjun, Xiao Kaihua. Constant velocity mercury injection and nuclear magnetic resonance in evaluation of tight sandstone reservoirs in western Sichuan Basin[J]. Petroleum Geology & Experiment, 2021, 43(2): 368-376.
    [10] 钟红利,张凤奇,赵振宇,等. 致密砂岩储层微观孔喉分布特征及对可动流体的控制作用[J]. 石油实验地质,2021,43(1):77-85.

    Zhong Hongli, Zhang Fengqi, Zhao Zhenyu, et al. Micro-scale pore-throat distributions in tight sandstone reservoirs and its constrain to movable fluid[J]. Petroleum Geology & Experiment, 2021, 43(1): 77-85.
    [11] 郑可,徐怀民,陈建文,等. 低渗储层可动流体核磁共振研究[J]. 现代地质,2013,27(3):710-718.

    Zheng Ke, Xu Huaimin, Chen Jianwen, et al. Movable fluid study of low permeability reservoir with nuclear magnetic resonance technology[J]. Geoscience, 2013, 27(3): 710-718.
    [12] 秦波,曹斌风,周进松,等. 致密砂岩气储层有效性识别和定量评价:以鄂尔多斯盆地东南部上古生界山西组一段为例[J]. 沉积学报,2019,37(2):403-415.

    Qin Bo, Cao Binfeng, Zhou Jinsong, et al. Availability identification of tight gas sandstone reservoirs and quantitative assessment: A case study from the First member of the Upper Paleozoic Shanxi Formation in the southeastern Ordos Basin[J]. Acta Sedimentologica Sinica, 2019, 37(2): 403-415.
    [13] Abdollahian A, Tadayoni M, Junin R B. A new approach to reduce uncertainty in reservoir characterization using saturation height modeling, Mesaverde tight gas sandstones, western US basins[J]. Journal of Petroleum Exploration and Production Technology, 2019, 9(3): 1953-1961.
    [14] Ozkan A, Cumella S P, Milliken K L, et al. Prediction of lithofacies and reservoir quality using well logs, Late Cretaceous Williams Fork Formation, Mamm Creek field, Piceance Basin, Colorado[J]. AAPG Bulletin, 2011, 95(10): 1699-1723.
    [15] Krohn C E. Fractal measurements of sandstones, shales, and carbonates[J]. Journal of Geophysical Research: Solid Earth, 1998, 93(B4): 3297-3305.
    [16] Krohn C E, Thompson A H. Fractal sandstone pores: Automated measurements using scanning-electron-microscope images[J]. Physical Review B, 1986, 33(9): 6366-6374.
    [17]
    [18] 朱日房,张林晔,李政,等. 陆相断陷盆地页岩油资源潜力评价:以东营凹陷沙三段下亚段为例[J]. 油气地质与采收率,2019,26(1):129-136.

    Zhu Rifang, Zhang Linye, Li Zheng, et al. Evaluation of shale oil resource potential in continental rift basin: A case study of lower Es3 member in Dongying Sag[J]. Petroleum Geology and Recovery Efficiency, 2019, 26(1): 129-136.
    [19] 张林晔,包友书,李钜源,等. 湖相页岩油可动性:以渤海湾盆地济阳坳陷东营凹陷为例[J]. 石油勘探与开发,2014,41(6):641-649.

    Zhang Linye, Bao Youshu, Li Juyuan, et al. Movability of lacustrine shale oil: A case study of Dongying Sag, Jiyang Depression, Bohai Bay Basin[J]. Petroleum Exploration and Development, 2014, 41(6): 641-649.
    [20] 张顺,陈世悦,鄢继华,等. 东营凹陷西部沙三下亚段:沙四上亚段泥页岩岩相及储层特征[J]. 天然气地球科学,2015,26(2):320-332.

    Zhang Shun, Chen Shiyue, Yan Jihua, et al. Characteristics of shale lithofacies and reservoir space in the 3rd and 4th members of Shahejie Formation, the west of Dongying Sag[J]. Natural Gas Geoscience, 2015, 26(2): 320-332.
    [21] 孙洪泉. 分形几何及其分形插值研究[J]. 河北工业大学学报,2002,31(1):56-60.

    Sun Hongquan. Fractal geometry and study on fractal interpolation[J]. Journal of Hebei University of Technology, 2002, 31(1): 56-60.
    [22] 赖锦,王贵文,郑懿琼,等. 低渗透碎屑岩储层孔隙结构分形维数计算方法:以川中地区须家河组储层41块岩样为例[J]. 东北石油大学学报,2013,37(1):1-7.

    Lai Jin, Wang Guiwen, Zheng Yiqiong, et al. Method for calculating the fractal dimension of the pore structure of low permeability reservoirs: A case study on the Xujiahe Formation reservoir in central Sichuan Basin[J]. Journal of Northeast Petroleum University, 2013, 37(1): 1-7.
    [23] 张宪国,张涛,林承焰. 基于孔隙分形特征的低渗透储层孔隙结构评价[J]. 岩性油气藏,2013,25(6):40-45.

    Zhang Xianguo, Zhang Tao, Lin Chengyan. Pore structure evaluation of low permeability reservoir based on pore fractal features[J]. Lithologic Reservoirs, 2013, 25(6): 40-45.
    [24] 张岩,刘金城,徐浩,等. 陆相与过渡相煤系页岩孔隙结构及分形特征对比:以鄂尔多斯盆地东北缘延安组与太原组为例[J]. 石油学报,2017,38(9):1036-1046.

    Zhang Yan, Liu Jincheng, Xu Hao, et al. Comparison between pore structure and fractal characteristics of continental and transitional coal measures shale: A case study of Yan’an and Taiyuan formations at the northeastern margin of Ordos Basin[J]. Acta Petrolei Sinica, 2017, 38(9): 1036-1046.
    [25] 刘义坤,王永平,唐慧敏,等. 毛管压力曲线和分形理论在储层分类中的应用[J]. 岩性油气藏,2014,26(3):89-92,100.

    Liu Yikun, Wang Yongping, Tang Huimin, et al. Application of capillary pressure curves and fractal theory to reservoir classification[J]. Lithologic Reservoirs, 2014, 26(3): 89-92, 100.
    [26] Wu Y Q, Tahmasebi P, Lin C Y, et al. A comprehensive study on geometric, topological and fractal characterizations of pore systems in low-permeability reservoirs based on SEM, MICP, NMR, and X-ray CT experiments[J]. Marine and Petroleum Geology, 2019, 103: 12-28.
    [27] 张全培,吴文瑞,刘丽萍,等. 鄂尔多斯盆地镇北地区延长组超低渗透储层孔隙结构及其分形特征[J]. 油气地质与采收率,2020,27(3):20-31.

    Zhang Quanpei, Wu Wenrui, Liu Liping, et al. Pore structure and fractal characteristics of ultra-low permeability reservoirs in Yanchang Formation in Zhenbei area, Ordos Basin[J]. Petroleum Geology and Recovery Efficiency, 2020, 27(3): 20-31.
    [28] Li K W. Analytical derivation of Brooks-Corey type capillary pressure models using fractal geometry and evaluation of rock heterogeneity[J]. Journal of Petroleum Science and Engineering, 2010, 73(1/2): 20-26.
    [29] 张全培,王海红,刘美荣,等. 超低渗透储层全孔径分布及其分形特征研究[J]. 中国矿业大学学报,2020,49(6):1137-1149.

    Zhang Quanpei, Wang Haihong, Liu Meirong, et al. Study of the full pore size distribution and fractal characteristics of ultra-low permeability reservoir[J]. Journal of China University of Mining & Technology, 2020, 49(6): 1137-1149.
    [30] 贺伟,钟孚勋,贺承祖,等. 储层岩石孔隙的分形结构研究和应用[J]. 天然气工业,2000,20(2):67-70.

    He Wei, Zhong Fuxun, He Chengzu, et al. Fractal texture research on the pores in reservoir rocks and its application[J]. Natural Gas Industry, 2000, 20(2): 67-70.
    [31]
    [32] Li P, Zheng M, Bi H, et al. Pore throat structure and fractal characteristics of tight oil sandstone: A case study in the Ordos Basin, China[J]. Journal of Petroleum Science and Engineering, 2017, 149: 665-674.
  • 加载中
通讯作者: 陈斌, bchen63@163.com
  • 1. 

    沈阳化工大学材料科学与工程学院 沈阳 110142

  1. 本站搜索
  2. 百度学术搜索
  3. 万方数据库搜索
  4. CNKI搜索

Figures(10)  / Tables(5)

Article Metrics

Article views(185) PDF downloads(103) Cited by()

Proportional views
Related
Publishing history
  • Received:  2020-07-02
  • Published:  2022-10-10

Fractal Characteristics, Prediction and Application for Pores in a Tight Beach-bar Sand Reservoir: A case study for Dongying Sag

doi: 10.14027/j.issn.1000-0550.2021.060
Funds:

Post-Doctoral Research Station, Shengli Oilfield Company YKB1907

Scientific Research Project of SINOPEC Corporation PE19008-6

Abstract: Reservoir pore fractals effectively describe reservoir porosity and permeability, as well as comprehensively reflecting reservoir pore structure and evaluating the level of reservoir development. To calculate the pore fractal dimension of tight beach-bar sand reservoirs and determine the order of production in these reservoirs and increase their production rate, the tight beach-bar sands of the upper Fourth member of the Shahejie Formation were chosen as the research target. First, 12 typical samples were selected for thin section observation, physical property testing and mercury intrusion testing. Second, the fractal dimension D of the samples was calculated from the mercury intrusion test data, wetting phase saturation definition and fractal theory. The correlation between D and physical properties and pore structure parameters are shown, and a logging prediction model for tight beach bar sand was established using the following procedure. (1) The correlation between D and conventional logging curves was analyzed; four logging parameters with a correlation coefficient r>0.86 were then selected. (2) Intervals of non-beach-bar sand facies were excluded. (3) To minimize the impact of the differences in magnitude of various logging parameters, standard normalization was performed on the selected logging curves. (4) The normalized logging parameters were fitted to the D value to establish a logging prediction formula for D. (5) The value of D predicted by the formula was compared with that calculated from the mercury intrusion data to assess the prediction accuracy and effect. (6) A correlation analysis between D and oil well productivity established a reservoir evaluation criterion for tight beach-bar sand reservoirs in the western block of the Dongying Sag, and four favorable development areas were selected. It was found that the porosity of beach-bar sand reservoirs lies mainly in the range 5%⁃18% (average 11.8%); permeability is mainly 0.01×10⁻³ to 1×10⁻³ μm2 (average 0.92×10⁻³ μm2). The porosity of beach sand reservoirs is mainly between 3% and 16% (average 8.9%), and permeability is mainly from 0.01×10⁻³ to 1×10⁻³ μm2 (average 0.67×10⁻³ μm2). All of these values are typical of tight sandstone reservoirs. The pore throat radius mostly has a single-peak distribution in the range 0.1 to1 μm, but with different peak values for beach-bar sand (0.183⁃1.529 μm, average 0.8 μm) and beach sand (0.059⁃0.189 μm, average 0.119 μm). The fractal dimensions of the 12 samples all lie within the range 2≤D≤3 (bar sand 2.222 4⁃2.531 9, average 2.441 2; beach sand 2.585 0⁃2.742 4, average 2.650 9). Analysis of the correlation between D and reservoir porosity, permeability and pore structure parameters showed that D is negatively correlated with total porosity, permeability, maximum pore throat radius, median throat radius and mercury removal efficiency, and positively correlated with displacement pressure, median pressure and sorting coefficient: in other words, an increase in D indicates worsening reservoir porosity, permeability, pore throat radius, sorting and connectivity. Four log curve parameters were selected for standard normalization, fitting and establishing a fractal dimension log prediction model: the absolute value of the micro-potential and micro-gradient difference; acoustic time difference; natural gamma radiation; and resistivity. Correlation between D predicted by the proposed model and the value calculated from the mercury intrusion data reached R2=0.936, which meets the requirements of field production and scientific research. For the blocks in the Dongying Sag not using fracturing measures, the relationship between daily oil production, cumulative oil production and fractal dimension were selected to establish an evaluation criterion based on the value of D for tight beach-bar sand reservoirs. The range 2≤D≤2.35 indicates a high-quality reservoir; 2.35≤D≤2.55 indicates a general reservoir; and 2.55≤D≤3 indicates a poor reservoir. Based on the proposed model, the presence of favorable reservoirs of tight beach-bar sands was predicted in the upper fourth member of Shahejie Formation in the western block of the Dongying Sag. High-quality reservoirs are concentrated mainly in the B424 and C107⁃C66⁃B3 well areas. This study provides a theoretical basis for determining the next step in the reservoir production sequence.

HOU QingJie, LIU XianTai, HAN HongWei, LIU HaoJie, WEI GuoHua, CHEN YuMao, YU WenZheng, WANG QiYun. Fractal Characteristics, Prediction and Application for Pores in a Tight Beach-bar Sand Reservoir: A case study for Dongying Sag[J]. Acta Sedimentologica Sinica, 2022, 40(5): 1439-1450. doi: 10.14027/j.issn.1000-0550.2021.060
Citation: HOU QingJie, LIU XianTai, HAN HongWei, LIU HaoJie, WEI GuoHua, CHEN YuMao, YU WenZheng, WANG QiYun. Fractal Characteristics, Prediction and Application for Pores in a Tight Beach-bar Sand Reservoir: A case study for Dongying Sag[J]. Acta Sedimentologica Sinica, 2022, 40(5): 1439-1450. doi: 10.14027/j.issn.1000-0550.2021.060
  • 致密油是继页岩气之后全球非常规油气勘探开发的新热点[1-3],被石油工业界誉为“黑金”[4]。美国Bakken致密油已实现规模化开发,扭转了北美石油产量递减趋势,改变了全球能源格局,成为全球重要油气接替能源[5]。中国致密油勘探近两年在渤海湾、鄂尔多斯、准噶尔和塔里木等盆地相继取得了一定突破,以胜利油田为例,致密油控制储量高达2.7×10⁸ t,是常规油气藏接替能源[6],其中,致密滩坝砂储量为1.7×10⁸ t,占致密油藏储量的63%,为最主要的致密油储层类型。滩坝砂体是发育于陆相湖盆滨浅湖地区非常重要的一种沉积砂体,多分布在湖泊边缘、湖湾、湖中局部隆起的缓坡一侧,是波浪和湖流将各处带来的砂质组分再改造后在有利场所堆积而成[7]。沉积物粒度细,一般为细砂岩、粉砂岩、泥质粉砂岩等[8],总体具有薄互层特征。由于非均质性强,储量动用难度较大,动用率较低,如何实现在致密滩坝砂储层中“差中选优”是提高致密油储量动用率的关键问题之一。从其他地区致密油藏开发经验来看[9-10],孔隙结构不仅决定了储集层储集和渗流能力,也影响着最终可动油气总量[11]

    中高渗透储层通常物性较好,开发难度低,储层评价参数通常以孔隙度、渗透率及丰度为主,评价参数简单。与常规砂岩储层相比,致密砂岩储层具有孔喉尺度小、非均质性强和孔隙结构复杂的特点[12-14],评价时需要加入孔喉半径、分选系数和退汞效率等孔隙结构参数。然而,根据致密储层的特点,仅仅使用有限的样品实验参数表示整个评价层段和区域,忽略致密储层非均质性,使评价结果与实际情况有很大的偏差;如果使用测井资料预测各个评价参数,参数种类繁多导致工作量巨大,均无法综合全面地评价储层优劣。孔隙分形概念的出现在一定程度上解决了这些困难。前人研究表明,砂岩的微观孔隙结构具有很好的统计自相似性[15-16]。与经典的欧式几何相比,利用分形几何能够对孔隙结构的非均质性和复杂性进行更真实地表征,而分形维数即为定量表征孔隙分形程度的参数。孔隙分形与储层物性、孔隙结构的关系已有相关讨论,但是孔隙分形如何影响开发效果,如何利用孔隙分形评价储层优劣还少见讨论。此外,目前对于孔隙分形维数的计算多停留在单点实验测试分析的层面上,无法形成单井或者平面上连续性的预测。因此,针对以上问题,本文以东营凹陷沙四上纯下次亚段的致密滩坝砂储集层为例,利用薄片、物性及压汞等相关测试数据,计算致密滩坝砂孔喉分形维数,并探讨分形维数与储层物性、孔隙结构参数之间的关系,然后优选测井数据,建立了一种致密滩坝砂储层孔隙分形维数的测井预测模型,对东营凹陷西部地区致密滩坝砂储集层分形维数的平面分布进行了预测。基于分形维数储层评价标准,对典型区的致密滩坝砂储层进行了分类与评价,优选出有利储层分布区域,为确定开发区域动用次序提供依据。

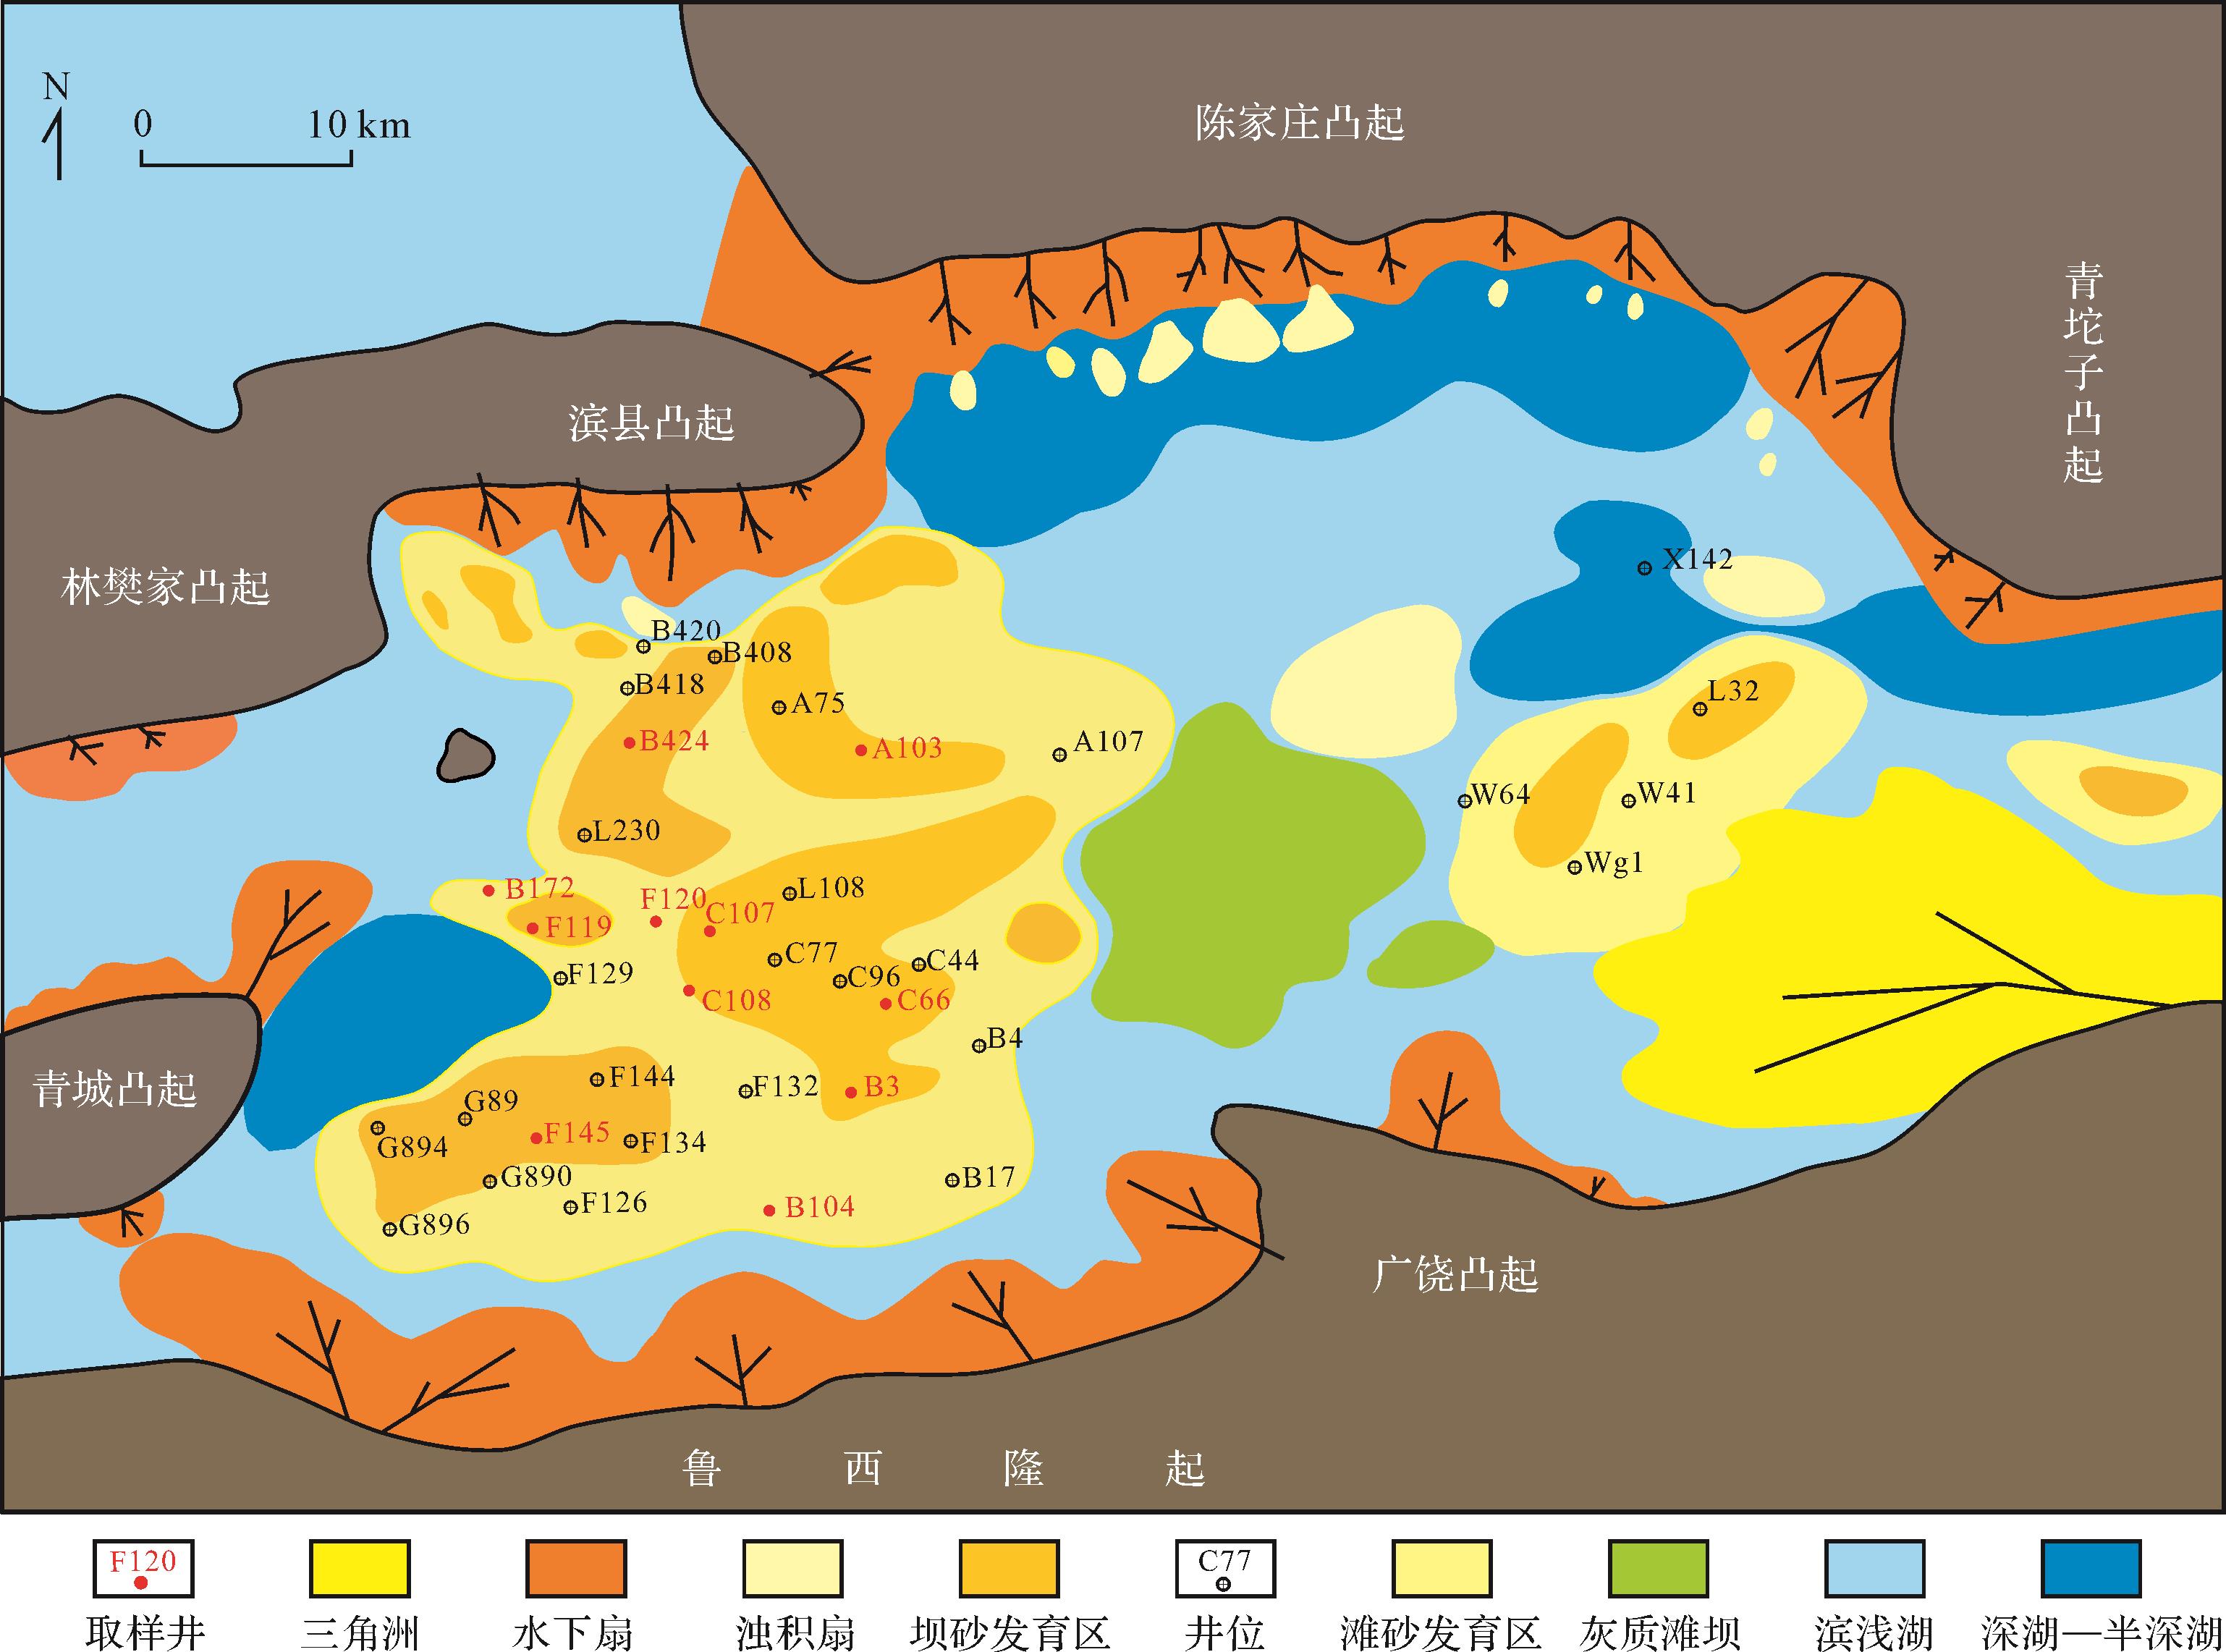
  • 研究区东营凹陷为渤海湾盆地中受陈南断裂控制的一个二级构造单元,是总体呈“北断南超”的中新生代箕状断陷盆地,南接广饶凸起,北部与陈家庄、林樊家和滨县凸起相接,东部为青坨子凸起,西部跨过青城凸起与惠民洼陷相接,面积约为5 850 km2图1[17-20]。古近系沙四段,主要分为沙四上亚段和沙四下亚段,其中,沙四上亚段又可进一步分为纯上和纯下两个次亚段。根据前人研究成果,致密滩坝砂储层主要分布于纯下次亚段,其中,坝砂单层厚度相对较大,一般大于2 m,滩砂单层厚度通常小于2 m,坝砂整体物性优于滩砂,分布区域如图1所示。

    Figure 1.  Map of Es4U beach⁃bar deposition system (after Tang[17])

  • 本次研究选取了12块东营凹陷沙四上纯下次亚段致密滩坝砂储集层样品进行岩石铸体薄片观察、物性和高压压汞测试,并基于压汞实验测试数据进行孔喉分形计算。根据薄片统计显示(表1),滩砂与坝砂的矿物碎屑组成近似,无明显差别。12个样品岩性主要为岩屑质长石砂岩。石英含量为37%~51%,平均值为46.25%;长石含量为30%~38%,平均值为34%;岩屑类型主要为变质岩、沉积岩和岩浆岩为主,含量为16%~25%,平均值为19.67%。填隙物以泥质杂基为主,含量为2%~8%,平均值为5.5%。胶结物含量为4%~21%(平均值为9.42%),主要为方解石和白云石(平均含量分别为5.08%和3.42%),其次为硅质胶结(平均含量为0.92%)。砂岩中碎屑颗粒粒径为0.06~0.32 mm,平均值为0.15 mm,主要为粉砂和细砂,成分成熟度中等,分选中等,碎屑磨圆度主要为次棱角状。

    编号井号深度/m石英/%长石/%岩屑/%云母/%杂基/%自生矿物/%砂体类型
    岩浆岩变质岩沉积岩方解石白云石增生石英
    1C1072 871.26483521050.56420.5坝砂
    2C662 871.6951312970.56540.5坝砂
    3C1083 090.31483031450.524152滩砂
    4B32 717.22463285817540.5坝砂
    5B1042 026.614836212205531滩砂
    6B1723 394.673738615408301滩砂
    7B1723 397.614038715007600.5滩砂
    8F1193 290.47453829605511滩砂
    9B4243 290.7248353770.55540.5坝砂
    10A1033 291.73493276606622坝砂
    11F1453 292.2649316860.55701坝砂
    12F1203 331.334632512504660.5滩砂
  • 滩坝砂储集层孔隙度和渗透率的统计结果表明(图2):坝砂储集层孔隙度为1.0%~30.1%(主体分布在5%~18%,平均值为11.8%);渗透率主体分布在0.1×10⁻³ μm2~10×10-3 μm2(平均值为0.92×10⁻³ μm2);滩砂储集层孔隙度为0.8%~26%(主体分布在3%~16%,平均值为8.9%),渗透率主体分布在0.01×10⁻³ μm2~1×10⁻³ μm2(平均值为0.67×10⁻³ μm2),其孔隙度和渗透率均小于坝砂储集层。从整体上看,73%的样品孔隙度小于15%,渗透率小于10×10-3 μm2,孔隙度平均值小于12%,渗透率平均值小于1×10⁻³ μm2,为典型的致密砂岩储集层。

    Figure 2.  Porosity and permeability histograms for beach⁃bar sand reservoir

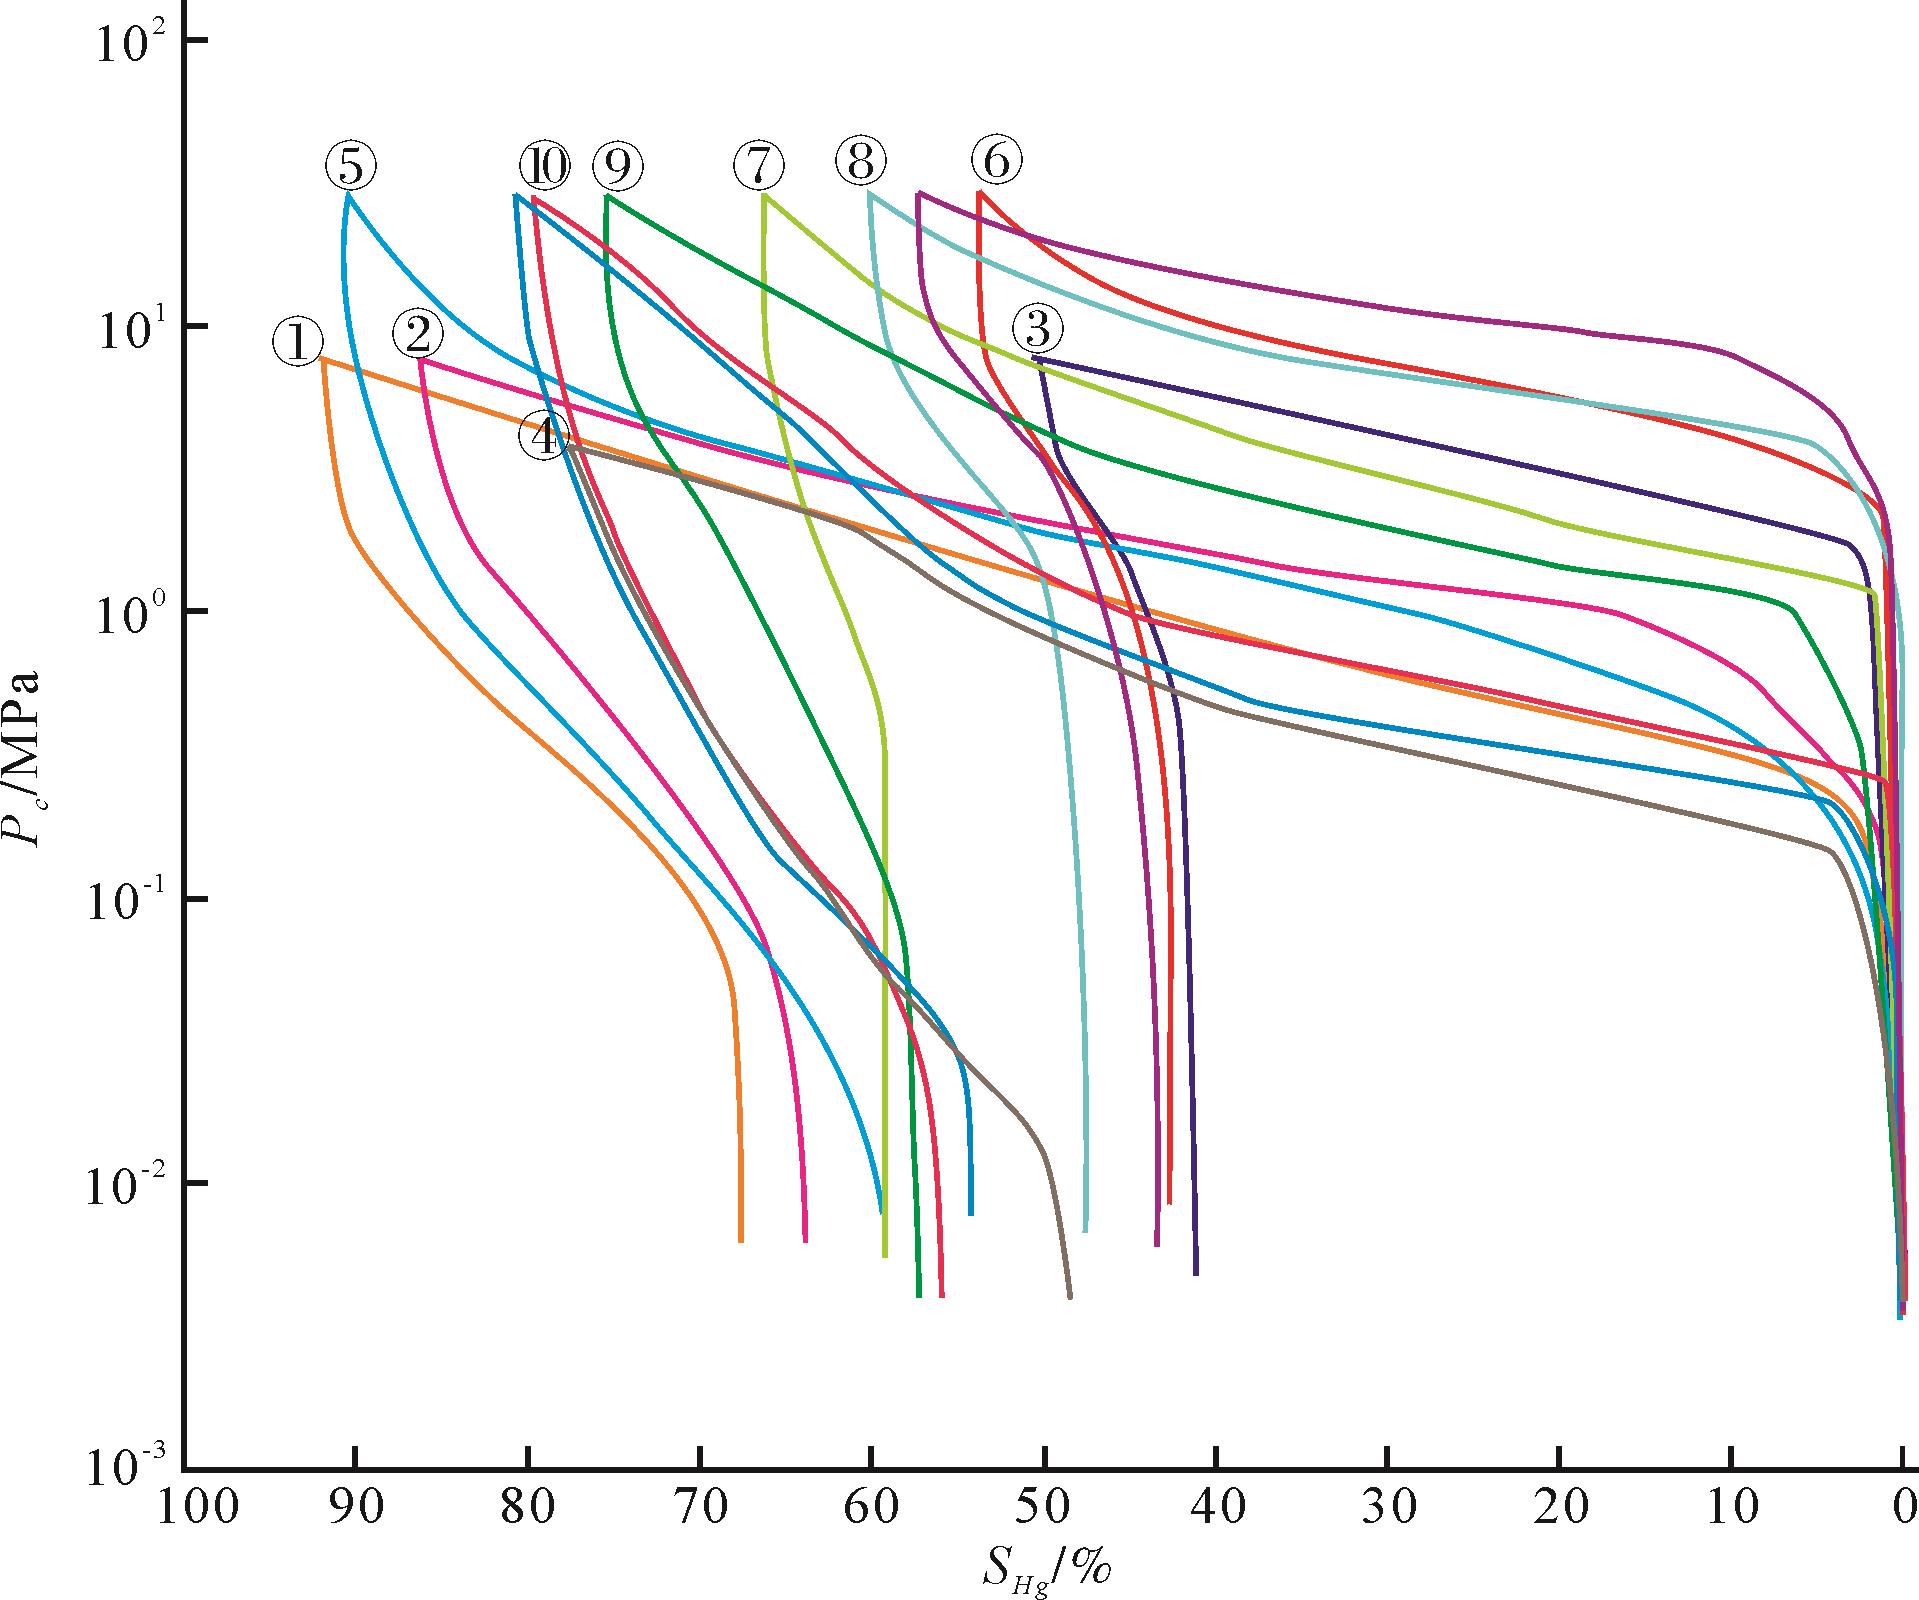
  • 12个样品的压汞曲线特征如图3所示,其中,样品编号1、2、4、9、10和11为坝砂样品,样品编号3、5、6、7、8和12为滩砂样品。压汞参数如表2所示,坝砂样品整体体现为粗歪度、分选较好的特点,排驱压力0.131~0.881 MPa(平均值为0.375 MPa),最大孔喉半径0.834~5.611 μm(平均值为2.954 μm),饱和度中值压力0.83~4.59 MPa(平均值为1.87 MPa),饱和度中值喉道半径0.16~0.886 μm(平均值为0.541 μm);滩砂样品整体体现为细歪度、分选较差的特点,排驱压力0.334~3.562 MPa(平均值为1.753 MPa),最大孔喉半径0.206~2.201 μm(平均值为0.752 μm),饱和度中值压力1.95~21.09 MPa(平均值为11.82 MPa),饱和度中值喉道半径0.035~0.377 μm(平均值为0.117 μm)。滩砂样品孔喉半径整体小于坝砂样品。

    Figure 3.  Mercury intrusion curves for 12 samples
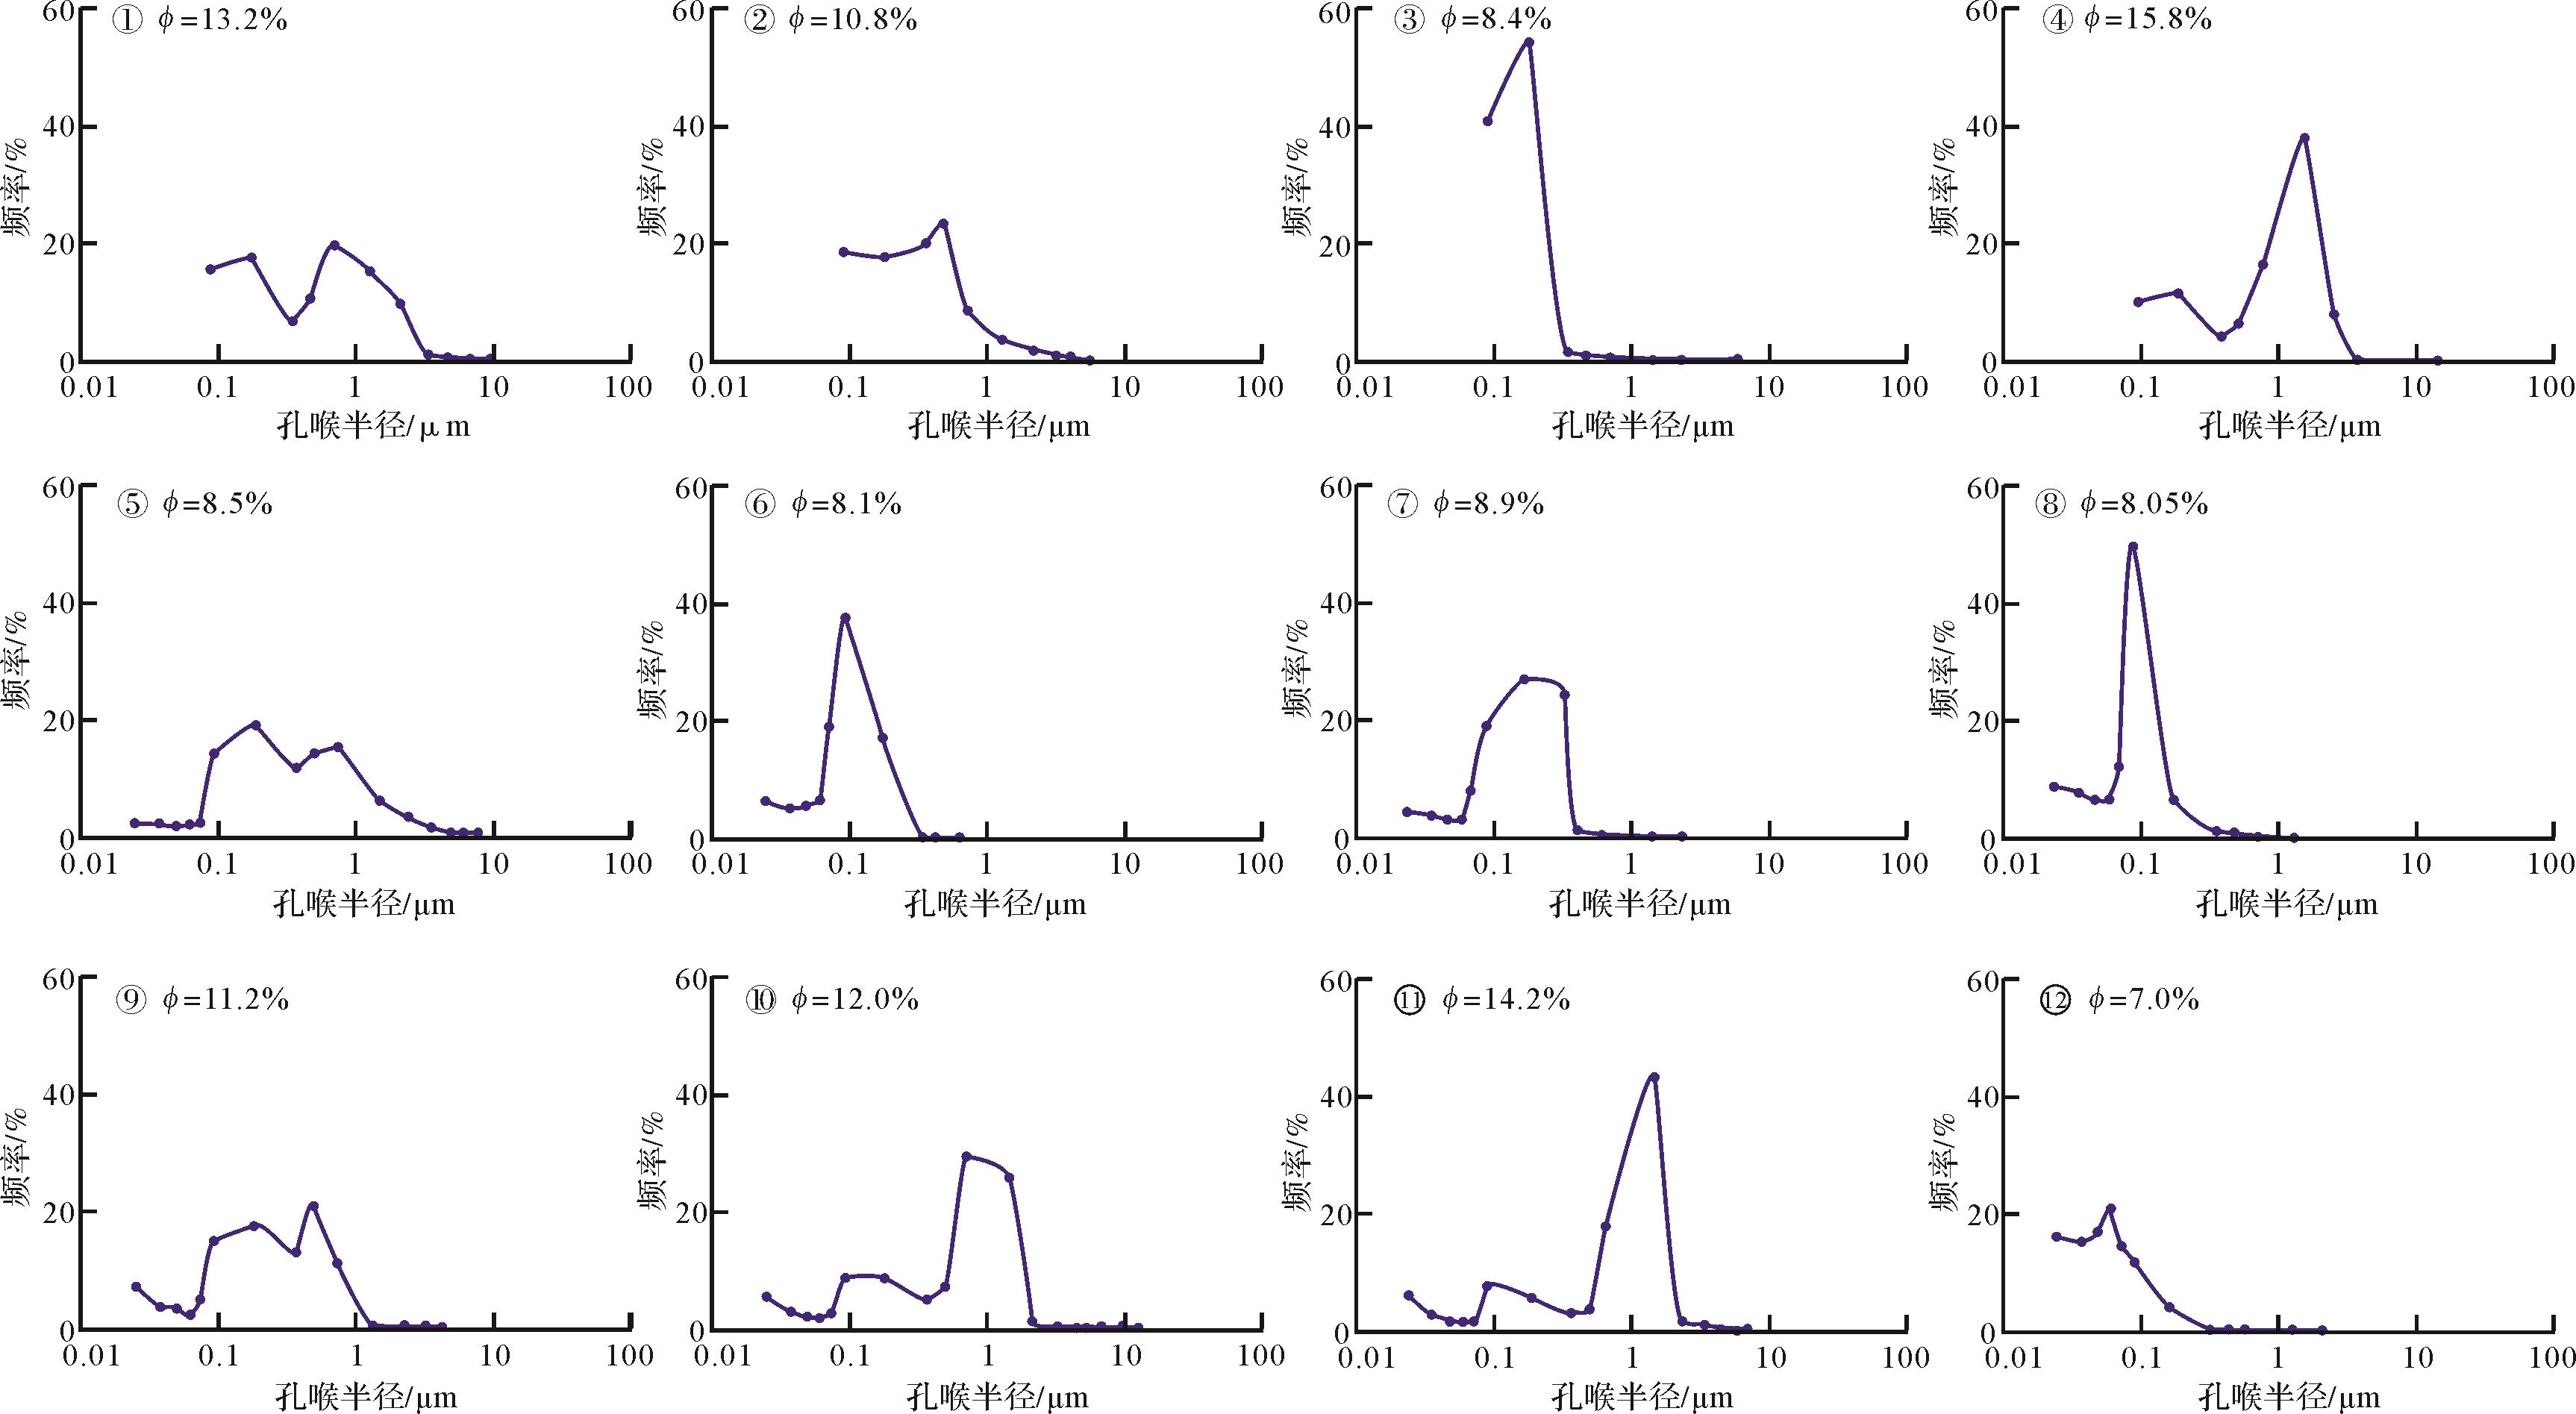
    样品编号孔隙度/%渗透率/×10-3 μm2排驱压力/MPa最大孔喉半径/μm中值压力/MPa中值喉道半径/μm最大进汞饱和度/%
    113.20.750.1923.8281.310.56191.76
    210.80.620.5651.3012.110.34886.29
    38.40.211.5850.4647.760.09550.54
    415.81.820.1315.6110.830.88977.34
    58.50.200.3342.2011.950.37790.47
    68.10.062.8980.25418.870.03953.73
    78.90.221.1720.6277.280.10166.27
    88.00.173.5620.20613.960.05360.10
    911.20.380.8810.8344.590.16075.07
    1012.00.600.2552.8821.390.52779.69
    1114.20.710.2253.2670.970.75980.74
    127.00.030.9690.75921.090.03557.32

    根据压汞曲线可以获得孔喉半径频率分布图(图4),如图所示,孔喉半径多呈单峰分布,主要分布区间为0.1~1 μm,但坝砂与滩砂的孔喉峰值半径(分布频率最高对应的孔喉半径)有一定的区别,其中,坝砂孔喉峰值半径为0.183~1.529 μm,平均值为0.8 μm;滩砂孔喉峰值半径明显小于坝砂,为0.059~0.189 μm,平均值为0.119 μm。随孔喉峰值半径增加,孔隙度相应增大,当孔喉峰值半径小于0.4 μm时,孔隙度均小于10%。

    Figure 4.  Pore throat radius graphs for beach⁃bar sand samples with different porosity

  • 分形通常被定义为“一个粗糙或零碎的几何形状,可以分成数个部分,且每一部分都(或近似)是整体缩小后的形状”,即具有“自相似或标度不变性”[21]。前人的研究表明,致密砂岩的孔隙结构存在分形特征,分形理论可用于表征致密砂岩储集层的结构特征及其非均质性[22-24];多孔岩石的分形维数通常介于2~3[25-27],分形维数越小,储层孔喉分布越均匀,均质性越强[28-29]

    根据前人的研究成果[30],储层孔隙分布表示式为:

    Vr3-D ((1))

    式中:V为孔隙为r的孔隙占有的体积;D为孔径分布分形维数,其值为2~3。

    将式(1)对r求导,得到孔径分布函数(dvdr)的表示式:

    dvdr=r2-D ((2))

    在式(2)中引入比例常数a,可以得到储层岩石中孔隙小于r的累积孔隙体积V(<r)的表示式:

    V<r=rminrar2-Ddr=a'(r3-D-rmin3-D) ((3))

    式中:rmin 为储层岩石中最小孔径,μm;a'=a/(3-D)。

    同理,储层岩石的总孔隙体积V为:

    V=a'(rmax3-D-rmin3-D) ((4))

    式(3)和式(4)带入式(5),可以得到孔径小于r的累积体积分数s的表示式:

    s=V(<r)V=r3-D-rmin3-Drmax3-D-rmin3-D ((5))

    根据油层物理学中对于饱和度的定义,孔径小于r的累积体积分数s即为润湿相饱和度[31],且对于致密储层,孔喉半径的非均质性强,因此,rmin <<rmax,则有下式:

    Sw=(rrmax)3-D ((6))

    式中:Sw为润湿相饱和度,%;rmax 为最大孔喉半径,μm。

    对式6两边取对数可得:

    lgSw=lg(1-SHg)=(3-D)lgr-(3-D)lgrmax ((7))

    式中:SHg为累积进汞饱和度,%。

    根据12块样品的lg(1-SHg)-lgr关系图(图5),可以计算出样品的分形维数。从图中可以看出,12块致密滩坝砂样品的lg(1-SHg)-lgr关系图具有明显两段性,将lg(1-SHg)-lgr关系图中分段点对应的孔喉半径命名为孔喉转折半径,大于孔喉转折半径对应的孔隙为大孔喉,用ϕ1表示,小于孔喉转折半径对应的孔隙为小孔喉,用ϕ2表示。根据各孔隙空间的孔隙度加权平均得到整个孔喉的总分形维数D[27,32],为

    D=D1ϕ1+D2ϕ2ϕ1+ϕ2 ((8))

    Figure 5.  Diagrams of log(1⁃SHg) vs. logr for 12 samples

    根据计算结果,两段分形维数D1D2以及总分形维数D均在2~3范围内(表3),对坝砂和滩砂的分形维数分别统计,坝砂分形维数为2.222 4~2.531 9,平均值为2.441 2,而滩砂分形维数为2.585 0~2.742 4,平均值为2.650 9,明显高于坝砂。

    样品编号ϕ1/%ϕ2/%ϕ/%k/×10-3 μm2D1D2D
    12.6410.5613.20.752.979 52.297 52.433 9
    24.326.4810.80.622.969 42.148 12.476 6
    32.525.888.40.212.997 32.491 42.643 2
    41.5814.2215.81.822.993 32.136 72.222 4
    52.555.958.50.202.986 02.413 02.585 0
    61.626.488.10.062.998 42.678 42.742 4
    70.188.728.90.222.995 52.609 92.617 6
    82.45.68.00.172.989 42.567 72.694 2
    90.5610.6411.20.382.996 42.507 52.531 9
    101.810.212.00.602.992 52.427 62.512 3
    111.4212.7814.20.712.986 92.412 92.470 3
    122.454.557.00.032.995 92.421 82.622 7
  • 分别建立分形维数与储层孔隙度和渗透率的关系。根据样品物性统计数据(表3),总分形维数D与储层孔隙度ϕ和渗透率k之间呈负向关关系(图6),R2 分别为0.819和0.902,相关程度高。说明分形维数可以有效表征储层孔渗性能,即随着分形维数增大,储层的孔隙度与渗透率均变小,储层的孔渗性变差。

    Figure 6.  Plots of (a)fractal dimension D vs. porosity ϕ and (b) D vs. permeability k

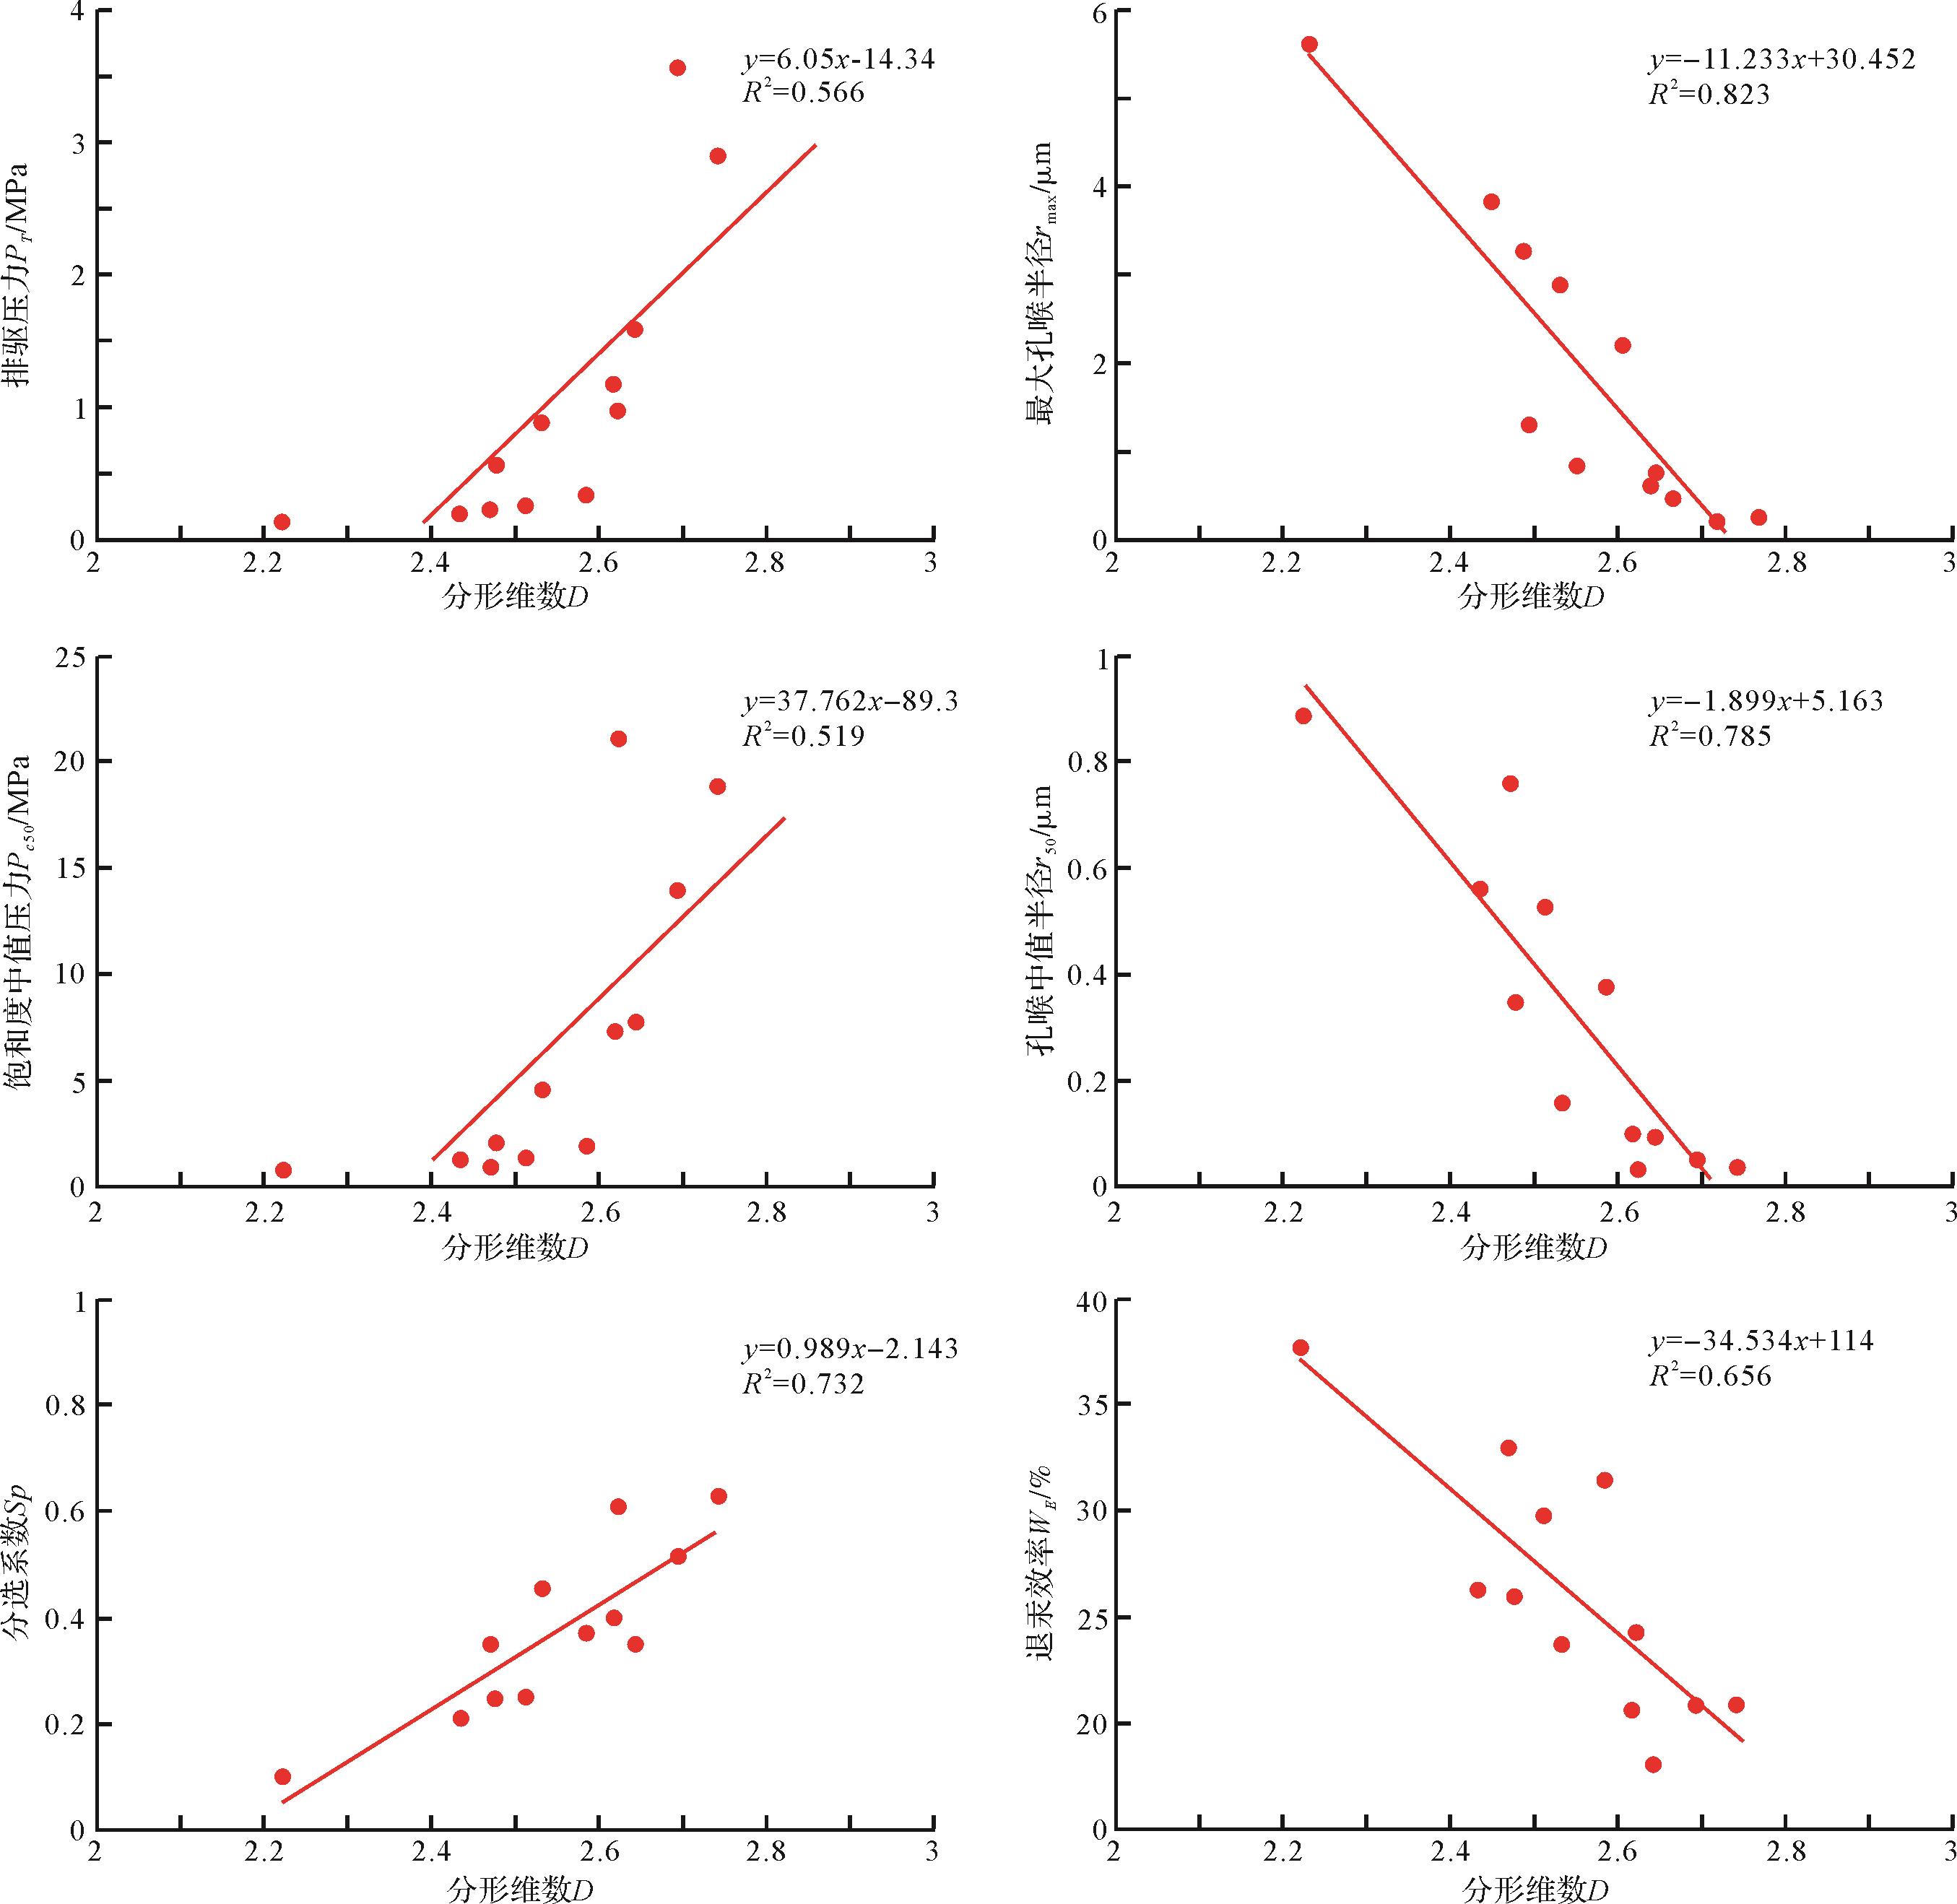
  • 孔隙结构包含孔喉大小、分选性和连通性等信息,排驱压力PT、最大孔喉半径rmax、饱和度中值压力Pc50及孔喉中值半径r50表示孔喉大小,分选系数Sp表示孔喉分选性,退汞效率WE可表示孔喉连通性。根据分形维数与孔隙结构参数数据统计发现(图7),分形维数DPTrmaxPc50r50Pc50SpWE均具有较强相关性,其中,DPTPc50呈正相关关系,与rmaxr50呈负相关关系,R2 分别为0.566、0.519、0.823和0.785,表明随着分形维数升高,孔喉半径有减小的趋势;DSp呈正相关关系,R2 为0.732,表明随着分形维数升高,孔喉的分选性变差;DWE呈负相关关系,R2 为0.656,表明随着分形维数升高,孔喉的连通性变差。因此,分形维数可以作为综合反映储层孔隙结构特征的指标,分形维数越大,储层的储集条件越差。

    Figure 7.  Intersection graphs of fractal dimension D and pore structure parameters

  • 致密滩坝砂储层非均质性强,连续系统的钻井取心和实验分析费用高昂且难以操作,以有限的样品取其平均值代表整套砂体的做法不能反映细小差别,得到的结论很可能误导开发决策。测井信息可以间接地反映地层岩性、物性及其流体等特征,部分测井曲线与孔隙结构具有很强的相关性,因此,可尝试建立一种准确定量的、易于操作的孔隙分形维数测井预测模型,预测孔隙分形维数的单井纵向分布,解决实验资料纵向连续性差的问题,提高预测精度。

  • 通过对致密滩坝砂样品的分形维数与常用测井曲线进行相关性分析(表4),发现微电位与微梯度差值的绝对值(|RLML-RNML|)、声波时差(AC)、自然伽马(GR)和电阻率(RT)相关程度较高,相关系数分别为-0.907、-0.896、0.877和-0.867,随着分形维数D增大,|RLML-RNML|值减小、AC值减小、GR值增大、RT值减小。

    序号测井类型相关系数r序号测井类型相关系数r序号测井类型相关系数r
    1自然电位-0.5972自然伽马0.8773电阻率-0.867
    4中子-0.8025密度0.8536声波时差-0.896
    7|微电位—微梯度|-0.9078井径0.4739感应测井0.692

    (1) 微电位与微梯度差值绝对值(|RLML-RNML|)和声波时差(AC)主要反映物性变化,D值增大,孔隙度和渗透率均呈减小的趋势(图6),导致|RLML-RNML|和AC值减小。

    (2) 自然伽马(GR)主要反映岩石的放射性。D为大值的样品多为滩砂样品,粒度较细,且泥质含量较D为小值的坝砂样品大,导致放射性增强,GR值增大。

    (3) 电阻率(RT)主要反映含油性,随着D升高,孔喉半径减小,分选性变差(图7),油气运移至储层困难加大,导致含油量减小,RT值降低。

  • 建立东营凹陷致密滩坝砂测井预测模型的具体方法为:首先根据滩坝砂沉积相特点,剔除非滩坝砂层段;为了抵消各类测井参数数量级不同带来的影响,将优选出的测井曲线(|RLML-RNML|、AC、GR和RT),进行标准归一化处理,标准归一化公式为:

    X=x-xminxmax-xmin ((9))

    式中:测井样本数据为xxmax =max{x},xmin =min{x},测井样本归一化数据为X;然后,将归一化后的|RLML-RNML|、AC、GR和RT值对D进行回归拟合,得到D的测井预测公式:

    D=2.98-0.15|RLML-RNML|-0.2AC+0.15GR-0.51RT ((10))

    式中:D为分形维数;|RLML-RNML|为微电极曲线差值绝对值,Ω·m;AC为声波时差值,μs/m;GR为自然伽马值,API;RT为电阻率值,Ω·m。

    将通过测井预测模型预测的分形维数与通过压汞数据计算得到的分形维数进行比对(图8),R2 值达0.936,基本满足实际生产和科研的需要。

    Figure 8.  Correlation of fractal dimension D log predicted value and value calculated from mercury intrusion data

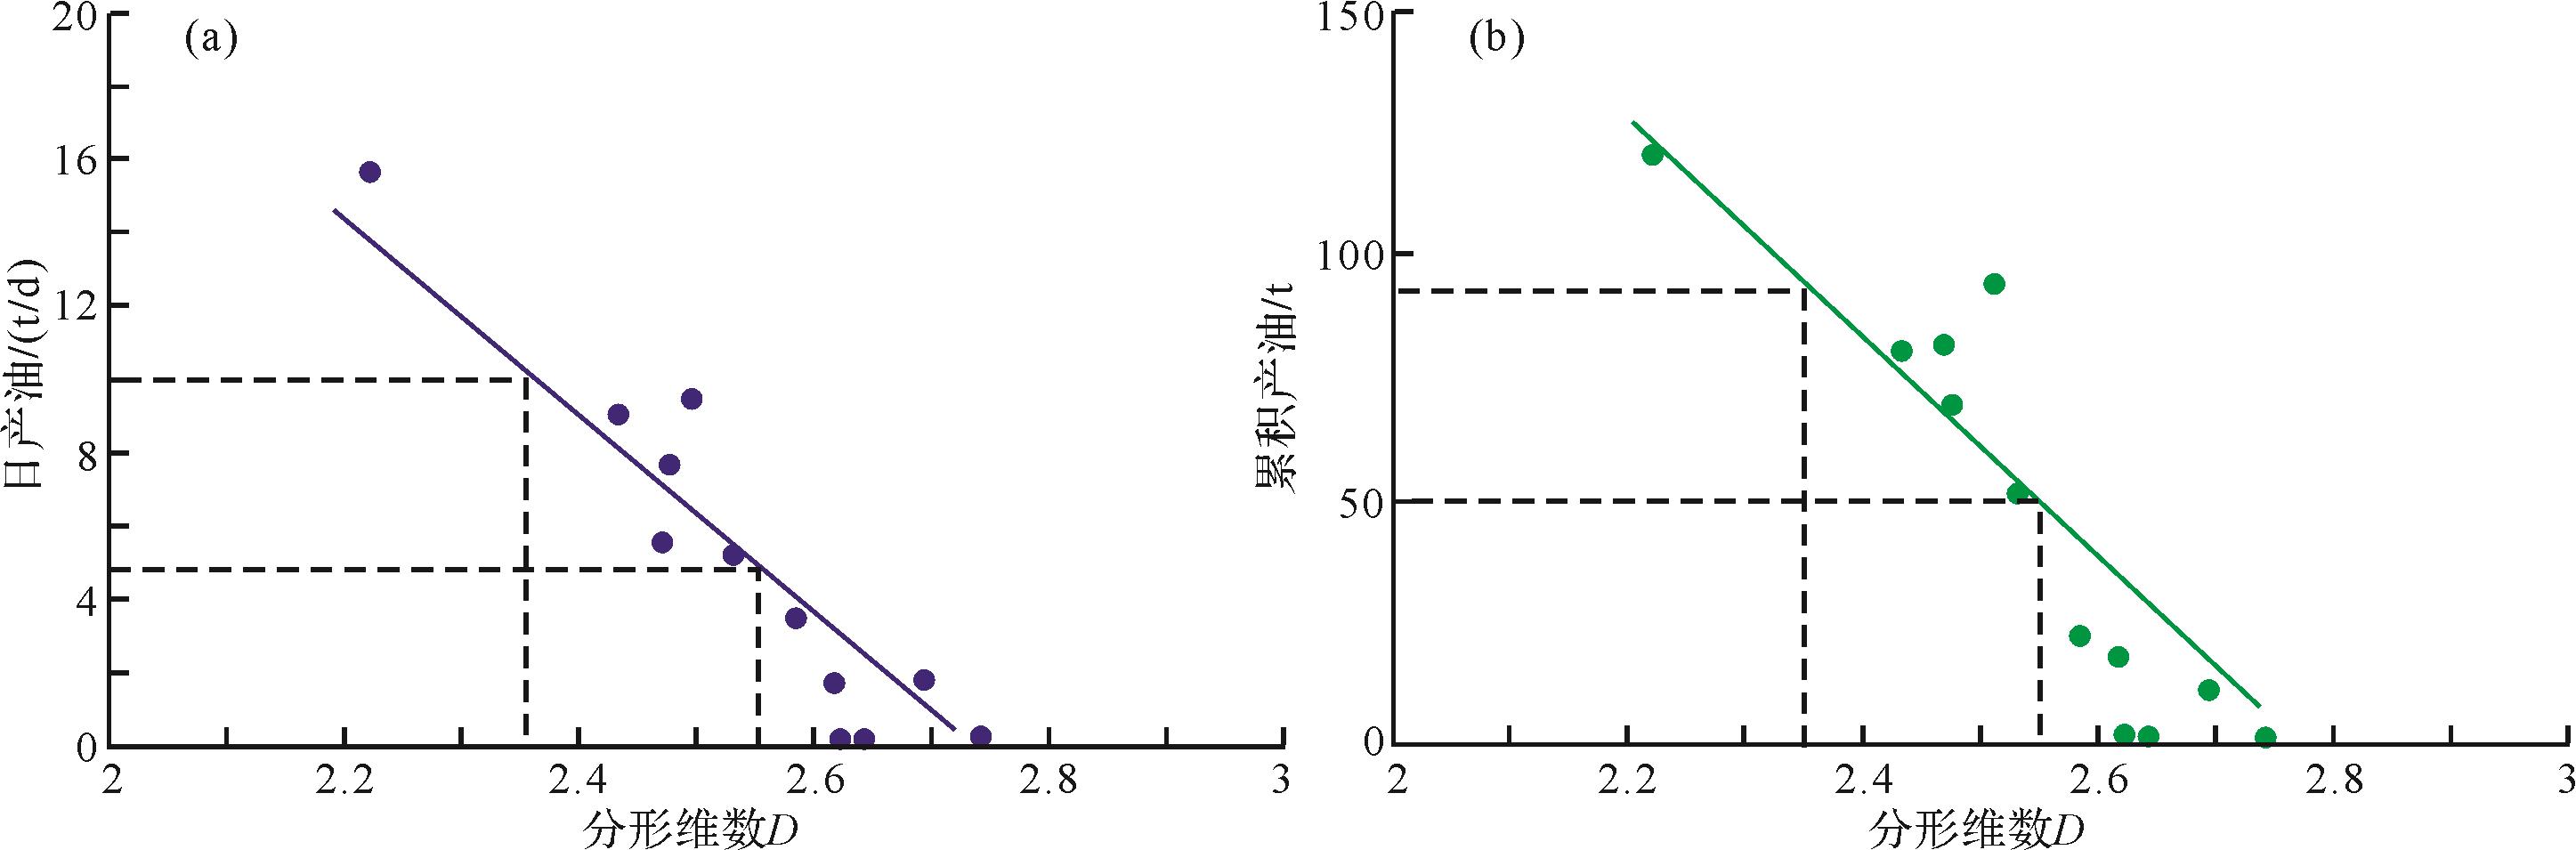
  • 分形维数D可以有效表征储层孔渗性能,综合反映储层孔隙结构特征,因此,推测分形维数D值大小与油井产能具有一定的相关性。为了揭示分形维数D对储层开发效果的影响,本次研究选取已动用区块无压裂措施下的日产油,累积产油与分形维数D之间的关系(图9),建立了基于分形维数D的东营凹陷致密滩坝砂储层评价标准(表5)。

    Figure 9.  Relationship between fractal dimension D and (a) daily oil production and (b) cumulative oil production

    评价参数D开发效果指标物性指标孔隙结构参数指标
    日产油/(t/d)累积产油/t孔隙度/%渗透率/×10-3 μm2PT/MParmax/μmPc50/MPar50/μmSp/μmWE/%
    优质储层2~2.35>10>90>14>0.9<0.18>4.1<1.05>0.7<0.19>33
    一般储层2.35~2.555~1050~9010~140.4~0.90.18~0.372.0~4.11.05~2.30.32~0.70.19~0.3926~33
    差储层2.55~3<5<50<10<0.4>0.37<2.0>2.3<0.32>0.39<26

    根据日产油、累积产油与分形维数D的数据统计结果显示,以日产油量为主要分类指标,当2<D<2.35时,可以认定为相对优质的储层,此时,对应层段的日产油量大于10 t/d,累积产油量大于90 t,孔隙度大于14%,渗透率大于0.9×10⁻³ μm2PT小于0.18 MPa,rmax大于4.1 μm,Pc50小于1.05 MPa,r50大于0.7 μm,Sp小于0.19,WE大于33%;当2.35<D<2.55时,认定为相对一般的储层,日产油量为5~10 t/d,累积产油量为50~90 t,孔隙度为10%~14%,渗透率为0.4×10⁻³ μm2~0.9×10⁻³ μm2PT介于0.18~0.37 MPa,rmax为2.0~4.1 μm,Pc50为1.05~2.3 MPa,r50为0.32~0.7 μm,Sp为0.19~0.39,WE为26%~33%;当2.55<D<3时,认定为相对较差的储层,日产油量小于5 t,累积产油小于50 t,孔隙度小于10%,渗透率小于0.4×10⁻³ μm2PT大于0.37 MPa,rmax小于2.0 μm,Pc50大于2.3 MPa,r50小于0.32 μm,Sp大于0.39,WE小于26%。

  • 本次研究以东营凹陷西部区块沙四上纯下次亚段的致密滩坝砂分布区域为例,利用分形维数D测井预测结果对致密滩坝砂体进行了储层评价。根据分形维数D平面分布等值线图(图10),结合东营凹陷致密滩坝砂储层综合评价标准(表5),优质储层的分形维数D为2~2.35,孔隙度大于14%,主要集中在两个区域,分别为B424井区和C107-C66-B3井区,全部分布于坝砂,该区域单井日产能高,日产油量10 t以上,为最有利的开发区域;一般储层的分形维数D为2.35~2.55,孔隙度为10%~14%,主要集中在四个区域,分别为B424井区、F119井区、C108-L108-C44井区和F145-F144-F134井区,主要为坝砂,少量为滩砂,该区域的单井日产油量为5~10 t,为较好的开发区域。利用分形维数D对致密滩坝砂储层进行综合评价,为下一步有利开发区域的选取及动用次序的确定提供了理论依据。

    Figure 10.  Plane distribution of fractal dimension D and reservoir classification in western block, Dongying Sag

    表5所列的储层评价标准适用于东营凹陷滩坝砂型致密储层,现场应用效果显著。本文所述基于分形维数的储层评价方法也在东营凹陷的砂砾岩和浊积岩型致密储层中进行了推广和应用,但是储层的优劣对应的分形维数范围与滩坝砂有一定的差异。因此,基于分形维数的储层评价方法可以应用于致密储层评价,但是标准的制定还需要根据致密储层的实际地质特点作相应的调整。

  • (1) 东营凹陷沙四上纯下次亚段分布典型的致密滩坝砂体沉积,利用压汞曲线数据计算孔隙分形维数,分析其与表征储层孔渗性能与孔隙结构参数的相关性,发现分形维数与总孔隙度ϕ、渗透率k、最大孔喉半径rmax、中值喉道半径r50、退汞效率WE呈负相关关系,与排驱压力PT、中值压力Pc50、分选系数Sp呈正相关关系,表明随着分形维数增大,储层孔渗性能、孔喉半径、分选性及连通性均变差。

    (2) 优选微电位与微梯度差值的绝对值(|RLML-RNML|)、声波时差(AC)、自然伽马(GR)和电阻率(RT)测井曲线参数,标准归一化拟合建立分形维数测井预测模型,将通过测井预测模型预测的分形维数与通过压汞数据计算得到的分形维数进行比对,R2值达0.936,基本满足实际生产和科研的需要。

    (3) 选取已动用区块无压裂措施下的日产油,累积产油与分形维数D之间的关系,建立基于分形维数D的东营凹陷致密滩坝砂储层评价标准,当2<D<2.35时为优质储层,当2.35<D<2.55时为一般储层,当2.55<D<3时为差储层。根据测井预测模型预测东营凹陷西部区块沙四上纯下次亚段的致密滩坝砂有利储层,认为优质储层主要集中在B424井区和C107-C66-B3井区,为下一步储层动用次序的确定提供了理论依据。

Reference (32)

Catalog

    /

    DownLoad:  Full-Size Img  PowerPoint
    Return
    Return