Advanced Search
Volume 40 Issue 3
Jun.  2022
Turn off MathJax
Article Contents

CHEN Qu, LIU XiuMing, LÜ Bin, YE Wei, ZHAO GuoYong. Paleoclimatic Changes Since 300 ka Recorded by Loess Deposits Along the North Pediment of Tianshan Mountains[J]. Acta Sedimentologica Sinica, 2022, 40(3): 679-690. doi: 10.14027/j.issn.1000-0550.2021.064
Citation: CHEN Qu, LIU XiuMing, LÜ Bin, YE Wei, ZHAO GuoYong. Paleoclimatic Changes Since 300 ka Recorded by Loess Deposits Along the North Pediment of Tianshan Mountains[J]. Acta Sedimentologica Sinica, 2022, 40(3): 679-690. doi: 10.14027/j.issn.1000-0550.2021.064

Paleoclimatic Changes Since 300 ka Recorded by Loess Deposits Along the North Pediment of Tianshan Mountains

doi: 10.14027/j.issn.1000-0550.2021.064
Funds:

National Natural Science Foundation of China 41402155, 41772180, 41877435

  • Received Date: 2021-02-28
  • Rev Recd Date: 2021-05-26
  • Publish Date: 2022-06-10
  • Considerable progress has been made in studies of the distribution, age and paleoclimatic significance of loess deposits in arid central Asia. However, the focus has been on long-term drying trends (since 800 ka) or short-term moisture evolution (since the last interglacial or during the Holocene). The paleosols are generally undeveloped in the pediment of the Tianshan Mountains, which makes detailed paleoclimate reconstruction difficult. Based on previous work, a number of methods were used in the present study to investigate loess deposit samples from different sections along the north pediment of the Tianshan Mountains. These include a typical loess section at Lujiaowan at relatively high elevation, and sections in low-lying areas along the southern margin of the deserts. The Lujiaowan section consists of four paleosols and intercalated loess dating back to 300 ka. According to the stratigraphic divisions on the Chinese loess plateau, the four down-section paleosols were designated S0, S1, S2 (subdivided into S2S1, S2L1 and S2S2), and S3. The sections possess similar variations in color, grain size, geochemistry and rock magnetism with depth, consistent with loess/paleosol alternation. They also indicate a significant change in paleoclimatic proxies at the S2/L2 boundary. The grain size distribution of loess is unimodal, but is bimodal for the paleosols (or broadly unimodal), suggesting that the loess origins are related to two winds, the westerlies and near-surface winds. The variation in the dominance of the winds is consistent with the loess/paleosol alternation. Also, grain sizes are finer in the lower part of the section (S2, L3 and S3) than in the upper part. The chemical index of alteration (CIA) and (CaO+Na2O+MgO)/TiO2 ratio indicate more intensive weathering in the paleosols than in adjacent loess units. Integrated rock magnetic analysis indicates that the loess–paleosol sequence experienced three stages in the relation between pedogenetic intensity and magnetic susceptibility in response to different paleoclimates. The lower paleosols (S3 and S2) show higher pedogenetic intensity but lower magnetic susceptibility, reflecting humid paleoclimates. The upper loess–paleosol sequence exhibits the dominance of wind strength (for L2⁃L1) or pedogenesis (for S0) in magnetic enhancement. Compared to the underlying or overlying loess, the paleosols have fine magnetic grain size. It is suggested that the SIRM/χ and χARM/SIRM ratios are sensitive to climate change. A study of the relationship between SIRM and χ of the loess from the Lujiaowan, Jingouhe, Dongwan and Midong sections indicated that the origins of magnetic variations along the northern piedmont of the Tianshan Mountains are section-specific, and differ between layers. However, a common drying trend following loess deposition was observed. Various proxies implied that S2S2 was more highly developed than S3. Likewise, S2b, one of the sub-units of the S2 paleosols, shows lower χ than S3 in the Dongwan town loess section. The time span in which S2S2 or S2b developed was possibly wetter than the interglacial period during which S3 developed. This is consistent with studies of the loess from Kunlun Mountains. For the paleoclimate evolution over the last interglacial/glacial period, the grain size parameters of the Dongwan loess demonstrate a drying trend, which is in line with the χARM/χ and SIRM/χ ratios of the Midong loess.This study provides further evidence for the contribution of the different winds to the loess deposits along the northern piedmont of the Tianshan Mountains. Paleoclimate evolution was affected by both westerly and near-surface winds. The westerlies dominated the moisture variation, and the near-surface winds were responsible to a greater extent for the origin of the loess deposits. The different magnetic mechanisms resulting from varying geographic exposure to paleoclimatic changes were revealed. The local pedogenetic signals revealed by rock magnetism are the result of changes in moisture conditions. Both the high-elevation Lujiaowan loess and the low-lying Dongwan loess show that the S2 paleosols experienced more humid conditions than the S3 paleosols. L2 loess was deposited during much drier periods; S1 is less developed than both S2 and S3 due to the presence of inadequate moisture. The aridity further intensified from the last glacial to the onset of the Holocene. The drying trend and major drying events are attributable to the uplift of the Tibet plateau.
  • [1] 刘东生. 黄土与环境[M]. 北京:科学出版社,1985:1-251.

    Liu Tungsheng. Loess and the environment[M]. Beijing: Science Press, 1985: 1-251.
    [2] 叶玮. 新疆西风区黄土沉积特征与古气候[M]. 北京:海洋出版社,2001.

    Ye Wei. The loess deposition features and paleoclimate in westerly region of Xinjiang[M]. Beijing: China Ocean Press, 2001.
    [3] Fang X M, Shi Z T, Yang S L, et al. Loess in the Tian Shan and its implications for the development of the Gurbantunggut desert and drying of northern Xinjiang[J]. Chinese Science Bulletin, 2002, 47(16): 1381-1387.
    [4] 叶玮,桑长青,赵兴有. 新疆黄土分布规律及粉尘来源[J]. 中国沙漠,2003,23(5):514-520.

    Ye Wei, Sang Changqing, Zhao Xingyou. Spatial-Temporal distribution of loess and source of dust in Xinjiang[J]. Journal of Desert Research, 2003, 23(5): 514-520.
    [5] Yang S L, Ding F, Ding Z L. Pleistocene chemical weathering history of Asian arid and semi-arid regions recorded in loess deposits of China and Tajikistan[J]. Geochimica et Cosmochimica Acta, 2006, 70(7): 1695-1709.
    [6] Yang H, Li G Q, Huang X, et al. Loess depositional dynamics and paleoclimatic changes in the Yili Basin over the past 250 ka[J]. CATENA, 2020, 195: 104881.
    [7] Song Y G, Li Y, Cheng L Q, et al. Spatio-temporal distribution of Quaternary loess across Central Asia[J]. Palaeogeography, Palaeoclimatology, Palaeoecology, 2021, 567: 110279.
    [8] 文启忠,郑洪汉. 北疆地区晚更新世以来的气候环境变迁[J]. 科学通报,1988,33(10):771-774.

    Wen Qizhong, Zheng Honghan. Climo-environment changes in North Xinjiang since Late Pleistocene[J]. Science Bulletin, 1988, 33(10): 771-774.
    [9] 吕红华,李有利,南峰,等. 天山北麓黄土发育特征及形成年代[J]. 地理科学,2008,28(3):375-379.

    Honghua Lü, Li Youli, Feng Nan, et al. Character and age of loess along north piedmont of Tianshan Mountains[J]. Scientia Geographica Sinica, 2008, 28(3): 375-379.
    [10] Li G Q, Wen L J, Xia D S, et al. Quartz OSL and K-feldspar pIRIR dating of a loess/paleosol sequence from arid central Asia, Tianshan Mountains, NW China[J]. Quaternary Geochronology, 2015, 28: 40-53.
    [11] Chen F H, Jia J, Chen J H, et al. A persistent Holocene wetting trend in arid central Asia, with wettest conditions in the Late Holocene, revealed by multi-proxy analyses of loess-paleosol sequences in Xinjiang, China[J]. Quaternary Science Reviews, 2016, 146: 134-146.
    [12] Jia J, Liu H, Gao F Y, et al. Variations in the westerlies in Central Asia since 16 ka recorded by a loess section from the Tien Shan Mountains[J]. Palaeogeography, Palaeoclimatology, Palaeoecology, 2018, 504: 156-161.
    [13] 史正涛,方小敏,宋友桂,等. 天山北坡黄土记录的中更新世以来干旱化过程[J]. 海洋地质与第四纪地质,2006,26(3):109-114.

    Shi Zhengtao, Fang Xiaomin, Song Yougui, et al. Loess sediments in the north slope of Tianshan Mountains and its indication of desertification since Middle Pleistocene[J]. Marine Geology & Quaternary Geology, 2006, 26(3): 109-114.
    [14] 史正涛. 天山黄土与西北内陆干旱化[D]. 兰州:兰州大学,2002.

    Shi Zhengtao. Loess in Tianshan Mountains and its implication of drying and desertification in Xinjiang, northwest China[D]. Lanzhou: Lanzhou University, 2002.
    [15] 文启忠,乔玉楼. 新疆地区13000年来的气候序列初探[J]. 第四纪研究,1990(4):363-371.

    Wen Qizhong, Qiao Yulou. Preliminary probe of climatic sequence in the last 13000 years in Xinjiang region[J]. Quaternary Sciences, 1990(4): 363-371.
    [16] Wen Q Z, Zheng H H. Paleoclimatic records in the loess sections of North Xinjiang, China[M]//Liu T S. Aspects of loess research. Beijing: China Ocean Press, 1987: 58-69.
    [17] Sun J M. Source regions and Formation of the Loess sediments on the high mountain regions of northwestern China[J]. Quaternary Research, 2002, 58(3): 341-351.
    [18] 吕镔. 北疆黄土环境磁学研究[D]. 兰州:兰州大学,2012.

    Bin Lü. The environmental magnetism study of loess in north Xinjiang[D]. Lanzhou: Lanzhou University, 2012.
    [19] Folk R L, Ward W C. Brazos river bar: A study in the significance of grain size parameter[J]. Journal of Sedimentary Research, 1957, 27(1): 3-26.
    [20] 李越,宋友桂,王千锁. 新疆昭苏黄土剖面色度变化特征及古气候意义[J]. 地球环境学报,2014,5(2):67-75.

    Li Yue, Song Yougui, Wang Qiansuo. Chroma characteristics in the Zhaosu loess section and its paleoclimatic significance[J]. Journal of Earth Environment, 2014, 5(2): 67-75.
    [21] 何柳,孙有斌,安芷生. 中国黄土颜色变化的控制因素和古气候意义[J]. 地球化学,2010,39(5):447-455.

    He Liu, Sun Youbin, An Zhisheng. Changing color of Chinese loess: Controlling factors and paleocliamtic significances[J]. Geochimica, 2010, 39(5): 447-455.
    [22] Lu H Y, An Z S. Paleoclimatic significance of grain size of loess-palaeosol deposit in Chinese Loess Plateau[J]. Science in China (Seri. D): Earth Sciences, 1998, 41(6): 626-631.
    [23] Vandenberghe J. Grain size of fine-grained windblown sediment: A powerful proxy for process identification[J]. Earth-Science Reviews, 2013, 121: 18-30.
    [24] Vandenberghe J, Mücher H J, Roebroeks W, et al. Lithostratigraphy and palaeoenvironment of the Pleistocene deposits at Maastricht-Belvédère, southern Limburg, the Netherlands[J]. Mededelingen Rijks Geologische Dienst, 1985, 39(1): 7-18.
    [25] 刘现彬. 天山北麓典型黄土磁学与地球化学特征研究[D]. 兰州:兰州大学,2012.

    Liu Xianbin. Magnetic and geochemistry characteristics of loess deposits at northern foot of Tianshan Mountains[D]. Lanzhou: Lanzhou University, 2012.
    [26] McLennan S M. Weathering and global denudation [J]. The Journal of Geology, 1993, 101(2): 295-303.
    [27] 马兴悦,吕镔,赵国永,等. 川西高原理县黄土磁学特征及其影响因素[J]. 第四纪研究,2019,39(5):1307-1319.

    Ma Xingyue, Bin Lü, Zhao Guoyong, et al. Magnetic properties and their influence factors of Lixian loess in western Sichuan Plateau[J]. Quaternary Sciences, 2019, 39(5): 1307-1319.
    [28] 吕镔,刘秀铭,赵国永,等. 新疆博乐黄土岩石磁学特征及环境意义[J]. 兰州大学学报(自然科学版),2012,48(5):1-8.

    Bin Lü, Liu Xiuming, Zhao Guoyong, et al. Rock magnetic properties of Bole loess in Xinjiang and its environmental significance[J]. Journal of Lanzhou University (Natural Sciences), 2012, 48(5): 1-8.
    [29] 吕镔,刘秀铭,陈秀玲. 天山北麓宁家河阶地上的黄土堆积及其磁学特征[J]. 地球环境学报,2014,5(2):111-119.

    Bin Lü, Liu Xiuming, Chen Xiuling. Loess deposit on the terrace of Ningjia River in the northern slope of the Tianshan Mountains and its magnetic characteristics[J]. Journal of Earth Environment, 2014, 5(2): 111-119.
    [30] Zan J B, Fang X M, Nie J S, et al. Rock magnetism in loess from the Middle Tian Shan: Implications for paleoenvironmental interpretations of magnetic properties of loess deposits in Central Asia[J]. Geochemistry, Geophysics, Geosystems, 2012, 13(10): Q10Z50.
    [31] Lu H H, Xu Y D, Niu Y, et al. Late Quaternary loess deposition in the southern Chaiwopu Basin of the northern Chinese Tian Shan foreland and its palaeoclimatic implications[J]. Boreas, 2016, 45(2): 304-321.
    [32] Liu Q S, Deng C L, Torrent J, et al. Review of recent developments in mineral magnetism of the Chinese loess[J]. Quaternary Science Reviews, 2007, 26(3/4): 368-385.
    [33] Jiang Z X, Liu Q S, Roberts A P, et al. A new model for transformation of ferrihydrite to hematite in soils and sediments[J]. Geology, 2018, 46(11): 987-990.
    [34] Liu X M, Liu T S, Paul H, et al. Two pedogenic models for paleoclimatic records of magnetic susceptibility from Chinese and Siberian loess[J]. Science in China Series D: Earth Sciences, 2008, 51(2): 284-293.
    [35] Chen Q, Liu X M, Heller F, et al. Susceptibility variations of multiple origins of loess from the Ily Basin (NW China)[J]. Chinese Science Bulletin, 2012, 57(15): 1844-1855.
    [36] Thompson R, Oldfield F. Environmental magnetism[M]. London: Allen & Unwin, 1986.
    [37] Evans M E, Heller F. Environmental magnetism: Principles and applications of enviromagnetics[M]. San Diego: Academic Press, 2003.
    [38] Banerjee S K, Hunt C P, Liu X M. Separation of local signals from the regional paleomonsoon record of the Chinese loess plateau: A rock-magnetic approach[J]. Geophysical Research Letters, 1993, 20(9): 843-846.
    [39] Liu X M, Rolph T, Bloemendal J, et al. Quantitative estimates of palaeoprecipitation at Xifeng, in the Loess Plateau of China[J]. Palaeogeography, Palaeoclimatology, Palaeoecology, 1995, 113(2/3/4): 243-248.
    [40] Jackson M J, Moskowitz B. On the distribution of Verwey transition temperatures in natural magnetites[J]. Geophysical Journal International, 2021, 224(2): 1314–1325.
    [41] Liu Q S, Torrent J, Maher B A, et al. Quantifying grain size distribution of pedogenic magnetic particles in Chinese loess and its significance for pedogenesis[J]. Journal of Geophysical Research: Solid Earth, 2005, 110(B11): B11102.
    [42] 邓成龙,刘青松,潘永信,等. 中国黄土环境磁学[J]. 第四纪研究,2007,27(2):193-209.

    Deng Chenglong, Liu Qingsong, Pan Yongxin, et al. Environmental magnetism of Chinese loess-paleosol sequences[J]. Quaternary Sciences, 2007, 27(2): 193-209.
    [43] Deng C L, Shaw J, Liu Q S, et al. Mineral magnetic variation of the Jingbian loess/paleosol sequence in the northern Loess Plateau of China: Implications for Quaternary development of Asian aridification and cooling[J]. Earth and Planetary Science Letters, 2006, 241(1/2): 248-259.
    [44] Li G Q, Rao Z G, Duan Y W, et al. Paleoenvironmental changes recorded in a luminescence dated loess/paleosol sequence from the Tianshan Mountains, arid central Asia, since the Penultimate Glaciation[J]. Earth and Planetary Science Letters, 2016, 448: 1-12.
    [45] 昝金波. 西昆仑山黄土与亚洲内陆干旱化[D]. 兰州:兰州大学,2010.

    Zan Jinbo. Loess on west Kunlun Mountains and aridification of Asian inland[D]. Lanzhou: Lanzhou University, 2010.
    [46] Li G Q, Yang H, Stevens T, et al. Differential ice volume and orbital modulation of Quaternary moisture patterns between Central and East Asia[J]. Earth and Planetary Science Letters, 2020, 530: 115901.
  • 加载中
通讯作者: 陈斌, bchen63@163.com
  • 1. 

    沈阳化工大学材料科学与工程学院 沈阳 110142

  1. 本站搜索
  2. 百度学术搜索
  3. 万方数据库搜索
  4. CNKI搜索

Figures(10)

Article Metrics

Article views(400) PDF downloads(148) Cited by()

Proportional views
Related
Publishing history
  • Received:  2021-02-28
  • Revised:  2021-05-26
  • Published:  2022-06-10

Paleoclimatic Changes Since 300 ka Recorded by Loess Deposits Along the North Pediment of Tianshan Mountains

doi: 10.14027/j.issn.1000-0550.2021.064
Funds:

National Natural Science Foundation of China 41402155, 41772180, 41877435

Abstract: Considerable progress has been made in studies of the distribution, age and paleoclimatic significance of loess deposits in arid central Asia. However, the focus has been on long-term drying trends (since 800 ka) or short-term moisture evolution (since the last interglacial or during the Holocene). The paleosols are generally undeveloped in the pediment of the Tianshan Mountains, which makes detailed paleoclimate reconstruction difficult. Based on previous work, a number of methods were used in the present study to investigate loess deposit samples from different sections along the north pediment of the Tianshan Mountains. These include a typical loess section at Lujiaowan at relatively high elevation, and sections in low-lying areas along the southern margin of the deserts. The Lujiaowan section consists of four paleosols and intercalated loess dating back to 300 ka. According to the stratigraphic divisions on the Chinese loess plateau, the four down-section paleosols were designated S0, S1, S2 (subdivided into S2S1, S2L1 and S2S2), and S3. The sections possess similar variations in color, grain size, geochemistry and rock magnetism with depth, consistent with loess/paleosol alternation. They also indicate a significant change in paleoclimatic proxies at the S2/L2 boundary. The grain size distribution of loess is unimodal, but is bimodal for the paleosols (or broadly unimodal), suggesting that the loess origins are related to two winds, the westerlies and near-surface winds. The variation in the dominance of the winds is consistent with the loess/paleosol alternation. Also, grain sizes are finer in the lower part of the section (S2, L3 and S3) than in the upper part. The chemical index of alteration (CIA) and (CaO+Na2O+MgO)/TiO2 ratio indicate more intensive weathering in the paleosols than in adjacent loess units. Integrated rock magnetic analysis indicates that the loess–paleosol sequence experienced three stages in the relation between pedogenetic intensity and magnetic susceptibility in response to different paleoclimates. The lower paleosols (S3 and S2) show higher pedogenetic intensity but lower magnetic susceptibility, reflecting humid paleoclimates. The upper loess–paleosol sequence exhibits the dominance of wind strength (for L2⁃L1) or pedogenesis (for S0) in magnetic enhancement. Compared to the underlying or overlying loess, the paleosols have fine magnetic grain size. It is suggested that the SIRM/χ and χARM/SIRM ratios are sensitive to climate change. A study of the relationship between SIRM and χ of the loess from the Lujiaowan, Jingouhe, Dongwan and Midong sections indicated that the origins of magnetic variations along the northern piedmont of the Tianshan Mountains are section-specific, and differ between layers. However, a common drying trend following loess deposition was observed. Various proxies implied that S2S2 was more highly developed than S3. Likewise, S2b, one of the sub-units of the S2 paleosols, shows lower χ than S3 in the Dongwan town loess section. The time span in which S2S2 or S2b developed was possibly wetter than the interglacial period during which S3 developed. This is consistent with studies of the loess from Kunlun Mountains. For the paleoclimate evolution over the last interglacial/glacial period, the grain size parameters of the Dongwan loess demonstrate a drying trend, which is in line with the χARM/χ and SIRM/χ ratios of the Midong loess.This study provides further evidence for the contribution of the different winds to the loess deposits along the northern piedmont of the Tianshan Mountains. Paleoclimate evolution was affected by both westerly and near-surface winds. The westerlies dominated the moisture variation, and the near-surface winds were responsible to a greater extent for the origin of the loess deposits. The different magnetic mechanisms resulting from varying geographic exposure to paleoclimatic changes were revealed. The local pedogenetic signals revealed by rock magnetism are the result of changes in moisture conditions. Both the high-elevation Lujiaowan loess and the low-lying Dongwan loess show that the S2 paleosols experienced more humid conditions than the S3 paleosols. L2 loess was deposited during much drier periods; S1 is less developed than both S2 and S3 due to the presence of inadequate moisture. The aridity further intensified from the last glacial to the onset of the Holocene. The drying trend and major drying events are attributable to the uplift of the Tibet plateau.

CHEN Qu, LIU XiuMing, LÜ Bin, YE Wei, ZHAO GuoYong. Paleoclimatic Changes Since 300 ka Recorded by Loess Deposits Along the North Pediment of Tianshan Mountains[J]. Acta Sedimentologica Sinica, 2022, 40(3): 679-690. doi: 10.14027/j.issn.1000-0550.2021.064
Citation: CHEN Qu, LIU XiuMing, LÜ Bin, YE Wei, ZHAO GuoYong. Paleoclimatic Changes Since 300 ka Recorded by Loess Deposits Along the North Pediment of Tianshan Mountains[J]. Acta Sedimentologica Sinica, 2022, 40(3): 679-690. doi: 10.14027/j.issn.1000-0550.2021.064
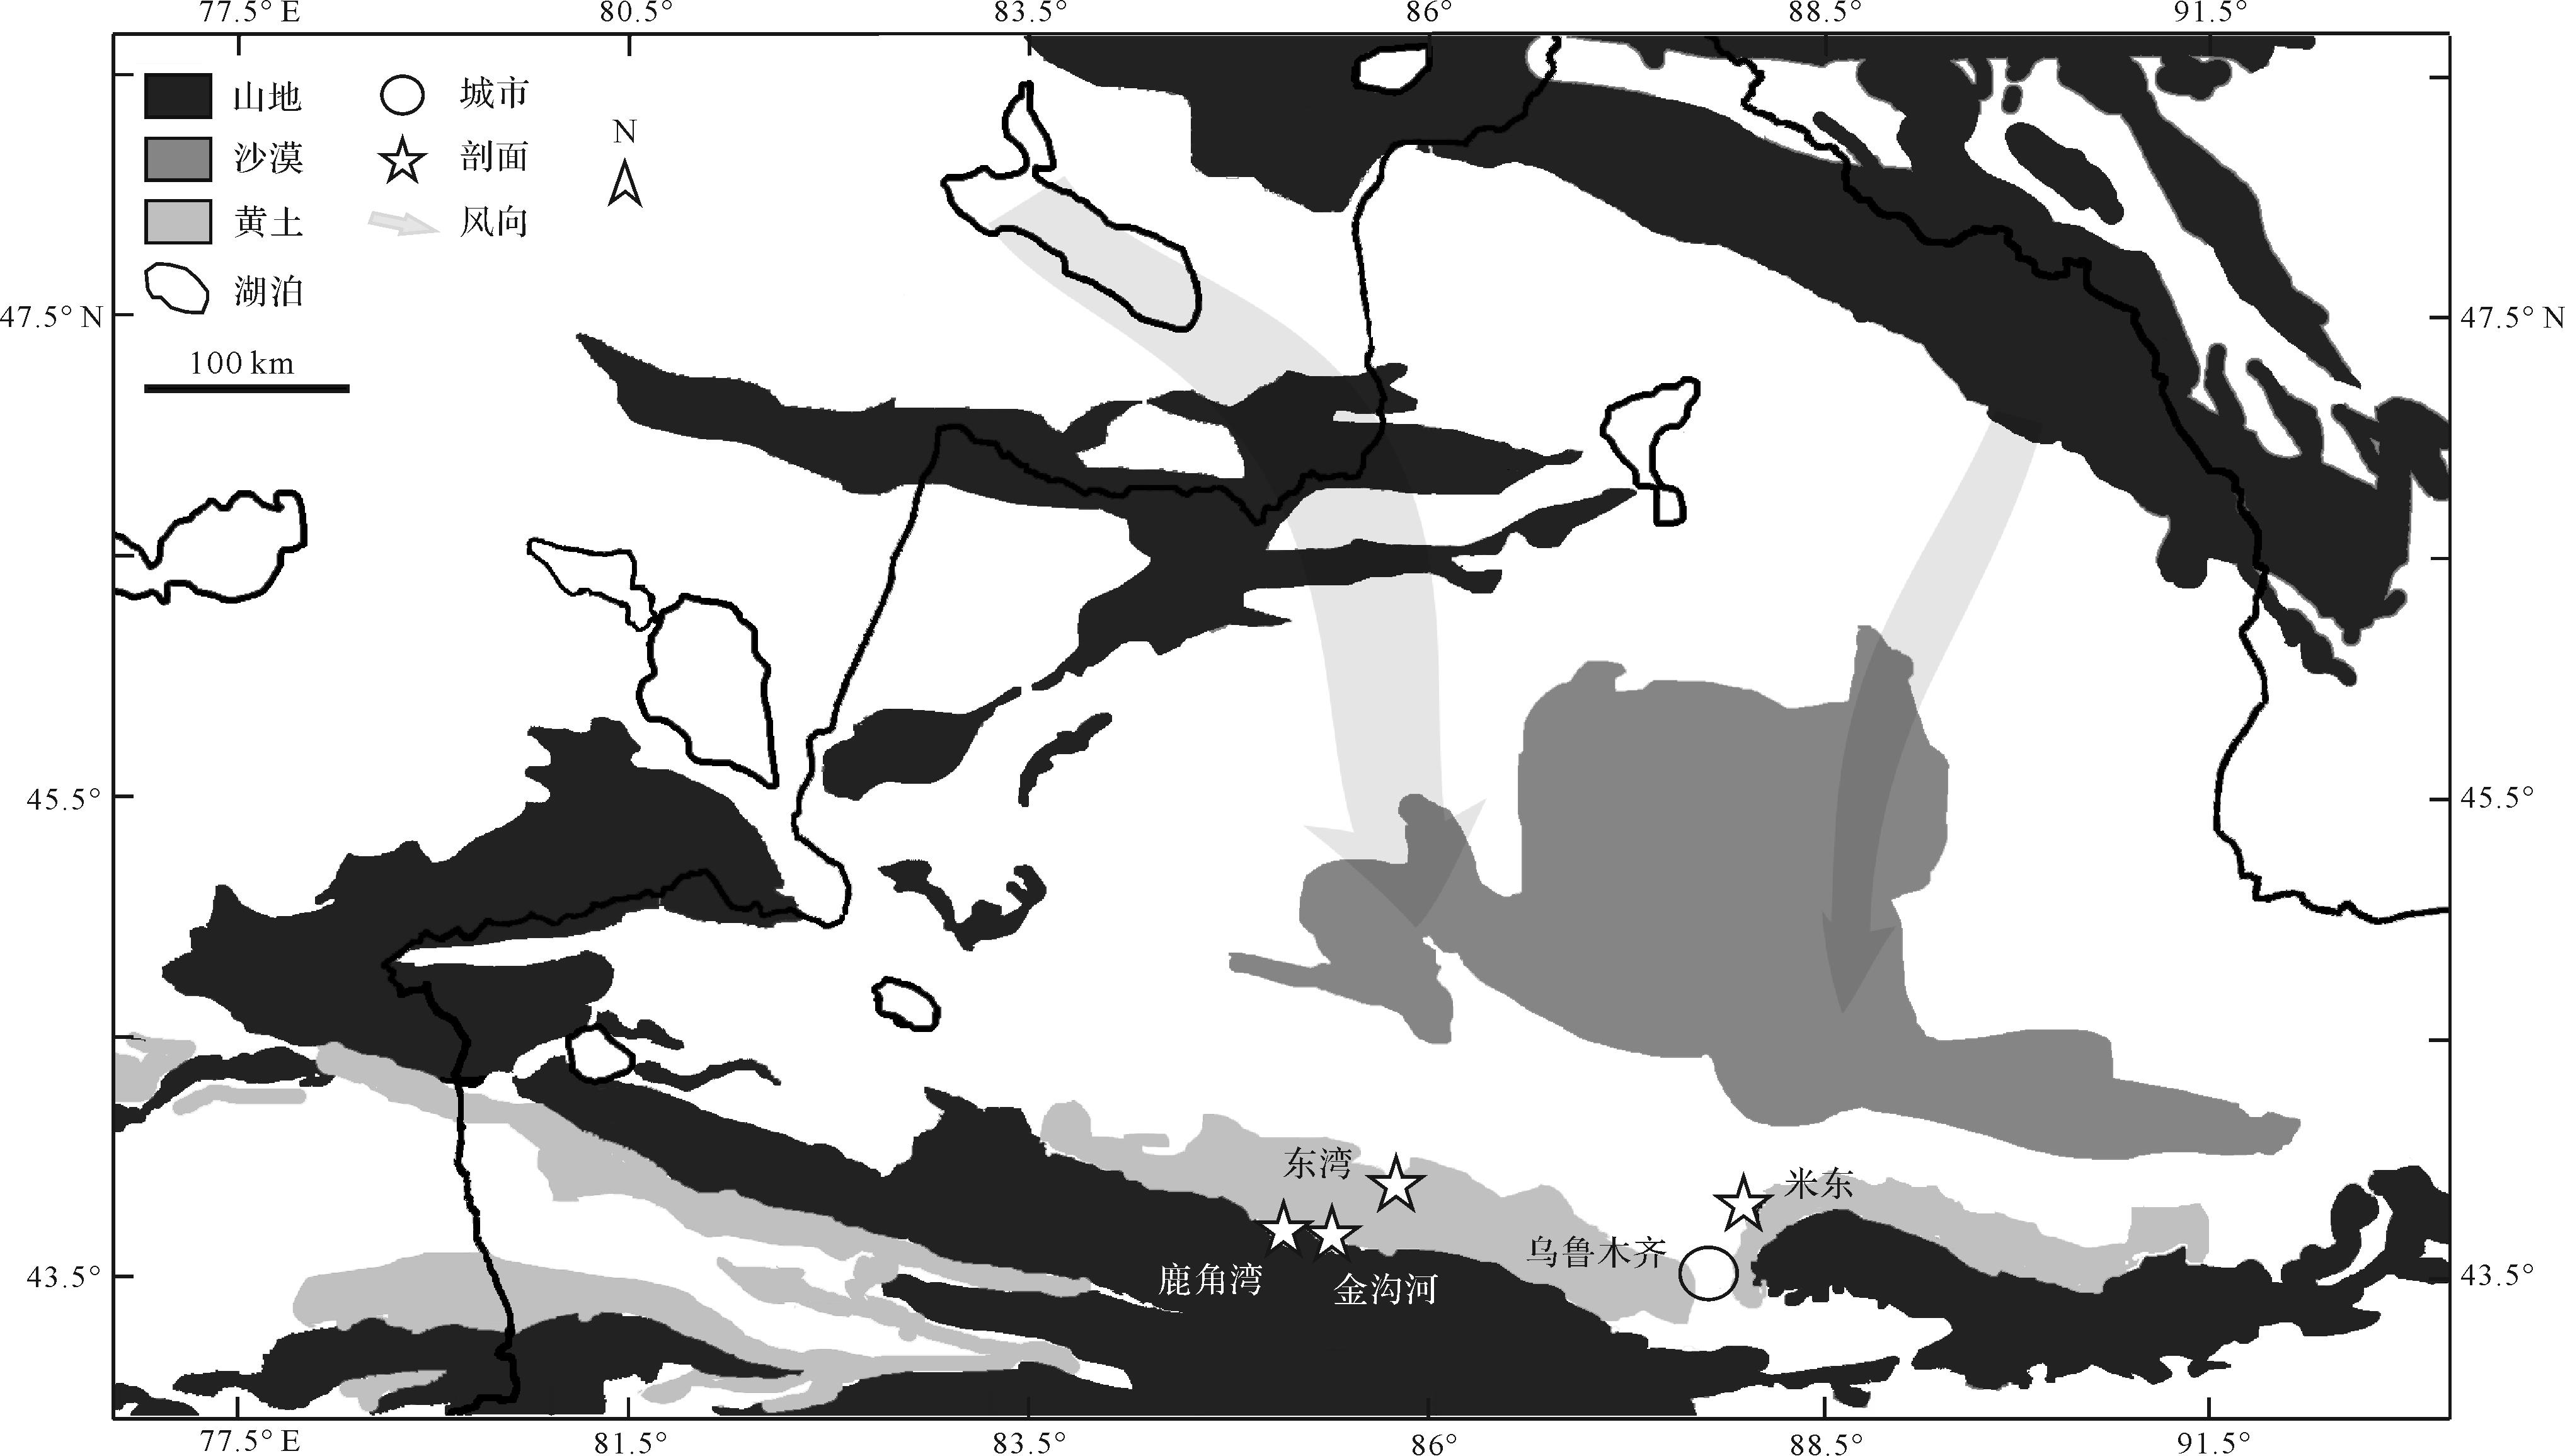
  • 在过去数十年,对黄土记录的古气候研究已经取得巨大成就。黄土高原的研究广泛而深入,亚洲中部西风带黄土的研究也屡有重要进展[1-7]。但是由于客观原因,比如相对于黄土高原黄土,整个天山地区的黄土成壤普遍较弱,物源复杂,沉积较薄,分布受限,局地因素影响大,区域差异明显,限制了天山黄土研究更深入开展。已有的天山黄土古气候研究时间尺度较多为末次间冰期即S1古土壤层开始沉积以来,而对于形成年代更老的古土壤层则较少涉及或未有深入研究。天山北麓黄土以安集海河支流头道沟出山口东岸的鹿角湾剖面[8]和宁家河一级支流清水河冲洪积扇上堆积的东湾镇剖面最具代表性[3]图1)。鹿角湾黄土底部古土壤层年龄大约为距今300 ka[9],但已有研究集中于全新世气候变化[10-12];东湾镇黄土反映800 ka以来内陆干旱化的一般趋势[3,13-14]。鉴于鹿角湾黄土的成壤强度明显强于东湾等地黄土,黄土古土壤的交替十分清楚,更有利于进一步分析对比近数十万年以来不同阶段的古气候条件。本研究以鹿角湾黄土为主,以东湾等其他天山北麓典型黄土为辅,综合色度、总碳含量、粒度、常量地球化学元素含量和环境磁学等多种指标,分析黄土物源、搬运动力和风化成壤强度等,探讨天山北麓地区300 ka以来的古气候演变。

    Figure 1.  Schematic map of the study area with locations of the studied loess sections

  • 鹿角湾位于沙湾县城以南65 km的依连哈比尔尕山北麓,冬季平均气温约-14 ℃,夏季平均气温约20 ℃,年降雨量600 mm以上。剖面位于博尔通古牧场与鹿角湾风景区内,在安集海河支流头道沟出山口东岸(纬度:43.972 95° N,经度:85.126 4° E,海拔高度:2 065 m)。自20世纪80年代起陆续有学者对鹿角湾黄土作了年代学、地层学与黄土磁学等方面研究工作。文启忠等[8,15-16]研究认为,鹿角湾剖面共有4层古土壤层,在剖面顶部的古土壤层获得的14C年龄为2.870±0.170 ka,在第一层黄土层底部获得的热释光年龄为77±6 ka。Sun[17]根据文启忠等[8,15-16]的年代学研究工作进一步指出,鹿角湾剖面可与黄土高原洛川剖面上部相对应,其底部古土壤层相当于黄土高原的S3。吕红华等[9]用电子自旋(顺磁)共振测年法(ESR)获得该剖面第3层古土壤年龄为260 ka,据此推断剖面底界年龄约为300 ka,第2~4层古土壤对应于黄土高原的S1、S2与S3。可见,前人对鹿角湾剖面的年代与地层划分认识一致。依据野外观察,鹿角湾剖面出露近9 m,可明显辨认出4层古土壤层。最上一层古土壤厚约1.25 m,其中可见黄色夹层。另外三层古土壤层呈褐红色,采样深度分别为2.5~2.8 m、5.05~6.9 m与7.45~8.4 m。古土壤层之间与8.4~8.8 m为黄土层,呈灰黄色,8.8 m之下为砾石层。基于野外观察及前人的年代学研究结果,依黄土高原惯例[1,5],我们把鹿角湾剖面的四层古土壤由上而下依次标记为S0、S1、S2与S3,古土壤层之间的黄土层则相应地分别标记为L1、L2与L3。结合室内实验数据,S2又可以细分为三层,由上而下依次标记为S2S1,S2L1与S2S2。于鹿角湾剖面顶部至剖面底部接近砾石层处连续采样,其中最底部7.8~8.8 m以20 cm间距采样,在此之上以5 cm间距采样,共计采样160个。

    东湾镇位于沙湾县城以北,两者距离大约30 km,年降水量约270 mm,年均温度约6.5 ℃,为荒漠草原灰钙土分布区。该区黄土厚度可达90 m,是整个天山北麓地区目前已报道的最厚的,这是因为在此有两股风系幅合,分别为西北风与北北东风[3]。位于清水河最高阶地上的东湾镇黄土剖面厚达71 m,土壤发育较弱,但根据颜色、特征和密实度仍可识别出9大层古土壤[14]。我们在东湾选取出露较好的黄土(纬度:44.175° N,经度:85.780° E,海拔高度:726 m),自表层至8.7 m深度以5 cm间距采样。

    金沟河剖面位于金沟河最高阶地上,厚8.8 m,海拔1 367 m,年平均降水量约为300 mm,年平均温度约5 ℃。米东剖面位于乌鲁木齐市米东区东北郊,厚30.5 m,海拔650 m,据乌鲁木齐市平原地区气候记录,年平均降水量200 mm,年平均气温-7.5 ℃~6.2 ℃。在金沟河剖面与米东剖面以5 cm间距采集黄土样品。两剖面岩石磁学与粒度测试和前期研究工作已经完成[18]

  • 对东湾样品作粒度测试,对鹿角湾样品作下述所有测试。粒度测试使用Malvern Instrument公司生产的Mastersizer 2000激光粒度仪,分选系数、峰度与偏度等粒度参数的计算依据Folk-Ward图解法[19]。色度测试使用日本柯尼卡美能达公司生产的CR-400色彩色差计,采用CELAB色度表达系统测量样品亮度(L*),红度(a*),黄度(b*)。总碳含量使用TOC分析仪测量。常量地球化学元素使用Thermo Scientific公司生产的ARL Perform’X射线荧光光谱仪测定。高、低频磁化率使用英国生产的Bartington MS2型磁化率仪测量。非磁滞剩磁(ARM)配合使用捷克AGICO公司生产的LAD-3交变退磁仪(100 mT交变场,50 µT直流场)与英国Molspin小旋转磁力仪测量。低温饱和等温剩磁随温度变化测试将样品采用液氮降温后再使其获得饱和等温剩磁(施用1T磁场),然后连续测量直至样品升温至室温。等温剩磁和饱和等温剩磁(施用1T磁场)配合使用美国ASC公司生产的脉冲强磁仪和小旋转磁力仪测量。色度与总碳含量测试在浙江师范大学地理过程实验室完成;常量地化元素在信阳师范学院分析测试中心完成;粒度和岩石磁学测试在兰州大学西部环境教育部重点实验室完成。

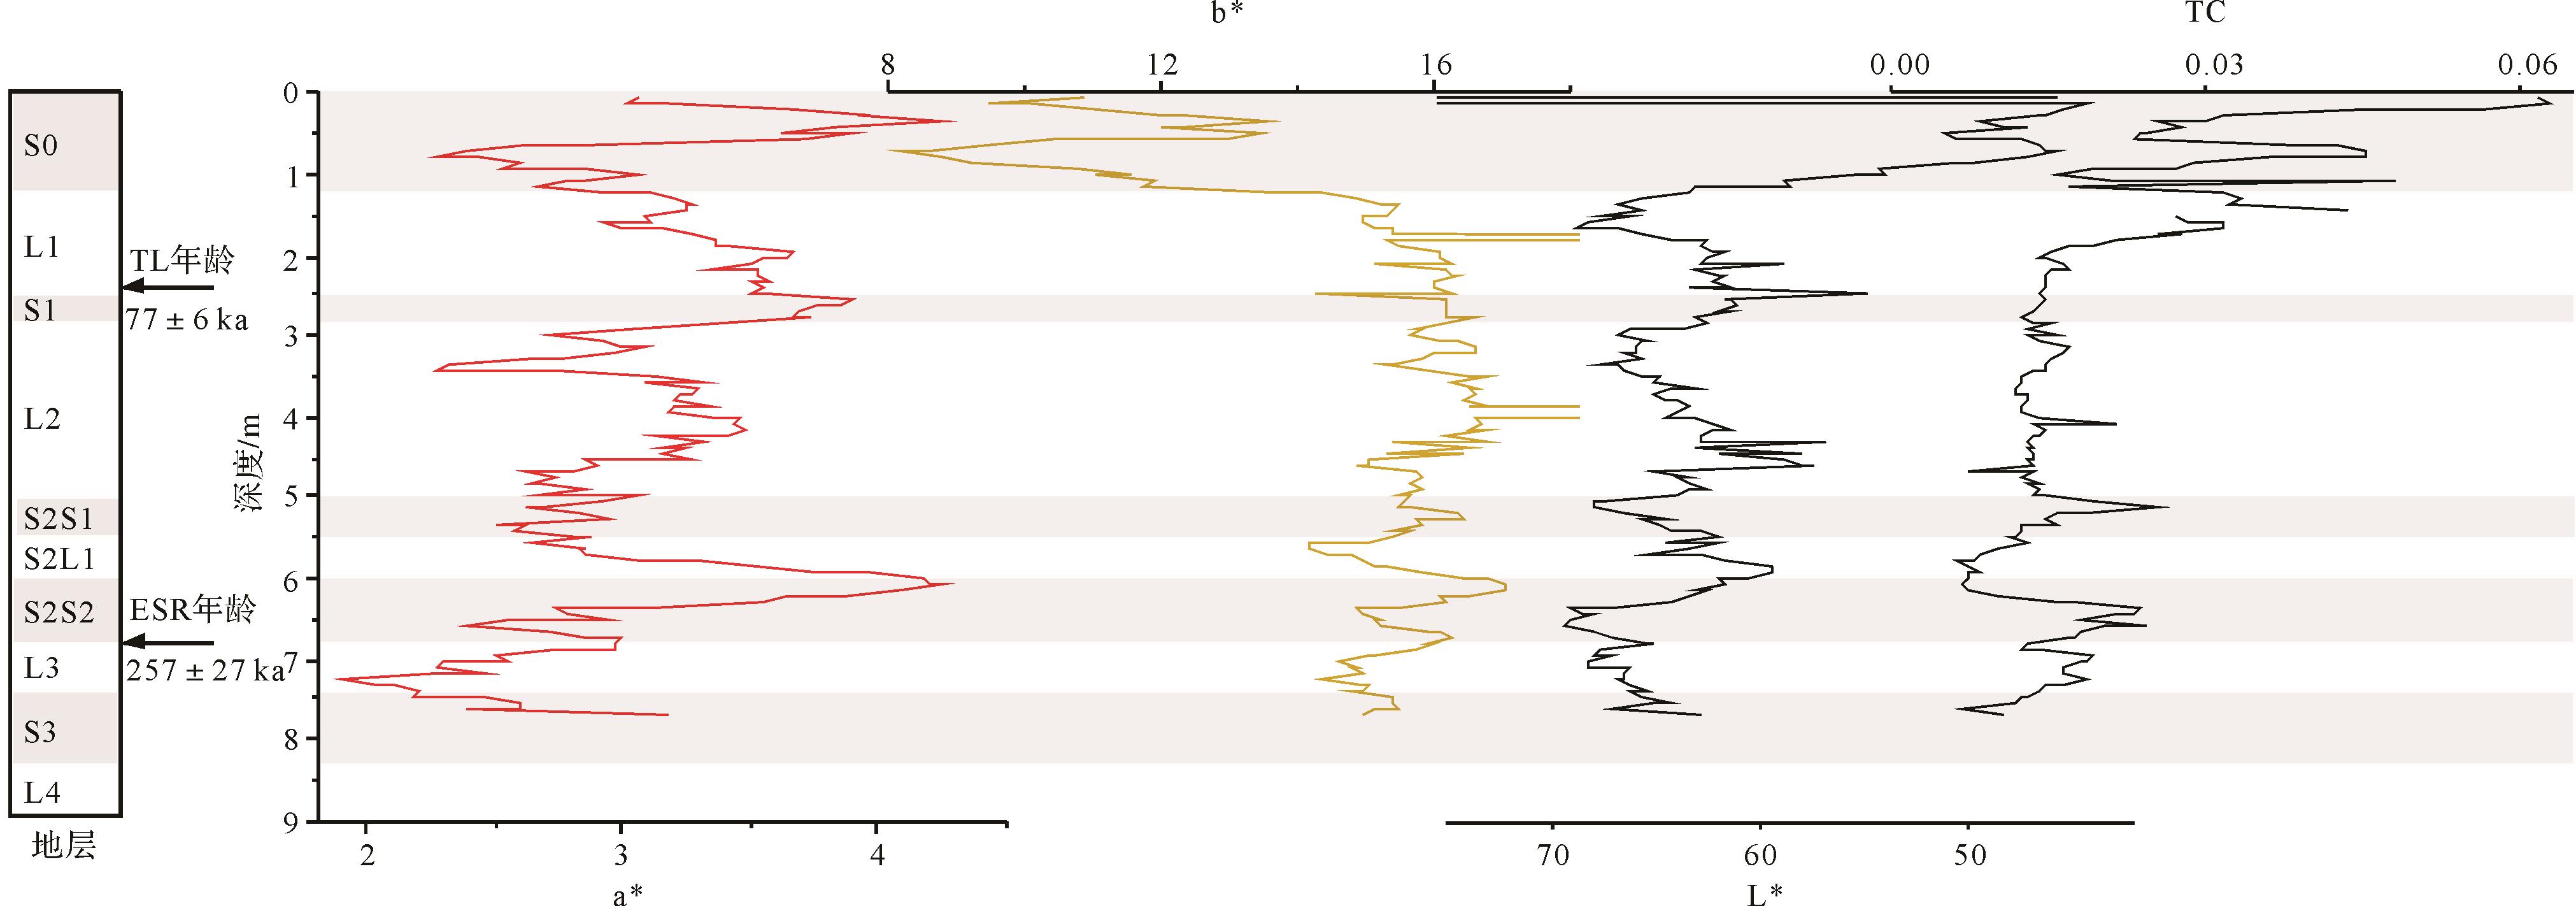
  • 在黄土中,呈赤红色的赤铁矿是主要的染色矿物,与红度有明显相关性[20-21]。鹿角湾剖面色度指标与总碳含量变化曲线(图2)表明,红度在剖面的垂向变化与野外观察的地层变化比较一致,在0.35 m、2.65 m、6 m与7.7 m附近为红度峰值,对应于四层古土壤(S3下部样品未测试色度,但自7.3 m往下至7.7 m,红度呈增加趋势)。S1与红度峰值十分吻合,S2S1与S2S2下部红度较低,但其总碳含量相对下伏层位明显增加。总体上,色度指标变化与野外观察的成壤强度变化相符。

    Figure 2.  Variations in chromatic parameters and total carbon content vs. depth at Lujiaowan (TL age from reference [16]; ESR age from reference [9])

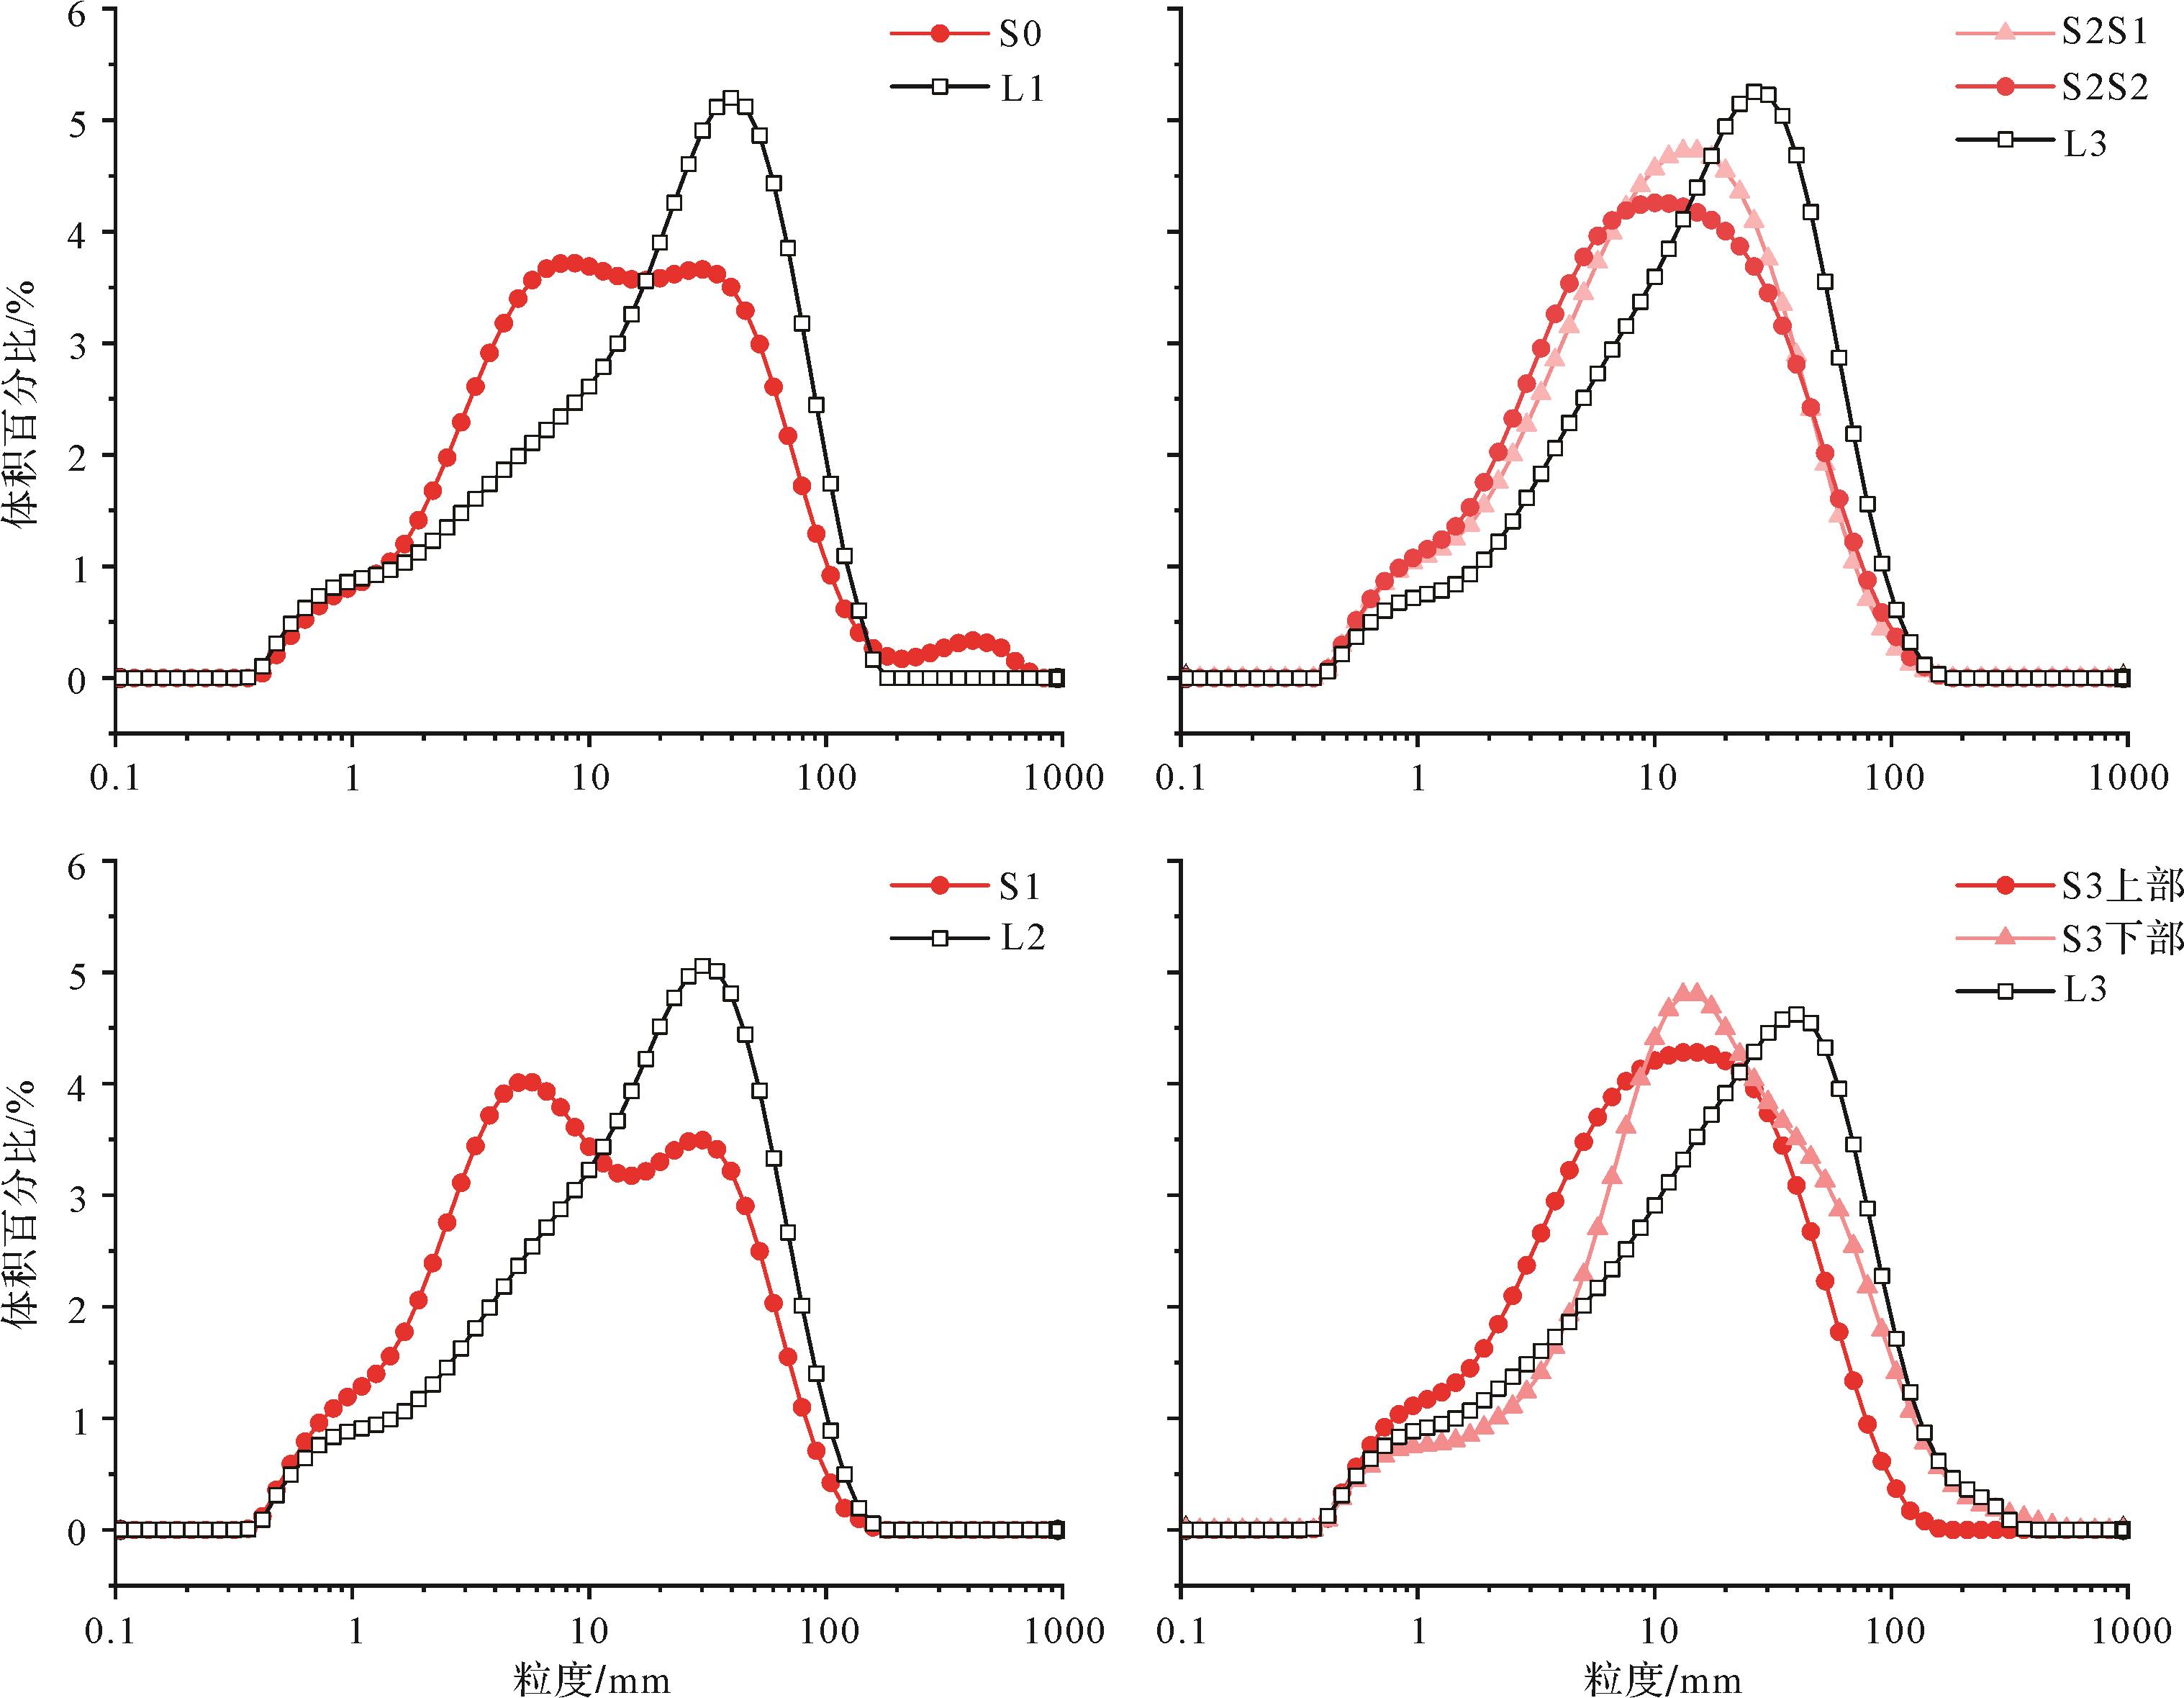
  • 粒径分布曲线可以鉴别沉积物成因,曲线上的峰可指示主要搬运动力的强度,多峰形态则可指示沉积物有多个不同的搬运动力[12,22-24]。粒度分析显示(图3),鹿角湾各黄土层样品的粒度众数,即粒度分布曲线上的峰值,为30 μm左右;粒度分布曲线形态与风成成因的典型黄土一致,随着成壤强度增加,由单峰形态转变为双峰形态,或由尖锐突出单峰转变为较平缓的单峰;S0与S1典型样品呈双峰分布,较粗端峰位于25~35 μm,较细端峰(一般为第一众数)位于5~10 μm;S3下部样品较粗端峰不明显,上部样品为平缓单峰;S2样品类似S3上部,但与S0和S1的较细端峰更接近,粒度众数更小。

    Figure 3.  Grain size distribution of typical loess⁃paleosol samples from Lujiaowan

    平均粒度显示(图4),以5 m为界,下部(S2至S3)粒度明显细于上部,而且波动较小,各古土壤层粒度小于黄土层;其他粒度指标变化与平均粒度一致。黄土层正偏态程度甚于古土壤层,但L2中部偏态接近0,这是因为该层位与S0部分样品一样,在粗端有一小峰,这也导致其>63 μm组分比重大,分选系数高。分选系数在剖面下部较低,反映分选动力较为稳定,相对单一。峰度变化与分选系数基本一致,但L1峰度较低,因为该层并无L2中部所呈现的粗端小峰,16~44 μm组分比重大,较明显偏向粗粒度一侧,分布集中,故峰态尖锐。中值粒径、>63 μm组分与<2 μm组分同样反映了剖面上下部之间与黄土古土壤之间的差异。剖面下部>63 μm组分占比明显低于上部,反映其以粉尘悬浮输入为主,为典型风成成因[23]。鉴于粒度呈双峰分布,并且为了排除成壤生成的细粒组分与局地风成或水成输入的粗粒组分影响,采用U比率(U-ratio),即5.5~16 μm与16~44 μm两粒度组分含量的比值(5.5~16 μm/16~44 μm)[24]分析两个峰值附近组分相对比例的变化。结果显示,下部古土壤样品U比率大多高于S1,但峰值低于S0中部分层位。

    Figure 4.  Variations in grain size parameters vs. depth at Lujiaowan

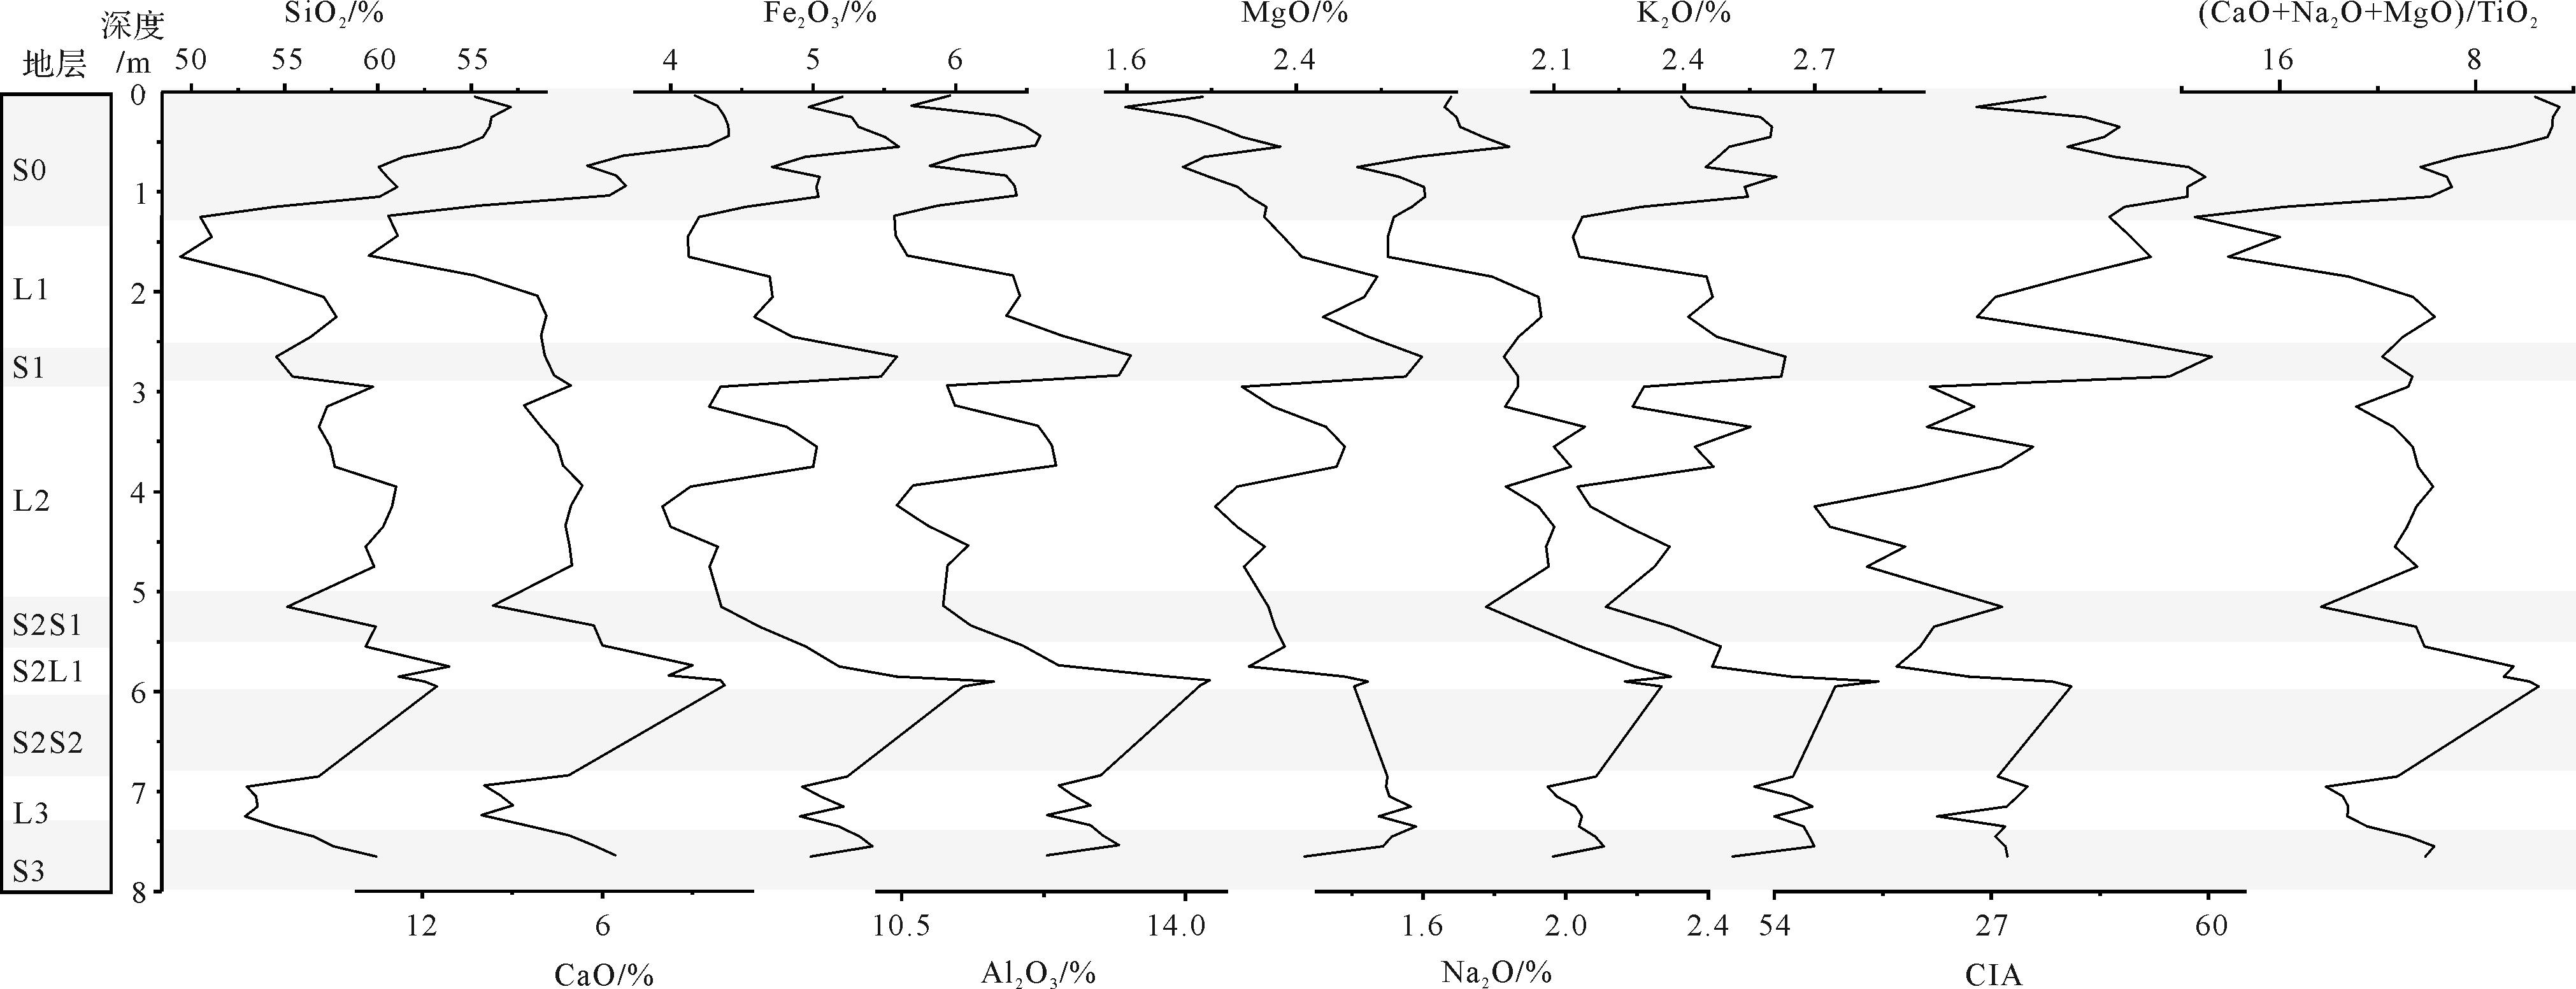
  • 黄土元素的淋溶富集反映化学风化程度,而化学蚀变指数(CIA)与(CaO+Na2O+MgO)/TiO2是较可靠的化学风化指标[5,25-27]。化学蚀变指数计算公式为CIA=[Al2O3/(Al2O3+CaO*+Na2O+K2O)]×100,其中CaO*是指硅酸盐中的钙含量,具体计算方法参考已有研究[26]。将鹿角湾黄土所含常量元素以氧化物形式表示(图5),结果显示SiO2、Al2O3和CaO是含量最高三个组分。其中SiO2含量最高,在S0高达60%~67%,在整个剖面为47%~67%;Al2O3含量次之,变化范围为10.4%~14.3%,在S1与S2为峰值;CaO含量第三,变化范围为1.8%~13.8%。CaO在古土壤层中较低,在黄土层较高,F2O3反之;K2O、Na2O和MgO含量低值见于黄土层。化学蚀变指数(CIA)与(CaO+Na2O+MgO)/TiO2指示古土壤层风化程度高于邻近黄土层。

    Figure 5.  Variations in geochemical parameters vs. depth at Lujiaowan

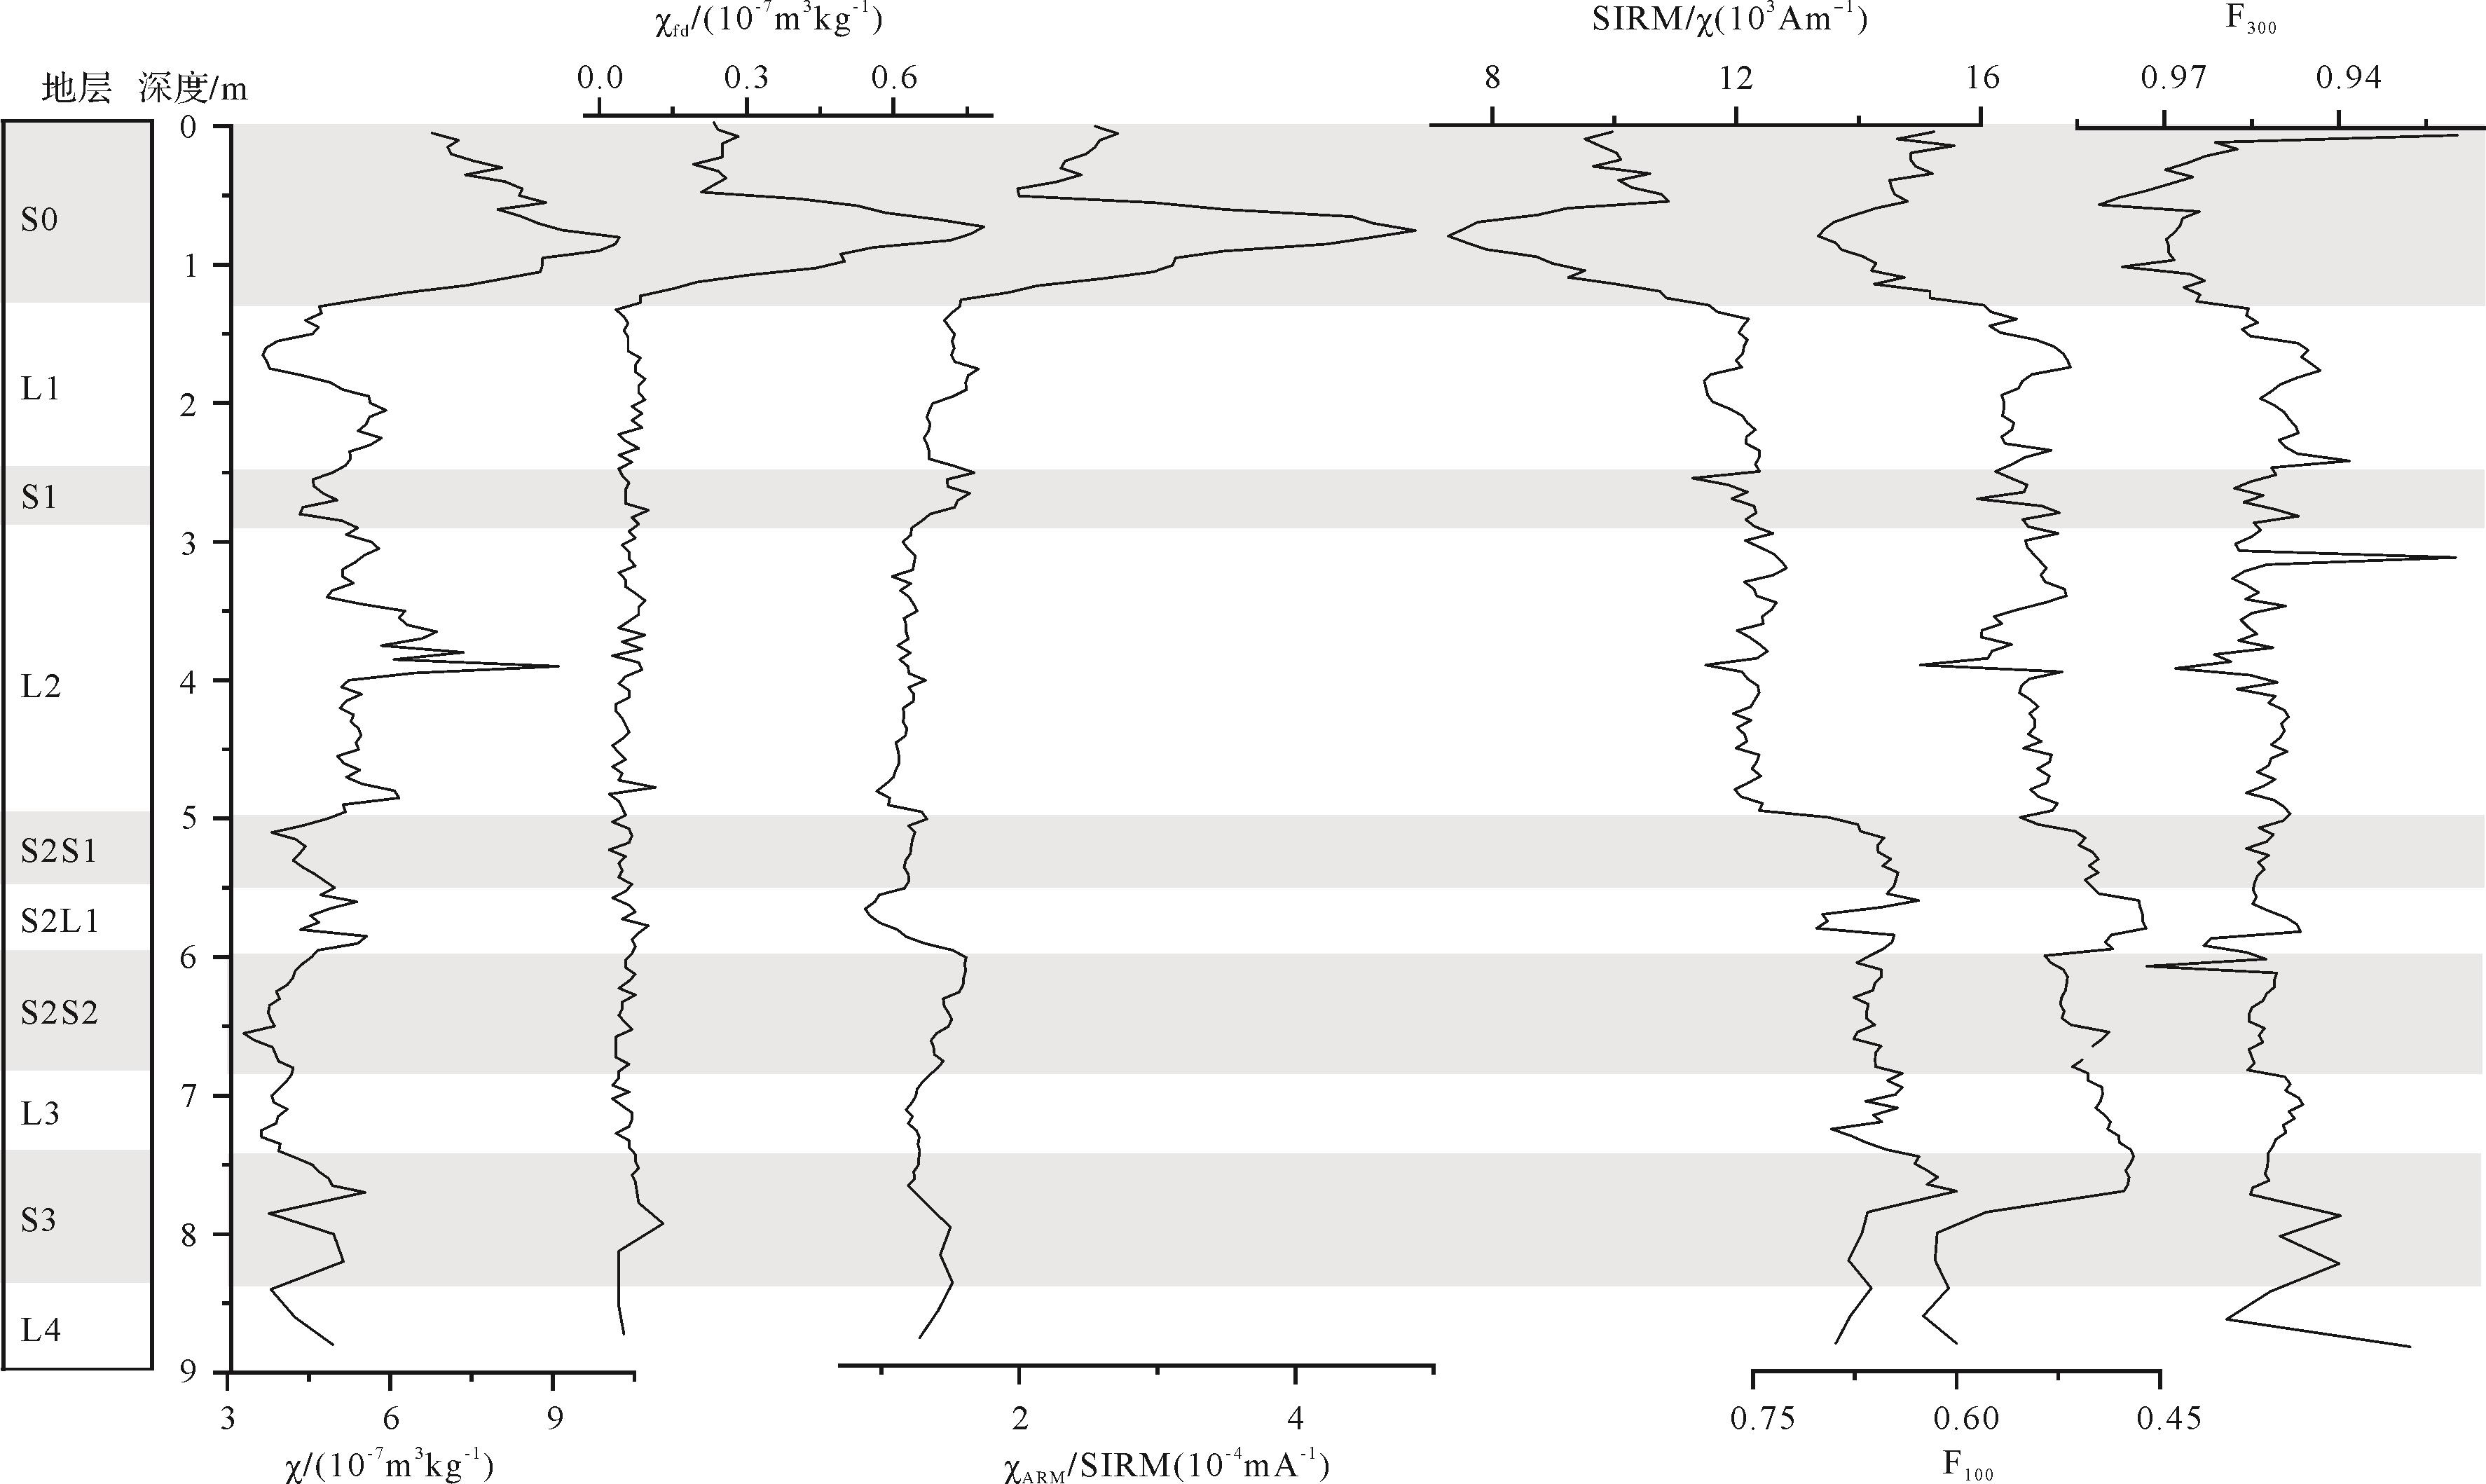
  • 天山北麓黄土的岩石磁学特征及其环境意义已经有比较多的研究[28-31]。岩石磁学特征受控于成壤作用、风力强度变化与物源区进退及区域或局地水分条件改变等多种因素影响。不同剖面与同一剖面不同层位的主控因素不尽一致甚至截然不同。如果土壤有效湿度超过一定临界值,则成壤生成的超细颗粒的强磁性的低矫顽力的亚铁磁性矿物(磁铁矿与磁赤铁矿)转化为弱磁性的高矫顽力的非亚铁磁性矿物(赤铁矿等),导致磁化率(χ)、频率磁化率(χ fd)降低,非磁滞剩磁磁化率与饱和等温剩磁(或磁化率)的比值(χ ARM/SIRM 或χ ARM/χ)也可能有一定幅度的降低[32-35]。尽管如此,χ ARM/SIRM与SIRM/χ等指标通常仍然可以较好的指示黄土的成壤作用[9,33]χ ARM/SIRM能灵敏地反映磁性矿物粒度的变化,进而揭示成壤强度的变化;SIRM/χ则受到磁性矿物粒度与磁性矿物组成两方面的影响[36-37]。100 mT或300 mT磁场中获得的等温剩磁与饱和等温剩磁的比值(IRM100mT/SIRM或IRM300mT/SIRM,标记为F100或F300)可以反映非亚铁磁性矿物或高矫顽力磁性矿物的相对含量。根据鹿角湾黄土磁学指标变化曲线(图6),S0明显不同于其下伏各黄土古土壤层各地层,S0的磁化率与频率磁化率明显更高;而多种指标显示成壤程度较高的S2S2的磁化率与频率磁化率为全剖面最低,另一转折界线则和非磁学指标相符,在5 m左右(L2/S2界线)。

    Figure 6.  Variations in rock magnetism parameters vs. depth at Lujiaowan

    低温饱和等温剩磁随温度的变化可以反映黄土亚铁磁性矿物的粒度组成,估算其超顺磁性、单畴与多畴组分的含量[38-39]。黄土样品的Verwey转换一般在-153 ℃~-163 ℃,但也可能更低[40]。Verwey转换导致的低温饱和等温剩磁减少幅度可用以计算多畴与较粗单畴磁性颗粒的占比,室温时保留的剩磁强度可以视为主要来自单畴磁性颗粒的贡献,两者之外的可以认为是超顺磁颗粒的贡献。从代表性样品的归一化的低温饱和等温剩磁曲线(图7)可以看出,L2有最明显的Verwey转换,L1仅次之,反映含有较多的强风输入的多畴磁铁矿。而S0曲线下降较慢,Verwey转换最不明显,至室温后的剩磁强度不及L1、S1与S2,可解释为S0包含的单畴相对含量不及S1与S2。

    Figure 7.  Thermal demagnetization curves for typical samples from Lujiaowan

  • 在天山北麓山前平原、古尔班通古特沙漠南缘地区,黄土沉积厚,研究时间尺度长,但是古土壤不发育,黄土—古土壤序列不明显,岩石磁学与地球化学指标等可能不够灵敏甚至不适用[25]。而在天山北麓较高海拔的黄土分布的上界附近,虽然黄土沉积速率低,但成壤较强,能更好记录冰期间冰期气候旋回,岩石磁学与地球化学指标等更灵敏,粒度指标也蕴含更丰富的古气候信息,可以为相应时间尺度的古气候研究提供很好的素材。

    天山山地黄土的研究显示红度受赤铁矿含量的影响,两者呈正相关,可以很好地反映气候变化过程,气候意义比磁化率更加明确[20]。鹿角湾剖面S2S1与S2S2下部红度较低,总碳含量较高;S0中成壤较强的层位(0.65~0.85 m)同样如此,这暗示红度可能为总碳含量抑制。

    粒度分布曲线揭示鹿角湾黄土的沉积受控于两股不同风系,较粗端峰可能反映近地面风系,而较细端峰可能反映西风沿天山北坡绕流形成的西北风[3,12]。在黄土层,近地面风系占优,黄土以粗粒为主,粒度分布曲线上西风输入的细粒粉尘贡献被掩盖。在古土壤层,黄土的细粒组份增加,在粒度分布曲线上西风与近地面风系的贡献都得以表现,甚至反映以西风影响为主。总体而言,粗粒组分含量与细粒组分含量随深度的变化是相反的,<2 μm组分与U比率(U-ratio)能指示研究区西风强度[12]

    鹿角湾黄土的常量元素变化特点与同处于比较冷湿气候下的青藏高原东南缘的理县黄土有相似之处,除反映了剖面风化程度差异之外,还可能受到物源和矿物组成等因素的影响[25]。如果与同在天山北麓且相距不远的钟梁黄土剖面相比较[19],鹿角湾剖面的不同之处主要在于CaO谷值见于古土壤层而非黄土层。这是因为在钟梁剖面降水量明显较少,风化强度整体不高,CaO淋溶有限,所以富集于古土壤层。CIA与(CaO+Na2O+MgO)/TiO2很好地反映了钟梁剖面与鹿角湾剖面黄土与古土壤的分异,尤其是后一指标,同时也揭示鹿角湾黄土经历了比钟梁黄土更强的风化作用。

    S0的χχ fdχ ARM/SIRM为全剖面最高,三者同步变化,反映成壤生成的超细颗粒的亚铁磁性矿物主导磁性变化[41],指示全新世湿润气候。S1磁化率低于L1与L2,对应粒度谷值,L1中部磁化率急剧增加,对应粒度峰值>63 μm组分的比例由<10%增加至接近25%,反映风力增强,较粗的风成成因的原生磁铁矿主控磁性变化。S1的χ ARM/SIRM较高,SIRM/χ较低,反映有较多稳定单畴磁铁矿,指示一定成壤作用和较湿润气候,但缺乏风成输入的磁铁矿,所以磁化率反而较低。

    F100(IRM100mT/SIRM)与F300(IRM300mT/SIRM)峰值同样出现在L1中部,对应粒度峰值,这与风力增强导致东湾镇黄土中更多风成成因的低矫顽力的磁铁矿的报道一致[30]。S2及其下伏地层的SIRM/χχ ARM/SIRM明显高于其上覆地层;SIRM/χ与F100在S0分别为谷值与峰值,但在S2与S3上部反之。S2与S3并没有生成大量的细颗粒的(超顺磁和稳定单畴)亚铁磁性矿物,反而富集非亚铁磁性矿物。S2与S3其发育阶段可能经历更温和的气候,风力和缓,风力输入的多畴与较粗的假单畴磁铁较少,所以在低温饱和等温剩磁随温度变化曲线上反映的单畴含量相对S0更高。另一方面因为高寒气候,土壤有效湿度过高,细颗粒的亚铁磁性矿物会转化为非亚铁磁性矿物(如赤铁矿),它们同样对剩磁强度有贡献,这或许也是S2升温至室温后,剩磁强度高于其他古土壤层的原因。

    综上,可以推断大致S3~S2(8.8~5.05 m)、L2至L1(5~1.25 m)和S0分别对应于(古土壤有效湿度过高条件下的)磁性衰减模式为主、风力模式为主与成壤增强模式为主。SIRM/χχ ARM/SIRM能较好指示古气候演变。

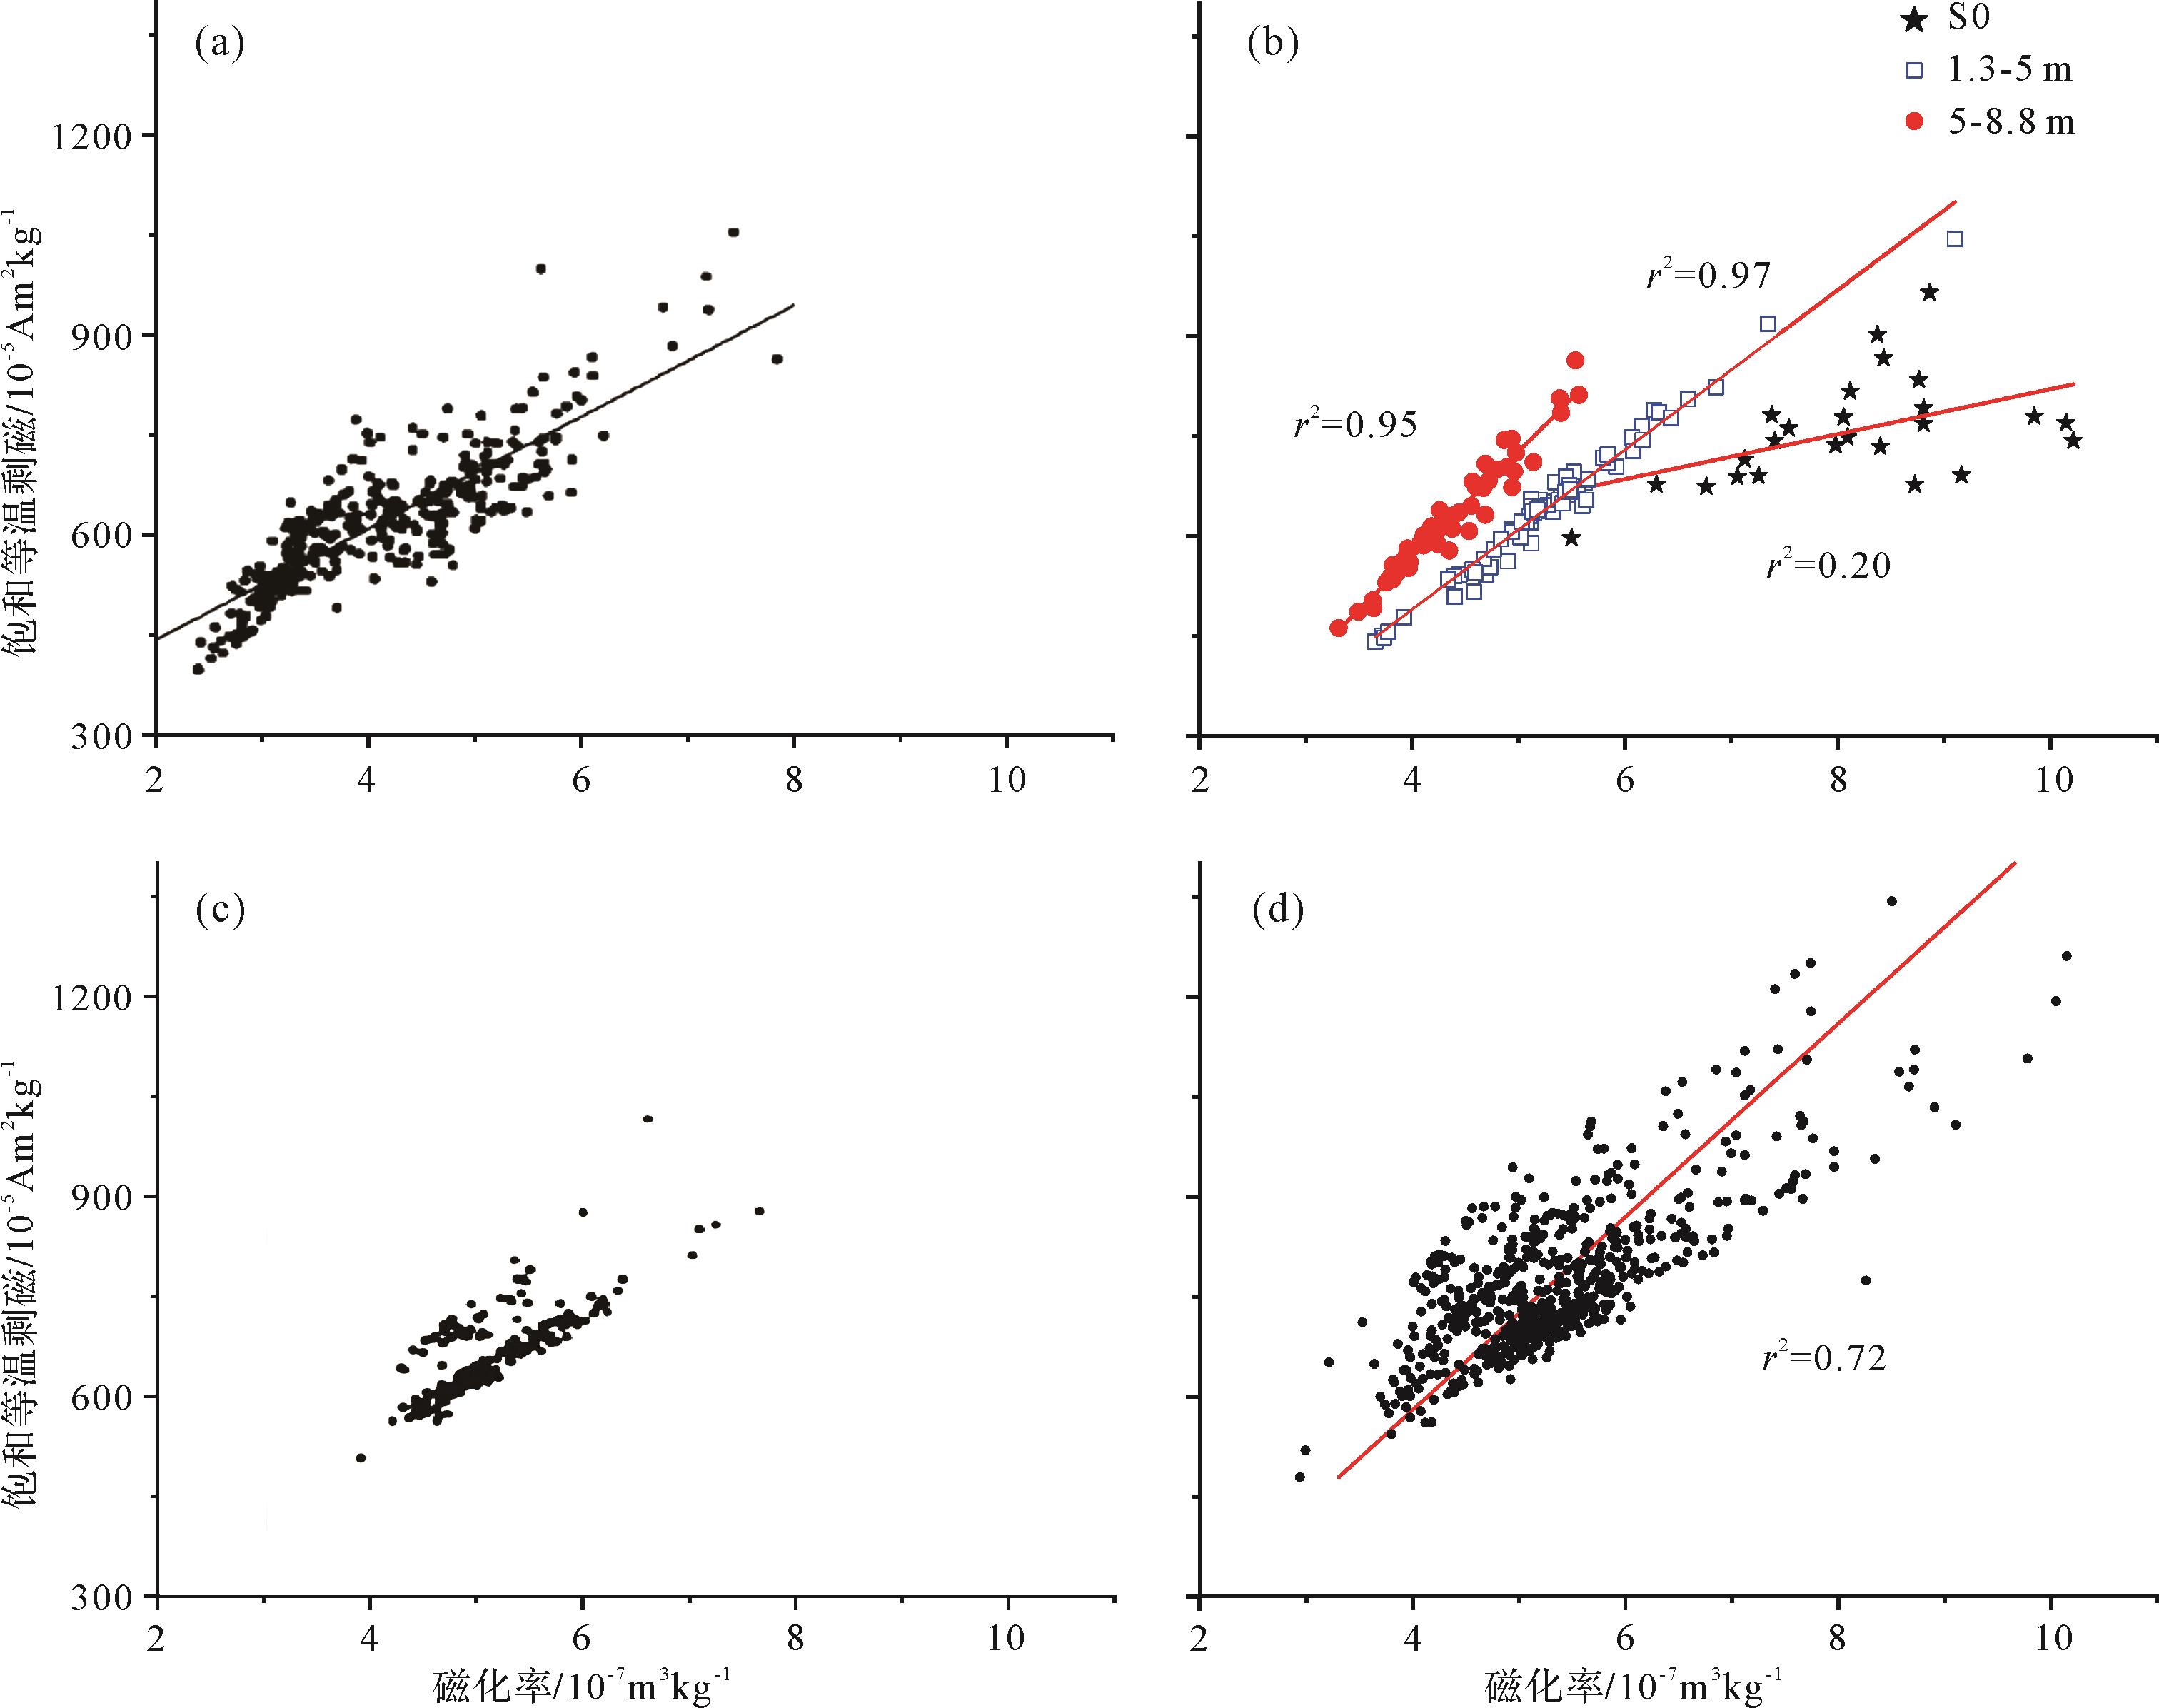
  • 鹿角湾黄土记录了S3以来的冰期间冰期周期变化,同时也反映了干旱化的趋势,L2至L1(5~1.3 m)比S3~S2(8.8~5.05 m)经历了更干旱的气候,类似趋势也见于天山北麓其他典型黄土剖面,在SIRM/χ曲线变化上表现明显。东湾镇黄土(图8a)两指标线性相关程度较高,拟合曲线斜率较低,反映其磁性变化主要受风力控制,亚铁磁性矿物粒度较粗。在散点图左下方,样品分布比较集中,SIRM相近的样品,其磁化率也相近。这部分样品基本来自东湾镇黄土剖面40 m以下,SIRM/χ为15×10-5~20×10-5 Am2kg-1,整体上高于鹿角湾下部的13×10-5~15.6×10⁻⁵ Am2kg-1。如果成壤贡献可以忽略的话,那么远离沙漠、近地面风系影响更小的鹿角湾下部的磁性矿物粒度应该更小,SIRM/χ值应该高于东湾镇黄土下部。但事实并非如此,这说明相对于东湾镇黄土,鹿角湾黄土下部成壤作用有一定贡献,影响到磁性矿物粒度与组成两方面,使SIRM/χ更低。鹿角湾剖面(图8b)三个不同部分可以明显区分,下部样品位于其他样品的左上方,拟合曲线斜率较高,S0样品位于右下方,两指标线性相关程度低(这可能因为S0物源相对复杂),L2至L1样品位置介于两者之间。通常成壤作用会生成大量的磁赤铁矿与赤铁矿,两者的绝对量都增加。鹿角湾黄土的下部古土壤强磁性矿物大幅减少,而包括赤铁矿在内的矫顽力较高的磁性矿物增加,所以红度较高,反映土壤有效湿度高,化学风化更强,古气候更湿润。金沟河剖面(图8c)下部样品位于上中部样品的左上方,这可能源于物源的变化或者黄土沉积物化学风化程度的差异。参照粒度指标,金沟河下部黄土堆积阶段,源区与沉积区气候较温和湿润,风力减弱而化学风化加强,导致风成输入的原生磁性矿物氧化程度的变化,进而使磁性矿物组成发生变化[42-43]。另一可能是因为风力减弱,输入的亚铁磁性矿物粒度变细,这也会造成SIRM/χ增加。虽然金沟河黄土都呈灰黄色,野外观察无法分辨出古土壤层,但其磁学指标也反映了干旱化趋势。距离沙漠更近的米东剖面(图8d)反映比较单一的磁化率风力增强模式,光释光测年结果显示米东(即白杨河BYH)黄土剖面底部年龄为145 ka[44],依据χ ARM/χ与SIRM/χ等环境磁学指标,其S1发育以来有一定干旱化的趋势[18]

    Figure 8.  Relationships between SIRM and χ of loess from (a)Dongwan [30]; (b)Lujiaowan; (c) Jingouhe [18]; (d) Midong

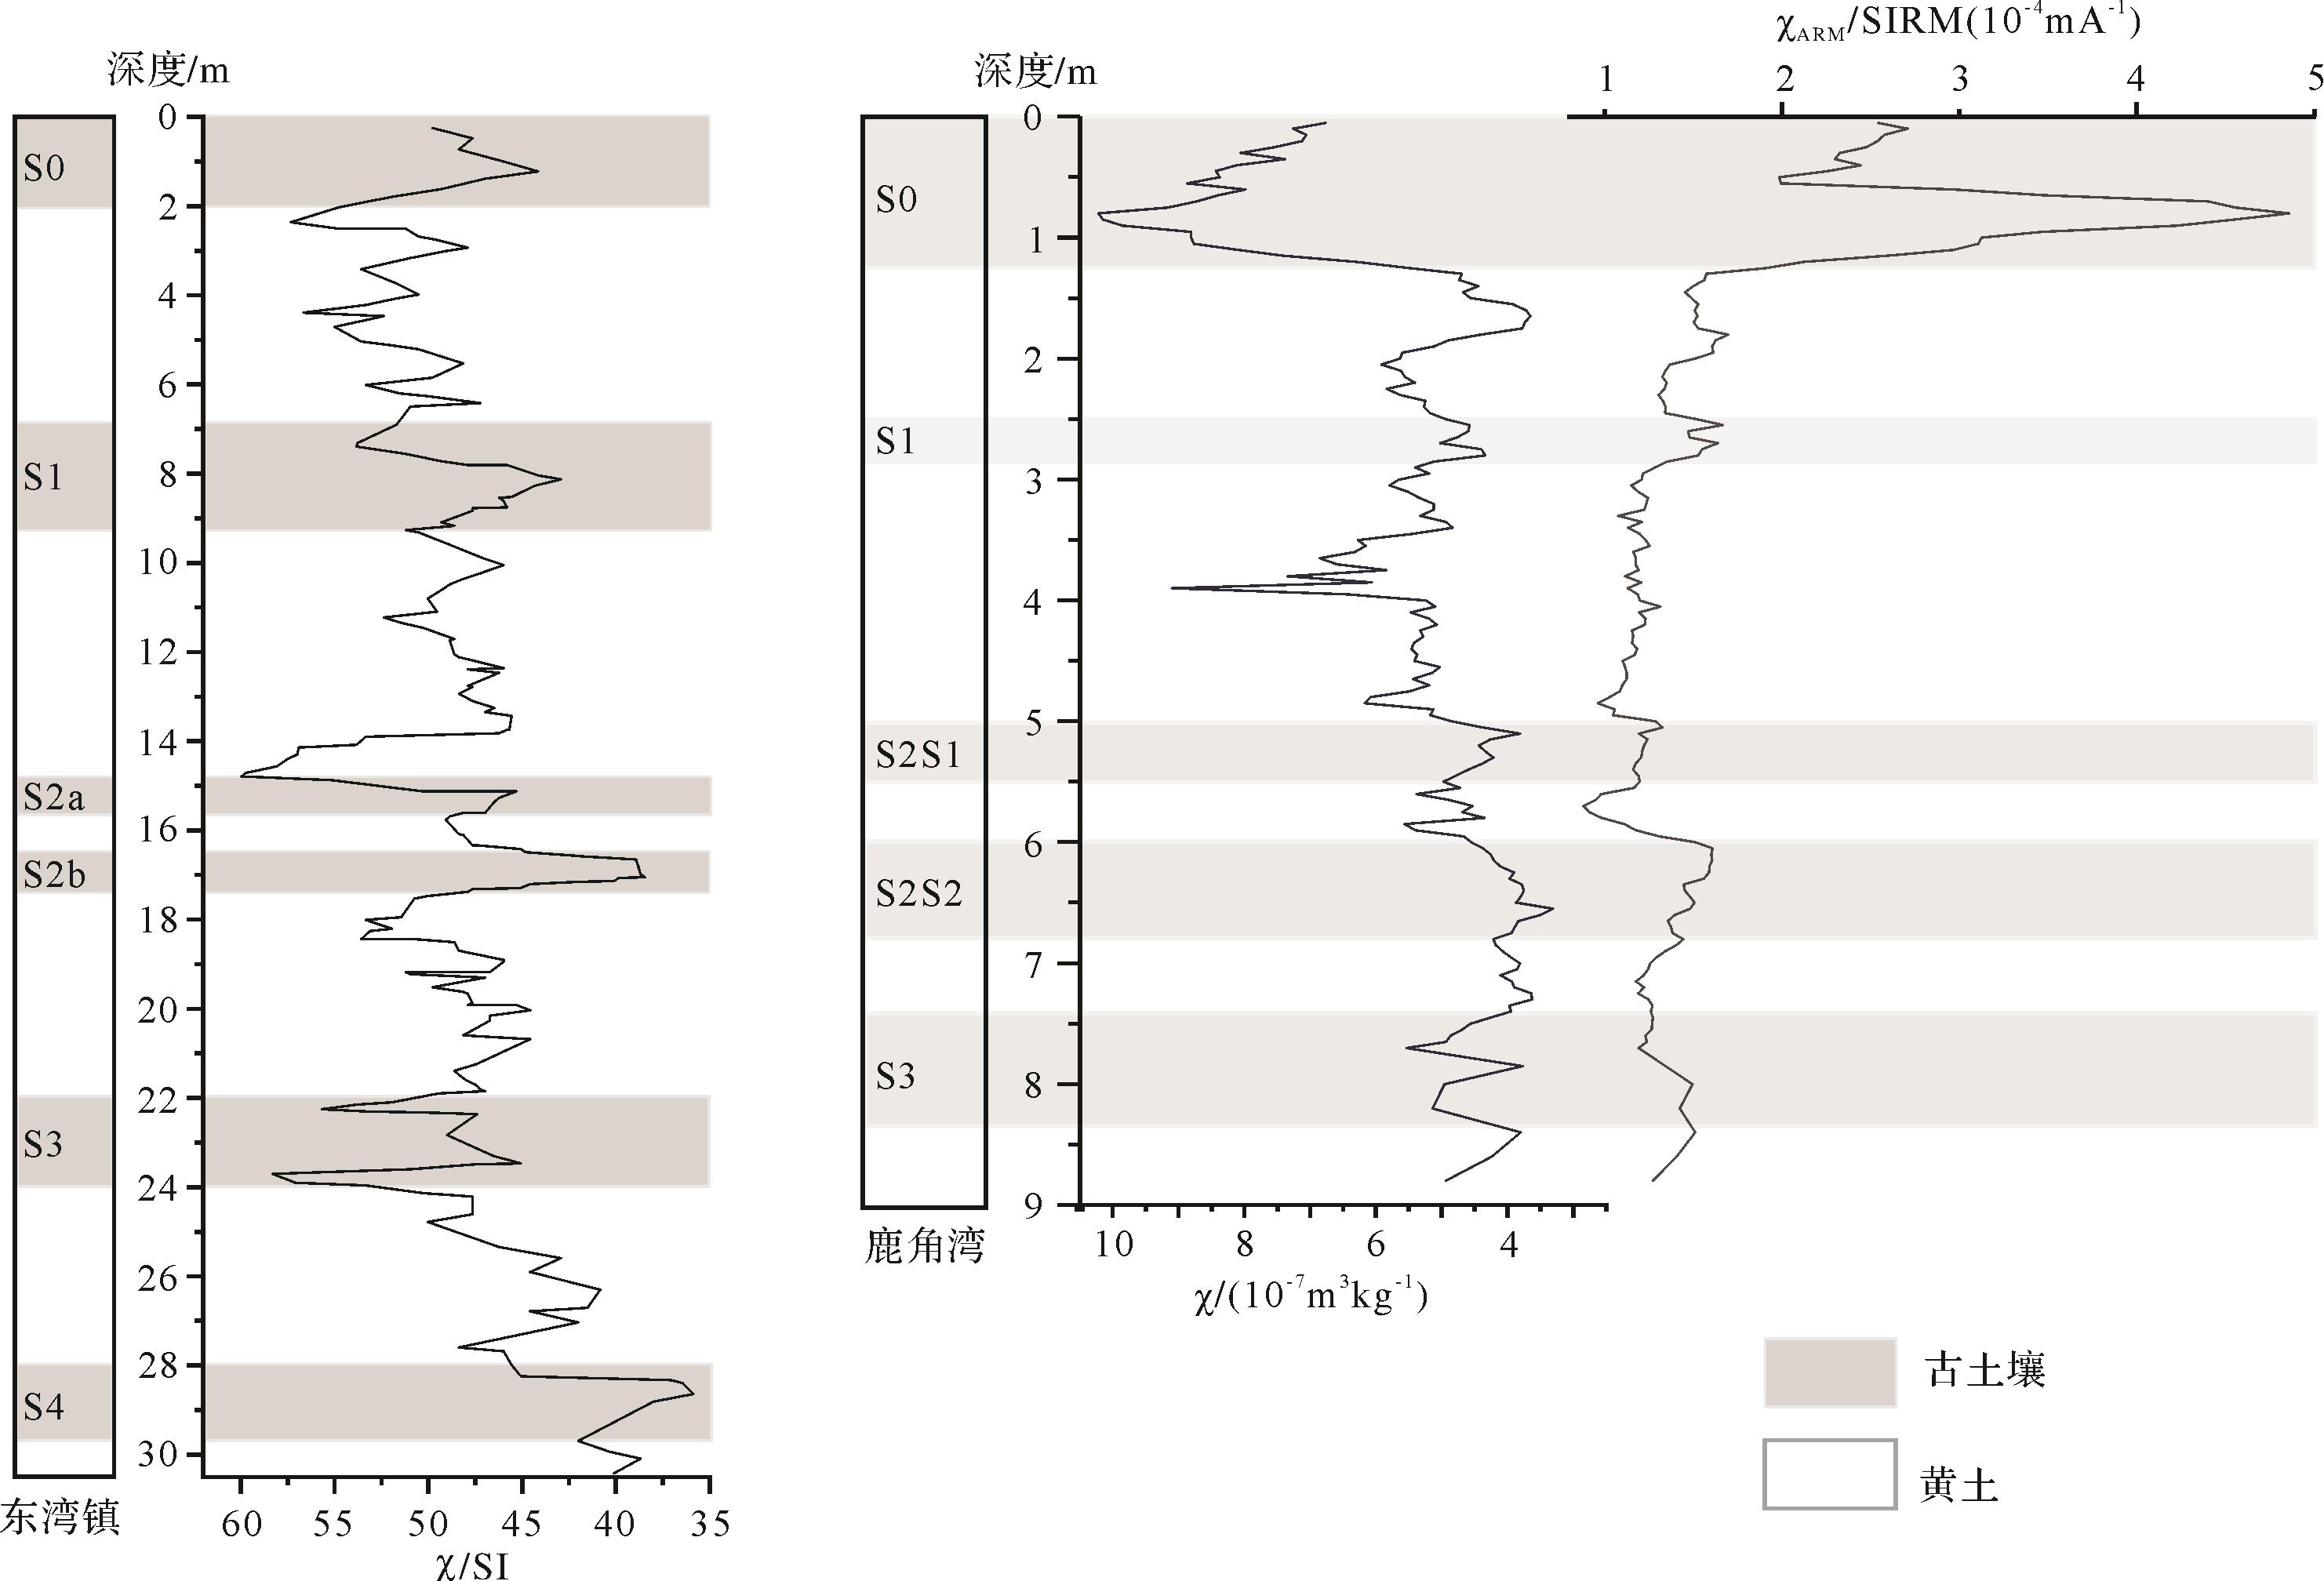
    进一步分析实验结果,发现同一指标在剖面下部的峰值或谷值大多并不在S3,而是在S2S2。S3下部粒度等指标波动较大,上部基本与S2S2相当,但古气候意义比较明确的χ ARM/SIRM则要略低于S2S2。比较鹿角湾与东湾镇黄土,可以发现两者第三层古土壤都发育比较深厚,可以划分为三个亚层,磁化率都比第四层古土壤低(图9)。类似发现同样见于西昆仑山黄土[45]与昆仑山北麓的于田大坂白西黄土[14]。依据西昆仑山黄土古气候代用指标变化曲线,可观察到大约距今230~350 ka,粒度较粗,而且在200 ka左右相对于在300 ka左右粒度明显较粗,反映古气候比较干旱[45]。天山北麓黄土S3发育阶段比S2发育阶段干旱,可能跟300 ka左右的干旱化事件有关。尽管如此,东湾镇黄土第四层古土壤(S3)发育以来的粒度与岩石磁学指标变化趋势与鹿角湾剖面有别[30],这可能因为较高海拔的鹿角湾剖面更多的受西风水气影响,而海拔较低且位于沙漠南缘的东湾镇黄土物源更复杂,更多受到局地气流影响。

    Figure 9.  Variations in rock magnetism parameters vs. depth at Dongwan (modified from reference [13]) and Lujiaowan

    东湾剖面黄土粒度变化分析(图10)表明在大约8~2.4 m处粒度有较明显的增加趋势(8 m以下层位粗粒组分大幅增加,对应L2)。相对于鹿角湾剖面,东湾剖面粒度众数明显更粗,采用4~30 μm与30~63 μm两粒度组分含量的比值(4~30 μm/30~63 μm)作为代用指标,其变化与其他粒度指标一致,反映自S1以来直至全新世开始,研究区持续干旱化。

    Figure 10.  Variations in grain size parameters vs. depth at Dongwan

    中纬度亚洲内陆地区古气候演变受冰期间冰期周期变化控制,在间冰期又受西风气流影响[46],这在鹿角湾的粒度曲线变化中有所反应。古土壤发育是不同物源(近地面风系为主)与不同水气来源(西风为主)综合影响的结果[12]。不同位置的黄土剖面对古气候的响应有所不同。古土壤开始发育与黄土开始堆积很可能并不严格对应一个间冰期的起止。各指标适用性、灵敏性不一,单一指标的运用需要谨慎。对于该区不同尺度的古气候演变研究还有待进一步深入开展。

  • 鹿角湾黄土记录了大约300 ka以来的冰期间冰期变化,并反映了西风强度变化对粉尘输送与古气候演变的影响。不同黄土剖面受西风气流与局地气流的影响,所记录区域古气候变化不尽一致,但都反映黄土沉积以来干旱化的趋势。研究区在鹿角湾黄土S2发育阶段总体上可能比在S3发育阶段略为湿润,L2黄土开始堆积对应古气候明显变干,S1发育阶段比S2与S3发育阶段干旱,干旱化趋势一直保持至全新世之前。

Reference (46)

Catalog

    /

    DownLoad:  Full-Size Img  PowerPoint
    Return
    Return