Advanced Search
Volume 41 Issue 2
Apr.  2023
Turn off MathJax
Article Contents

QU Tong, GAO Gang, XU XinDe, HUANG ZhiLong, GAN Jun, LIANG Gang, YOU JunJun. Sedimentary Simulation Experiment Study on the Distribution of Terrestrial Organic Matter in the Delta-shallow Sea Sedimentary System: A case study of the Yacheng Formation in the Yanan Sag, Qiongdongnan Basin[J]. Acta Sedimentologica Sinica, 2023, 41(2): 584-600. doi: 10.14027/j.issn.1000-0550.2021.085
Citation: QU Tong, GAO Gang, XU XinDe, HUANG ZhiLong, GAN Jun, LIANG Gang, YOU JunJun. Sedimentary Simulation Experiment Study on the Distribution of Terrestrial Organic Matter in the Delta-shallow Sea Sedimentary System: A case study of the Yacheng Formation in the Yanan Sag, Qiongdongnan Basin[J]. Acta Sedimentologica Sinica, 2023, 41(2): 584-600. doi: 10.14027/j.issn.1000-0550.2021.085

Sedimentary Simulation Experiment Study on the Distribution of Terrestrial Organic Matter in the Delta-shallow Sea Sedimentary System: A case study of the Yacheng Formation in the Yanan Sag, Qiongdongnan Basin

doi: 10.14027/j.issn.1000-0550.2021.085
Funds:

CNOOC 13th Five-Year Plan Oil and Gas Resources Evaluation Project YXKY-2018-KT-01

Oil and Gas Resources Evaluation of CNOOC Mineral Rights Area in the “13th Five-Year” National Oil and Gas Resource Evaluation Project 2017YQZYPJ0109

  • Received Date: 2020-05-17
  • Accepted Date: 2021-07-30
  • Rev Recd Date: 2020-07-01
  • Available Online: 2021-07-30
  • Publish Date: 2023-04-10
  • Terrestrial organic matter plays an important role in the delta-shallow sea sedimentary system. More and more oil and gas exploration practices find the contribution of terrestrial organic matter in deep-water areas. In the Yacheng Formation of the Qiongdongnan Baisn, the source rocks are dominated by terrestrial organic matter, which has attracted the attention of many scholars. However, due to the deep buried depth of the source rock and the lake in the deep-water area, the research and exploration progress of the source rock in this area is greatly restricted. Based on the geological background of the Yacheng Formation in the Yanan Sag, Qiongdongnan Basin, this study designed a flume experiment of terrestrial organic matter, which is a “forward modeling” method, to observe the deposition process of terrestrial organic matter and sample the sedimentation results. Particle size and total organic carbon (TOC) analyses were carried out on the samples, establishing a terrestrial organic carbon content prediction model through a large amount of analytical test data and applying the model to an actual research area with less data. We combine the qualitative observation of the experimental process and quantitative calculation results to establish a terrestrial organic matter distribution pattern. The results show that the terrigenous organic matter is mainly deposited in the low-lying parts with a weak hydrodynamic force. From the source area to the deep water area, due to the interaction between the river and the sea water, the transport capacity of the river is reduced, and the organic carbon content increases obviously in the shallow water. In a certain range of the shallow water area, due to the gradual decline of river transport capacity, organic carbon content decreased. Using the change of sediment grain size to reflect the hydrodynamic conditions, the correlation between hydrodynamic conditions and transport organic carbon content was explored, and the changing trend of terrigenous organic carbon content was predicted. This is consistent with the distribution characteristics of terrigenous organic matter in modern estuarine sediments. According to the prediction, for Experiment 1 (slope 3°-5°), the longest distance of terrigenous organic matter transport is 6.66 m, and the maximum of terrigenous organic carbon content is 4.4 m; for Experiment 2 (slope 1°-3°), the maximum distance of terrigenous organic matter transport is 6.00 m, and the maximum content of terrigenous organic carbon is 4.12 m; for the Yacheng Formation (slope < 0.1°), the maximum transport distance of terrigenous organic matter is 47.7 km, and the maximum content of terrigenous organic carbon is at 30 km. With the decrease of the paleotopography slope, the maximum transport distance of terrigenous organic matter also decreases, and the high value area of organic carbon content migrates to the source direction. The dominant distribution area of terrigenous organic matter is near the delta front shallow sea area. Based on the observation of the experimental process and the prediction of the changing trend of terrigenous organic carbon content, a single source "single peak" terrigenous organic matter distribution model map was established. In the delta plain area, the organic carbon content was mainly controlled by the growth and enrichment of in-situ organisms, which was the main control area of in-situ organic carbon. In the delta front littoral shallow sea area, terrigenous organic matter is deposited in large quantities, and its contribution may exceed that of shallow sea organisms, which is the main control area of terrigenous organic carbon. In the coastal shallow sea deep sea area, marine organisms are the main suppliers of organic matter, which is the main control area of marine organic carbon. The main control area of terrigenous organic carbon is the most favorable area for the development of terrigenous marine source rocks. With multi-source intersection, the distribution characteristics of terrigenous organic matter are superimposed for a single source, and the terrigenous organic carbon content in the source intersection area will be higher than that of a single source supply, which can also be used as the dominant area for the development of terrigenous marine source rocks. Using the first mock exam, we can predict the distribution of organic carbon for the Yancheng Formation in the Yanan Sag. The source of the northwest part of the Yanan Sag can transport the organic matter 47.7 km, that is, the transported organic matter can be transported to the center of the depression. The content of terrigenous organic carbon gradually increased from well Y1 to the center of the depression, and reached the maximum at well Y4. Since then, the content of terrigenous organic carbon gradually decreased to the center of the depression. The content of terrigenous organic carbon rapidly decreased from well Y6 to 0 in the center of the depression. This method can also be used to predict the distribution of terrigenous organic matter in other deep-water basins.
  • [1] 马瑞罡,刘传联. 海相烃源岩发育的古海洋模式及对南海北部的指示意义[J]. 海洋地质前沿,2020,36(8):11-18.

    Ma Ruigang, Liu Chuanlian. Paleoceanographic patterns of marine hydrocarbon source rocks and its indicating significance to the northern South China Sea[J]. Marine Geology Frontiers, 2020, 36(8): 11-18.
    [2] 梁建设,张功成,王璞珺,等. 南海陆缘盆地构造演化与烃源岩特征[J]. 吉林大学学报(地球科学版),2013,43(5):1309-1319.

    Liang Jianshe, Zhang Gongcheng, Wang Pujun, et al. Tectonic evolution of epicontinental basins in South China Sea and their feature of source rocks[J]. Journal of Jilin University (Earth Science Edition), 2013, 43(5): 1309-1319.
    [3] 谢玉洪. 南海西部海域高温高压天然气成藏机理与资源前景:以莺—琼盆地为例[J]. 石油钻采工艺,2016,38(6):713-722.

    Xie Yuhong. Hydrocarbon accumulation mechanism and resource prospect of HTHP natural gas reservoirs in western South China Sea: A case study on the Ying-Qiong Basin[J]. Oil Drilling & Production Technology, 2016, 38(6): 713-722.
    [4] 杨海长,陈莹,纪沫,等. 珠江口盆地深水区构造演化差异性与油气勘探意义[J]. 中国石油勘探,2017,22(6):59-68.

    Yang Haizhang, Chen Ying, Ji Mo, et al. Structural evolution difference and the significance for oil and gas exploration in the deep water area of the Pearl River Mouth Basin[J]. China Petroleum Exploration, 2017, 22(6): 59-68.
    [5] 李丹,杨香华,常吟善,等. 澳大利亚北卡那封盆地中上三叠统Mungaroo三角洲陆源有机质分布特征[J]. 古地理学报,2014,16(2):193-204.

    Li Dan, Yang Xianghua, Chang Yinshan, et al. Distribution of the Upper Triassic terrigenous organic matter in Mungaroo delta of North Carnarvon Basin, Australia[J]. Journal of Palaeogeography, 2014, 16(2): 193-204.
    [6] Gordon E S, Goñi M A. Sources and distribution of terrigenous organic matter delivered by the Atchafalaya River to sediments in the northern gulf of Mexico[J]. Geochimica et Cosmochimica Acta, 2003, 67(13): 2359-2375.
    [7] Ramaswamy V, Gaye B, Shirodkar P V, et al. Distribution and sources of organic carbon, nitrogen and their isotopic signatures in sediments from the Ayeyarwady (Irrawaddy) continental shelf, northern Andaman Sea[J]. Marine Chemistry, 2008, 111(3/4): 137-150.
    [8] Hu L M, Shi X F, Bai Y Z, et al. Recent organic carbon sequestration in the shelf sediments of the Bohai Sea and Yellow Sea, China[J]. Journal of Marine Systems, 2016, 155: 50-58.
    [9] 赵美训,张玉琢,邢磊,等. 南黄海表层沉积物中正构烷烃的组成特征、分布及其对沉积有机质来源的指示意义[J]. 中国海洋大学学报,2011,41(4):90-96.

    Zhao Meixun, Zhang Yuzhuo, Xing Lei, et al. The composition and distribution of n-alkanes in surface sediments from the South Yellow Sea and their potential as organic matter source indicators[J]. Periodical of Ocean University of China, 2011, 41(4): 90-96.
    [10] 刘忠保,赖志云,汪崎生. 湖泊三角洲砂体形成及演变的水槽实验初步研究[J]. 石油实验地质,1995,17(1):34-41.

    Liu Zhongbao, Lai Zhiyun, Wang Qisheng. Flume-experimental study on the formation and evolution of lake delta sandbody[J]. Experimental Petroleum Geology, 1995, 17(1): 34-41.
    [11] Lee H Y, Yu W S. Experimental study of reservoir turbidity current[J]. Journal of Hydraulic Engineering, 1997, 123(6): 520-528.
    [12] Li W H, Zhang Z H, Li Y C, et al. The main controlling factors and developmental models of Oligocene source rocks in the Qiongdongnan Basin, northern South China Sea[J]. Petroleum Science, 2013, 10(2): 161-170.
    [13] Su L, Zhang D W, Yang H Z, et al. Chemical kinetics evaluation and its application of natural gas generation derived from the Yacheng Formation in the deep-water area of the Qiongdongnan Basin, China[J]. Acta Oceanologica Sinica, 2018, 37(1): 50-59.
    [14] 李增学,宋广增,王东东,等. 琼东南盆地渐新统煤系(扇)辫状河三角洲特征[J]. 地球科学,2018,43(10):3471-3484.

    Li Zengxue, Song Guangzeng, Wang Dongdong, et al. Characteristics of (fan) braided river delta in Oligocene coal measures of Qiongdongnan Basin[J]. Earth Science, 2018, 43(10): 3471-3484.
    [15] 胡忠良. 琼东南盆地崖南凹陷烃源岩生烃动力学和油气成藏研究[D]. 广州:中国科学院研究生院(广州地球化学研究所),2005:8-17.

    Hu Zhongliang. Study on petroleum generation kinetics of source rocks and gas pool formation in the Yanan Depression of the Qingdongnan Basin[D]. Guangzhou: Graduate School of Chinese Academy of Sciences (Guangzhou Institute of Geochemistry), 2005: 8-17.
    [16] 刘传联. 琼东南盆地渐新统烃源岩微观沉积特征与沉积环境[J]. 石油学报,2010,31(4):573-578.

    Liu Chuanlian. Sedimentary environment and micro-sediment characteristics of Oligocene source rocks in Qiongdongnan Basin[J]. Acta Petrolei Sinica, 2010, 31(4): 573-578.
    [17] 孙瑞,韩银学,曾清波,等. 琼东南盆地深水区东段崖城组沉积特征及对海相烃源岩的控制[J]. 石油学报,2019,40(增刊2):57-66.

    Sun Rui, Han Yinxue, Zeng Qingbo, et al. Sedimentary characteristics of Yacheng Formation in the eastern deepwater area in Qiongdongnan Basin and their control on marine source rocks[J]. Acta Petrolei Sinica, 2019, 40(Suppl.2): 57-66.
    [18] 武爱俊,徐建永,滕彬彬,等. “动态物源”精细刻画方法与应用:以琼东南盆地崖南凹陷为例[J]. 岩性油气藏,2017,29(4):55-63.

    Wu Aijun, Xu Jianyong, Teng Binbin, et al. Fine description method of dynamic provenance and its application a case from Yanan Sag, Qiongdongnan Basin[J]. Lithologic Reservoirs, 2017, 29(4): 55-63.
    [19] 王敏芳. 琼东南盆地崖南凹陷崖13-1构造与崖21-1构造成藏条件的比较[J]. 地球学报,2002,23(6):559-562.

    Wang Minfang. A comparison of petroleum accumulation between YA13-1 structure and YA21-1 structure in Yanan Depression within Qiongdongnan Basin[J]. Acta Geoscientia Sinica, 2002, 23(6): 559-562.
    [20] 尚鲁宁,吕大炜,李增学,等. 琼东南盆地崖南凹陷崖城组辫状河三角洲沉积特征及油气地质意义[J]. 油气地质与采收率,2013,20(5):4-9.

    Shang Luning, Dawei Lü, Li Zengxue, et al. Depositional characteristics and petroleum geology significance of braided delta system in Yacheng Formation, Yanan Sag, Qiongdongnan Basin[J]. Petroleum Geology and Recovery Efficiency, 2013, 20(5): 4-9.
    [21] 米立军,王东东,李增学,等. 琼东南盆地崖城组高分辨率层序地层格架与煤层形成特征[J]. 石油学报,2010,31(4):534-541.

    Mi Lijun, Wang Dongdong, Li Zengxue, et al. High-resolution sequence stratigraphic framework and coal-forming features in Yacheng Formation of Qiongdongnan Basin[J]. Acta Petrolei Sinica, 2010, 31(4): 534-541.
    [22] 高全洲,沈承德,孙彦敏,等. 北江流域有机碳侵蚀通量的初步研究[J]. 环境科学,2001,22(2):12-18.

    Gao Quanzhou, Shen Chengde, Sun Yanmin, et al. A preliminary study on the organic carbon weathering fluxes in Beijiang River drainage[J]. Environmental Science, 2001, 22(2): 12-18.
    [23] Folk R L, Andrews P B, Lewis D W. Detrital sedimentary rock classification and nomenclature for use in New Zealand[J]. New Zealand Journal of Geology and Geophysics, 1970, 13(4): 937-968.
    [24] 尚飞. 鄂尔多斯盆地盒8期沉积模拟实验研究[D]. 荆州:长江大学,2012.

    Shang Fei. Study on sedimentation simulating experiment of He-8 period in Ordos Basin[D]. Jingzhou: Yangtze University, 2012.
    [25] 杨婷,康洪全,刘东旭,等. 北卡那封盆地沉积演化规律与烃源岩发育特征[J]. 西南石油大学学报(自然科学版),2017,39(5):81-91.

    Yang Ting, Kang Hongquan, Liu Dongxu, et al. The sedimentary facies evolution and the development characteristics of source rocks’ in North Carnarvon Basin, Australia[J]. Journal of Southwest Petroleum University (Science & Technology Edition), 2017, 39(5): 81-91.
    [26] 李中乔. 不同典型体系中陆源有机质的分布及影响因素[D]. 上海:华东师范大学,2015.

    Li Zhongqiao. The distribution and influencing factors of terrestrial organic matter in the typical systems[D]. Shanghai: East China Normal University, 2015.
    [27] 陈彬,胡利民,邓声贵,等. 渤海湾表层沉积物中有机碳的分布与物源贡献估算[J]. 海洋地质与第四纪地质,2011,31(5):37-42.

    Chen Bin, Hu Limin, Deng Shenggui, et al. Organic carbon in surface sediments of the Bohai Bay, China and its distribution to sedimentation[J]. Marine Geology & Quaternary Geology, 2011, 31(5): 37-42.
    [28] 蔡进功,曾翔,韦海伦,等. 从水体到沉积物:探寻有机质的沉积过程及其意义[J]. 古地理学报,2019,21(1):49-66.

    Cai Jingong, Zeng Xiang, Wei Hailun, et al. From water body to sediments: Exploring the depositional processes of organic matter and their implications[J]. Journal of Palaeogeography, 2019, 21(1): 49-66.
    [29] Pelejero C. Terrigenous n-alkane input in the South China Sea: High-resolution records and surface sediments[J]. Chemical Geology, 2003, 200(1/2): 89-103.
    [30] 李中乔,吴莹,李珍,等. 越南红河水下三角洲表层沉积物中有机物分布及来源分析[J]. 海洋与湖沼,2013,44(3):577-583.

    Li Zhongqiao, Wu Ying, Li Zhen, et al. Distribution and source of organic matter in the surface sediments from the red river subaquatic delta, Vietnam[J]. Oceanologia et Limnologia Sinica, 2013, 44(3): 577-583.
    [31] 朱纯,潘建明,卢冰,等. 长江口及邻近海域现代沉积物中正构烷烃分子组合特征及其对有机碳运移分布的指示[J]. 海洋学报,2005,27(4):59-67.

    Zhu Chun, Pan Jianming, Lu Bing, et al. Compositional feature of n-alkanes in modern sediment from the Changjiang Estuary and adjacent area and its implication to transport and distribution of organic carbon[J]. Acta Oceanologica Sinica, 2005, 27(4): 59-67.
    [32] 于培松,薛斌,潘建明,等. 长江口和东海海域沉积物粒径对有机质分布的影响[J]. 海洋学研究,2011,29(3):202-208.

    Yu Peisong, Xue Bin, Pan Jianming, et al. Impact of sediment grain size on the distribution of organic matter in Changjiang River Estuary and East China Sea[J]. Journal of Marine Sciences, 2011, 29(3): 202-208.
    [33] 吕艳美,葛晨东,高抒,等. 长江口水下三角洲表层沉积物有机质分布特征[J]. 第四纪研究,2012,32(6):1132-1139.

    Yanmei Lü, Ge Chendong, Gao Shu, et al. Distribution patterns of organic matter in the surficial sediment over the Changjiang subaqueous delta[J]. Quaternary Sciences, 2012, 32(6): 1132-1139.
    [34] 邵锡斌,吴莹,胡俊,等. 颗粒态有机物在长江口及其邻近海域的夏季分布和影响因素初析[J]. 海洋与湖沼,2014,45(6):1288-1294.

    Shao Xibin, Wu Ying, Hu Jun, et al. Spatial variability of particulate organic matter in the Changjiang River Estuary and adjacent regions in summer[J]. Oceanologia et Limnologia Sinica, 2014, 45(6): 1288-1294.
    [35] Yanagi T, Takahashi S, Hoshika A, et al. Seasonal variation in the transport of suspended matter in the East China Sea[J]. Journal of Oceanography, 1996, 52(5): 539-552.
    [36] 石晓勇,张婷,张传松,等. 黄海、东海颗粒有机碳的时空分布特征[J]. 海洋环境科学,2011,30(1):1-6.

    Shi Xiaoyong, Zhang Ting, Zhang Chuansong, et al. Spatial and temporal distribution of particulate organic carbon in Yellow Sea and East China Sea[J]. Marine Environmental Science, 2011, 30(1): 1-6.
    [37] 胡文烨. 西北太平洋悬浮颗粒物的分布、组成及环境演变的初步研究[D]. 厦门:国家海洋局第三海洋研究所,2016.

    Hu Wenye. The distribution、composition and environmental evolution of suspended particulate matter in the northwest Pacific[D]. Xiamen: Third Institute of Oceanography, State Oceanic Administration, 2016.
    [38] Lamb A L, Leng M J, Mohammed M U, et al. Holocene climate and vegetation change in the Main Ethiopian Rift Valley, inferred from the composition (C/N and δ13C) of lacustrine organic matter[J]. Quaternary Science Reviews, 2004, 23(7/8): 881-891.
    [39] 张成君,张菀漪,樊荣,等. 湖泊环境早期成岩作用对沉积物中有机质C/N和碳同位素组成的影响[J]. 地球环境学报,2012,3(4):1005-1012.

    Zhang Chengjun, Zhang Wanyi, Fan Rong, et al. Early diagenesis impacting C/N and organic isotopic compositions in the lacustrince sediments[J]. Journal of Earth Environment, 2012, 3(4): 1005-1012.
  • 加载中
通讯作者: 陈斌, bchen63@163.com
  • 1. 

    沈阳化工大学材料科学与工程学院 沈阳 110142

  1. 本站搜索
  2. 百度学术搜索
  3. 万方数据库搜索
  4. CNKI搜索

Figures(19)  / Tables(3)

Article Metrics

Article views(122) PDF downloads(71) Cited by()

Proportional views
Related
Publishing history
  • Received:  2020-05-17
  • Revised:  2020-07-01
  • Accepted:  2021-07-30
  • Published:  2023-04-10

Sedimentary Simulation Experiment Study on the Distribution of Terrestrial Organic Matter in the Delta-shallow Sea Sedimentary System: A case study of the Yacheng Formation in the Yanan Sag, Qiongdongnan Basin

doi: 10.14027/j.issn.1000-0550.2021.085
Funds:

CNOOC 13th Five-Year Plan Oil and Gas Resources Evaluation Project YXKY-2018-KT-01

Oil and Gas Resources Evaluation of CNOOC Mineral Rights Area in the “13th Five-Year” National Oil and Gas Resource Evaluation Project 2017YQZYPJ0109

Abstract: Terrestrial organic matter plays an important role in the delta-shallow sea sedimentary system. More and more oil and gas exploration practices find the contribution of terrestrial organic matter in deep-water areas. In the Yacheng Formation of the Qiongdongnan Baisn, the source rocks are dominated by terrestrial organic matter, which has attracted the attention of many scholars. However, due to the deep buried depth of the source rock and the lake in the deep-water area, the research and exploration progress of the source rock in this area is greatly restricted. Based on the geological background of the Yacheng Formation in the Yanan Sag, Qiongdongnan Basin, this study designed a flume experiment of terrestrial organic matter, which is a “forward modeling” method, to observe the deposition process of terrestrial organic matter and sample the sedimentation results. Particle size and total organic carbon (TOC) analyses were carried out on the samples, establishing a terrestrial organic carbon content prediction model through a large amount of analytical test data and applying the model to an actual research area with less data. We combine the qualitative observation of the experimental process and quantitative calculation results to establish a terrestrial organic matter distribution pattern. The results show that the terrigenous organic matter is mainly deposited in the low-lying parts with a weak hydrodynamic force. From the source area to the deep water area, due to the interaction between the river and the sea water, the transport capacity of the river is reduced, and the organic carbon content increases obviously in the shallow water. In a certain range of the shallow water area, due to the gradual decline of river transport capacity, organic carbon content decreased. Using the change of sediment grain size to reflect the hydrodynamic conditions, the correlation between hydrodynamic conditions and transport organic carbon content was explored, and the changing trend of terrigenous organic carbon content was predicted. This is consistent with the distribution characteristics of terrigenous organic matter in modern estuarine sediments. According to the prediction, for Experiment 1 (slope 3°-5°), the longest distance of terrigenous organic matter transport is 6.66 m, and the maximum of terrigenous organic carbon content is 4.4 m; for Experiment 2 (slope 1°-3°), the maximum distance of terrigenous organic matter transport is 6.00 m, and the maximum content of terrigenous organic carbon is 4.12 m; for the Yacheng Formation (slope < 0.1°), the maximum transport distance of terrigenous organic matter is 47.7 km, and the maximum content of terrigenous organic carbon is at 30 km. With the decrease of the paleotopography slope, the maximum transport distance of terrigenous organic matter also decreases, and the high value area of organic carbon content migrates to the source direction. The dominant distribution area of terrigenous organic matter is near the delta front shallow sea area. Based on the observation of the experimental process and the prediction of the changing trend of terrigenous organic carbon content, a single source "single peak" terrigenous organic matter distribution model map was established. In the delta plain area, the organic carbon content was mainly controlled by the growth and enrichment of in-situ organisms, which was the main control area of in-situ organic carbon. In the delta front littoral shallow sea area, terrigenous organic matter is deposited in large quantities, and its contribution may exceed that of shallow sea organisms, which is the main control area of terrigenous organic carbon. In the coastal shallow sea deep sea area, marine organisms are the main suppliers of organic matter, which is the main control area of marine organic carbon. The main control area of terrigenous organic carbon is the most favorable area for the development of terrigenous marine source rocks. With multi-source intersection, the distribution characteristics of terrigenous organic matter are superimposed for a single source, and the terrigenous organic carbon content in the source intersection area will be higher than that of a single source supply, which can also be used as the dominant area for the development of terrigenous marine source rocks. Using the first mock exam, we can predict the distribution of organic carbon for the Yancheng Formation in the Yanan Sag. The source of the northwest part of the Yanan Sag can transport the organic matter 47.7 km, that is, the transported organic matter can be transported to the center of the depression. The content of terrigenous organic carbon gradually increased from well Y1 to the center of the depression, and reached the maximum at well Y4. Since then, the content of terrigenous organic carbon gradually decreased to the center of the depression. The content of terrigenous organic carbon rapidly decreased from well Y6 to 0 in the center of the depression. This method can also be used to predict the distribution of terrigenous organic matter in other deep-water basins.

QU Tong, GAO Gang, XU XinDe, HUANG ZhiLong, GAN Jun, LIANG Gang, YOU JunJun. Sedimentary Simulation Experiment Study on the Distribution of Terrestrial Organic Matter in the Delta-shallow Sea Sedimentary System: A case study of the Yacheng Formation in the Yanan Sag, Qiongdongnan Basin[J]. Acta Sedimentologica Sinica, 2023, 41(2): 584-600. doi: 10.14027/j.issn.1000-0550.2021.085
Citation: QU Tong, GAO Gang, XU XinDe, HUANG ZhiLong, GAN Jun, LIANG Gang, YOU JunJun. Sedimentary Simulation Experiment Study on the Distribution of Terrestrial Organic Matter in the Delta-shallow Sea Sedimentary System: A case study of the Yacheng Formation in the Yanan Sag, Qiongdongnan Basin[J]. Acta Sedimentologica Sinica, 2023, 41(2): 584-600. doi: 10.14027/j.issn.1000-0550.2021.085
  • 三角洲—浅海沉积体系作为同时接受陆源碎屑和海洋物质输入的特殊体系,同时具有陆源有机质和海洋有机质。近年来,随着我国东南沿海盆地、西非、澳大利亚、东南亚陆缘盆地等深水区油气勘探开发研究的推进[1-5],三角洲—浅海沉积体系陆源有机质对油气的贡献越来越受到重视。由于深水区烃源岩埋深大,且钻遇井少,因此对于陆源有机质分布规律的研究十分困难。现有的关于陆源有机质分布特征的研究主要集中在现代入海河口沉积[6-9],对古代三角洲—浅海沉积体系陆源有机质分布的研究相对较少。李丹等[5]通过少量统计数据对澳大利亚北卡那封盆地中上三叠统Mungaroo组陆源有机质分布特征进行了分析,但并未对其分布规律及分布模式进行研究。

    将今论古是地球科学研究中常用的方法之一,沉积模拟实验便是通过现代沉积的实验室模拟进行地质沉积研究的一种实验手段,该方法在砂体沉积过程、分布规律及优势储层形成机理与预测方面已有较多应用,并取得了显著的成果[10-11]。本次研究首次尝试将沉积模拟实验应用于陆源有机质分布模拟研究,以崖南凹陷崖城组为原型地质模型,对陆源有机质搬运及沉积过程进行观察,并对最终沉积体进行取样分析,结合前人对现代河口沉积的相关研究,对陆源有机质分布特征进行分析,并建立分布模式。

  • 琼东南盆地位于南海北部海域,是重要的新生代含油气盆地,面积约3×10⁴ km2,可划分为北部坳陷、北部隆起、中央坳陷、南部隆起4个一级构造单元,进一步可划分为20多个二级构造单元(图1a)[12-15]。盆地以第三系和第四系沉积为主,经历了多期构造演化与沉积演化,自下而上可划分为始新统、渐新统崖城组和陵水组、中新统三亚组、梅山组和黄流组、上新统莺歌海组和第四系。始新统—渐新统崖城组沉积时期处于断陷期,新近纪—第四纪处于拗陷期。渐新世早期,主要为海陆过渡相沉积,之后逐渐转变为海洋沉积环境(图1b)[12-14]。渐新统崖城组是该盆地的主力烃源岩之一,崖城组沉积时期经历了一个水体由浅变深再变浅、沉积物由粗变细再变粗的完整层序演化过程。

    Figure 1.  (a) Geological map of the structural unit division in Qiongdongnan Basin (modified from Hu[15]); (b) stratigraphic development histogram of Qiongdongnan Basin (modified from Li et al.[12]; Li et al.[14])]; (c) structure and well location distribution of the Yanan Sag (modified from Wu et al.[18])

    崖南凹陷位于琼东南盆地西北部,崖城组陆源海相烃源岩是崖13-1气田的主要气源岩,因此,对崖城组陆源有机质分布规律及分布模式的研究尤为重要。现有研究表明,崖城组烃源岩以陆源有机质贡献为主,含少量或不含海洋有机质,陆源有机质是琼东南盆地深水区崖城组烃源岩形成的主要控制因素[16-17]。本次实验研究的模拟区位于崖南凹陷西部的崖13-1气田区,外形上为喇叭状,北部为崖城凸起,西部为崖13-1低凸起,东南方向为深水区[18]图1c)。研究区近物源处崖城组仅发育崖三段地层,崖一段及崖二段地层缺失,以辫状河三角洲沉积为主,向深水方向逐渐过渡为滨浅海沉积环境[19-21]。崖三段沉积时水体持续变深,古地形整体呈向东南方向倾斜的地貌,物源以北西向崖城凸起物源为主,沉积时期存在波浪和潮汐作用改造[20],近物源处坡度较陡,约0.1°,向深水方向平均坡度约为0.06°。

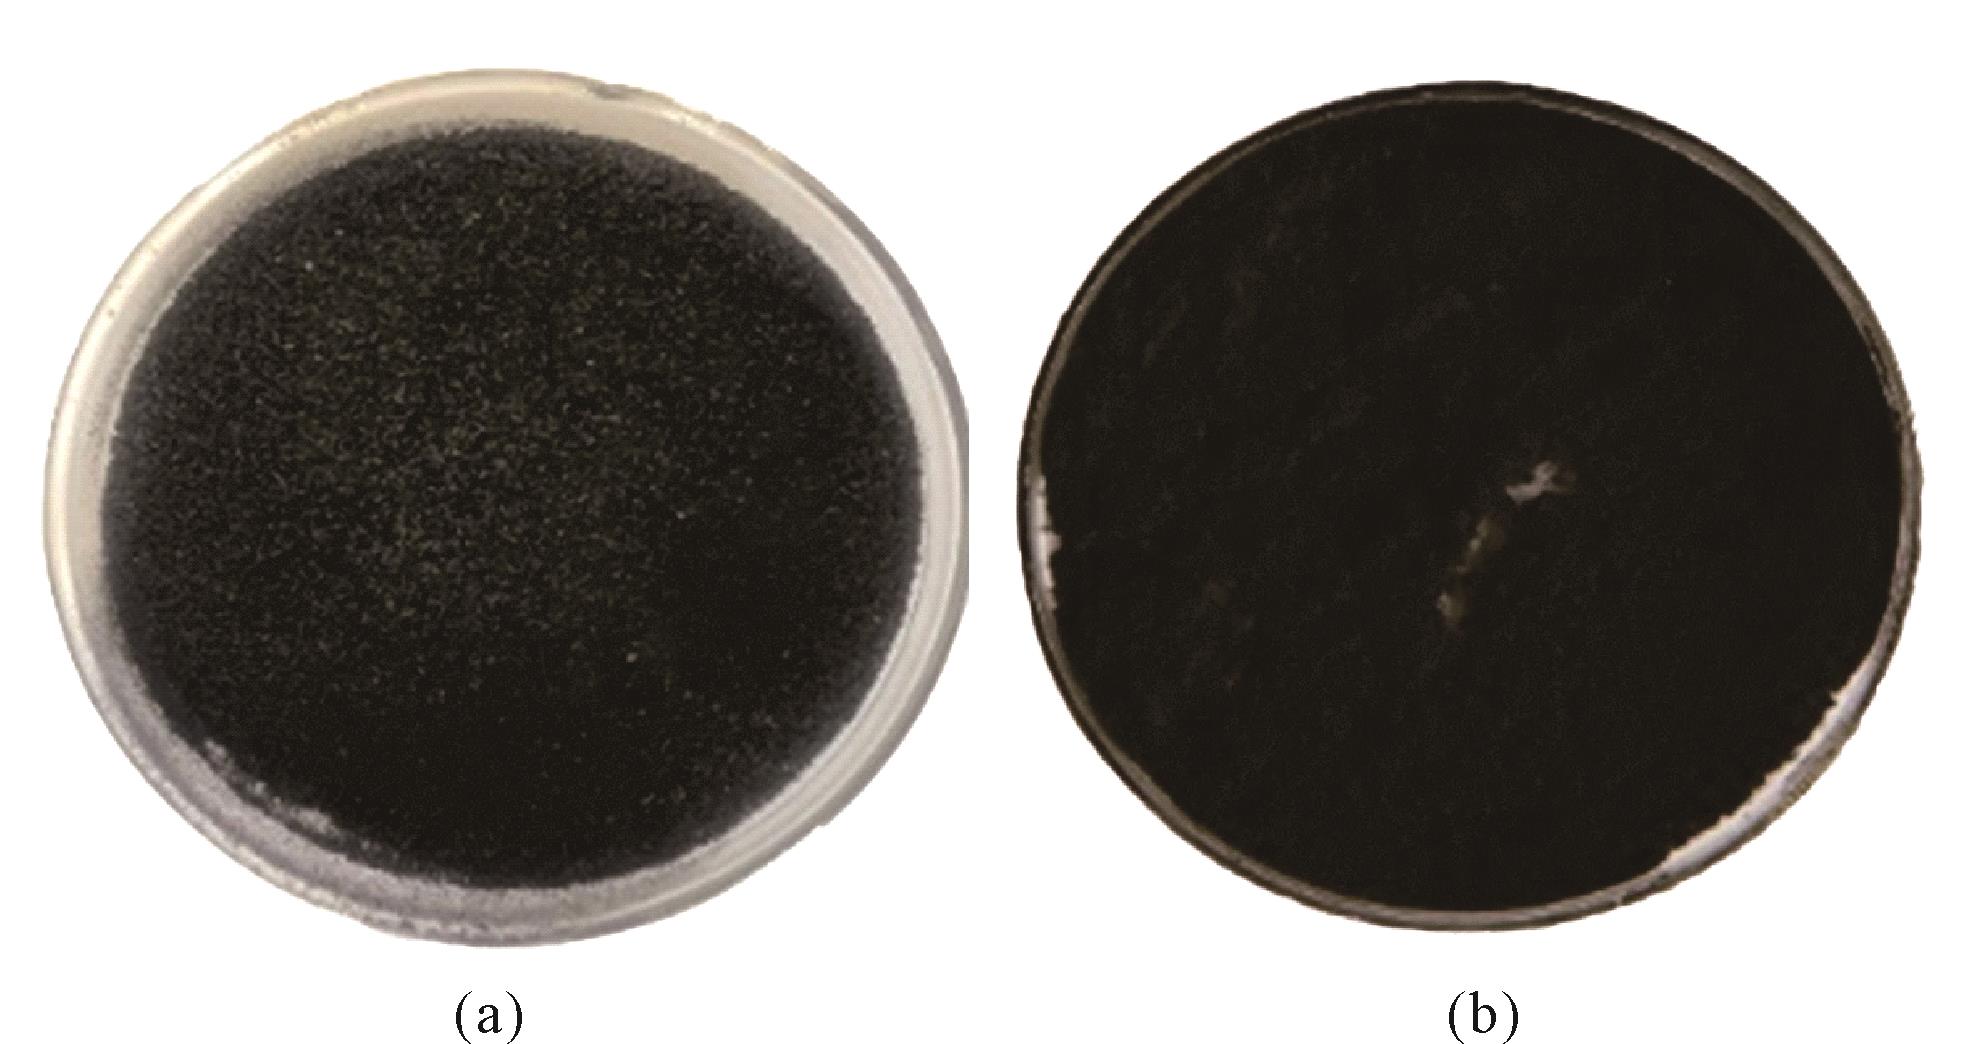
  • 实验所用有机质模拟材料需要同时满足两个基本条件:1)具有一定的有机质丰度;2)具有足够大的密度在水中能够自然沉降。经调研现代泥样、泥炭土、油页岩、褐煤、煤矸石等多种材料,综合实验地点及运输情况最终选用煤矸石作为有机质模拟材料。由于自然界陆源有机质供应可分为颗粒有机碳及溶解有机碳,其含量比例约为2∶3[22],为最大限度与自然规律相符,选用颗粒状煤矸石与粉末状煤矸石按2∶3混合作为有机质的实验材料(图2),煤矸石材料的各项基本参数见表1

    Figure 2.  Photos of granular (a) and powdered (b) coal gangue materials

    材料泥/%(<0.004 mm)粉砂/%(0.004~0.063 mm)细砂/%(0.063~0.250 mm)中砂/%(0.250~0.500 mm)粗砂/%(0.500~2.000 mm)砾石/%(>2.000 mm)TOC/%
    粉末状煤矸石37.38962.2560.35500014.70
    颗粒状煤矸石0.50716.97839.39821.08522.033011.21
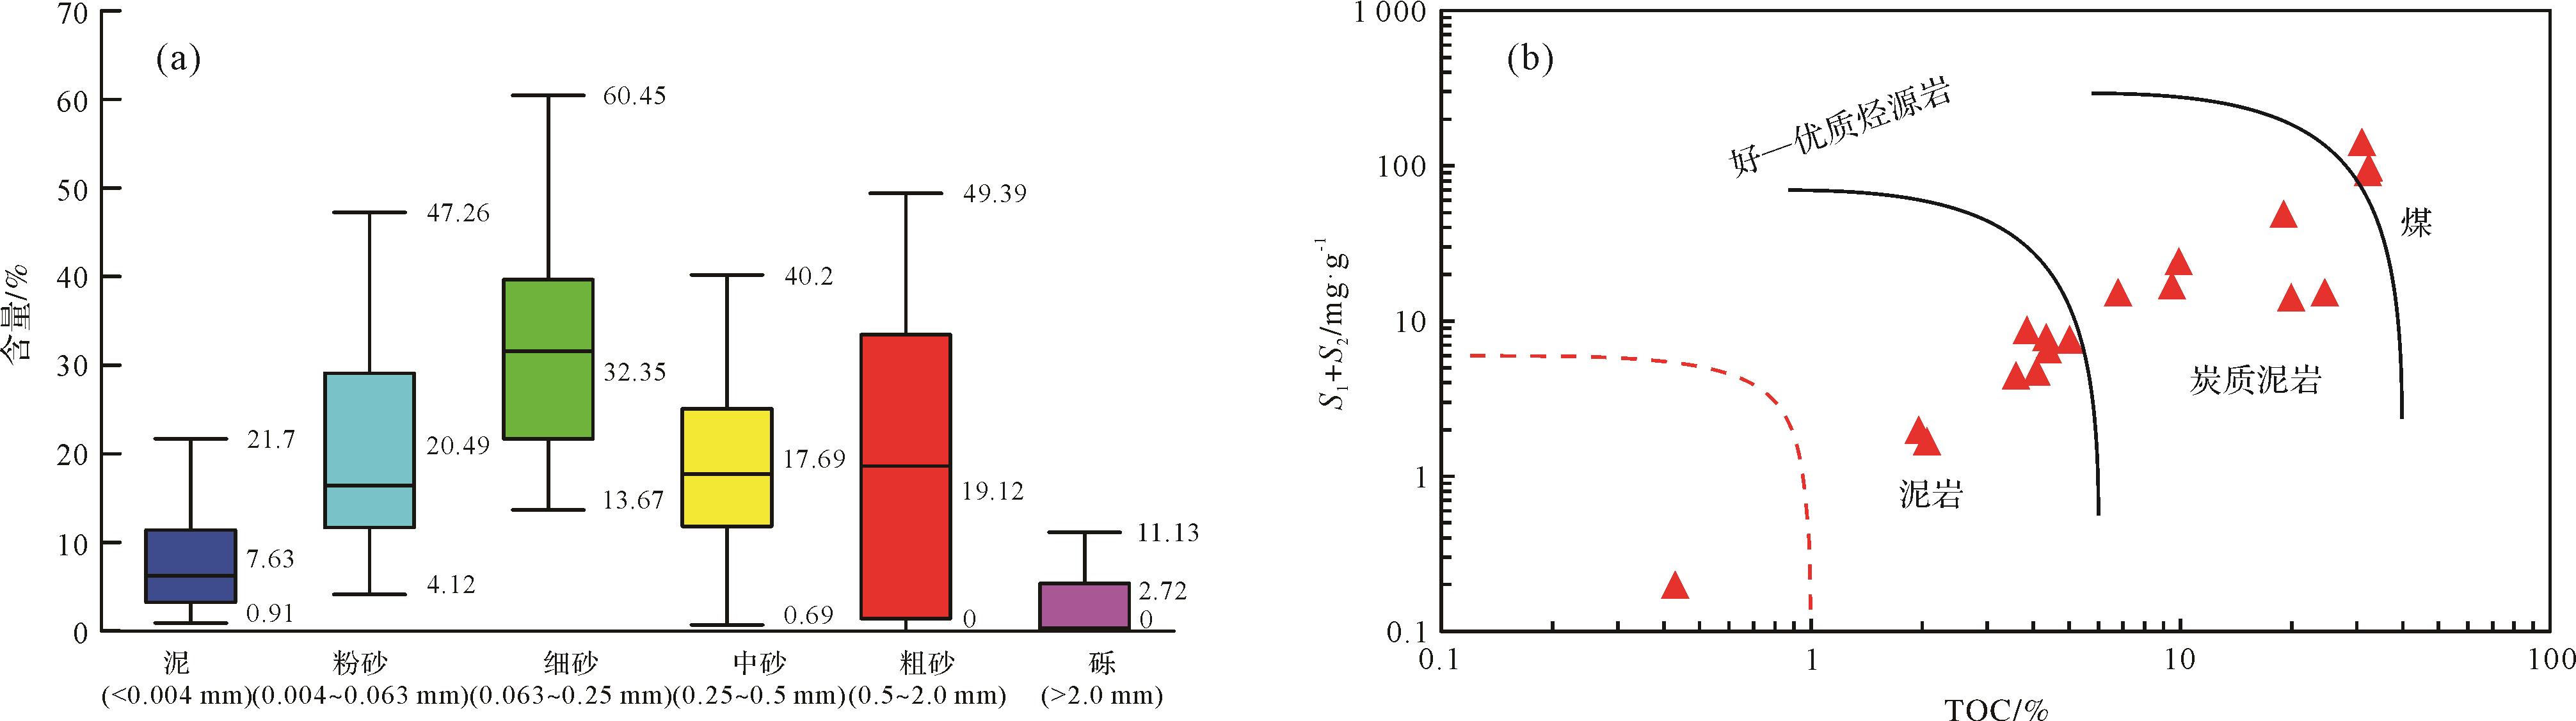
  • 由崖南凹陷已有钻井的取心及分析测试资料可得,崖城组沉积物粒度整体较粗,各粒级平均含量为:泥质含量7.63%,粉砂含量20.49%,细砂含量32.35%,中砂含量17.69%,粗砂含量19.12%,砾石含量2.72%(图3a)。崖城组烃源岩包括煤、炭质泥岩及泥岩,其中煤与炭质泥岩的形成与原地有机质有关,有机碳含量较高,实验条件下难以模拟,而深水区陆源有机质为搬运有机质,因此不在本次研究考虑范围之内,仅对崖13-1气田地区崖城组陆源海相泥岩沉积进行模拟。崖城组泥岩有机碳含量相对较低(图3b),泥岩有机碳含量平均约1.19%,有机质类型以II~III型为主,有机质成熟度达到成熟—高成熟阶段。

    Figure 3.  (a) Box⁃shaped statistic chart for the content distribution of samples in the Yacheng Formation; (b) relationship between total organic carbon (TOC) and S1+S2 of the Yacheng Formation

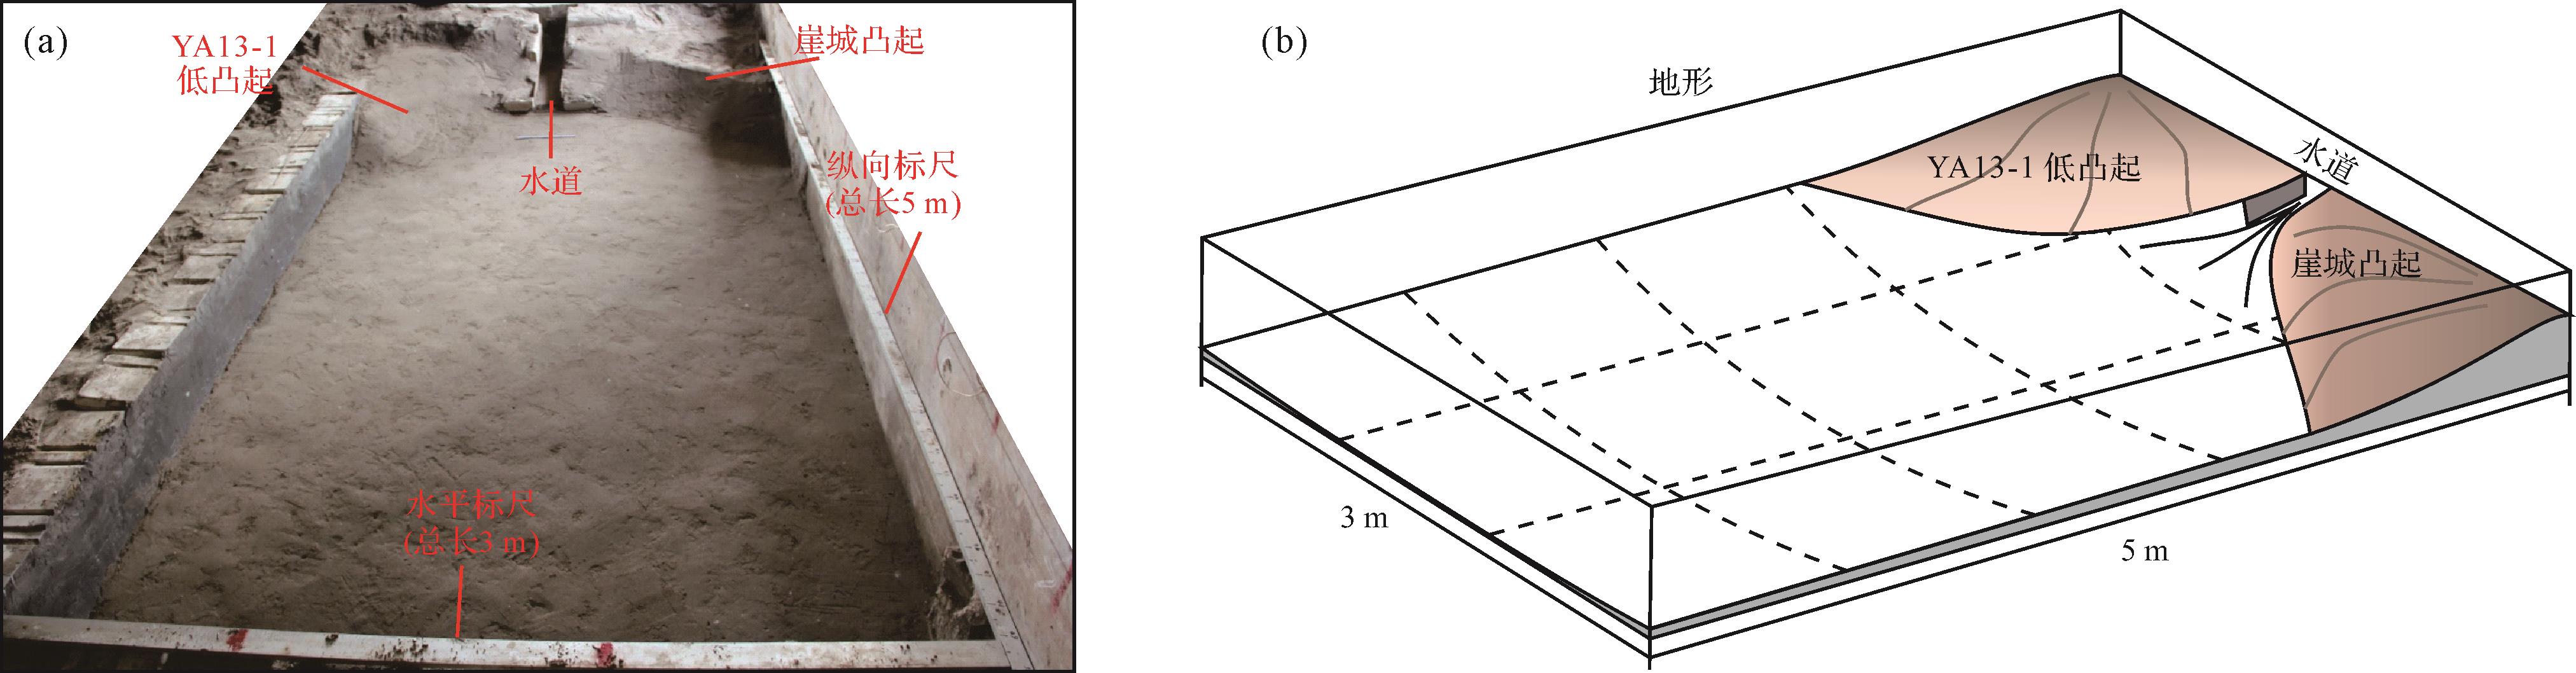
    本次研究以琼东南盆地崖南凹陷崖13-1气田区崖城组地质背景为实验原型,在长江大学湖盆沉积模拟实验室进行,实验设计遵循几何相似、动力相似、运动相似等相似准则[24]。根据实验装置实际情况,设置实验水槽有效范围为长5 m,宽3 m(图4),实验模拟的工区范围长50 km,宽30 km,几何比尺λL= LH/Lm≈10 000∶1(H代表原型,m代表沉积模型,L代表长度,m)。由于实际研究区古地形坡度极缓,在短时间实验条件下不利于三角洲沉积体的发育,因此分别设计底型坡度为1°~3°和3°~5°的两次坡度相对较陡的对比实验,与实际研究区进行不同坡度条件下的对比分析。两次实验仅坡度不同,其他条件均一致。

    Figure 4.  Photos (a) and schematic diagram (b) of the flume experimental device

    实验模拟辫状河三角洲沉积,按照研究区三级层序旋回将实验分为三期,为避免底型砂对实验砂的影响,在三期有机质沉积模拟之前增加一期三角洲底型的沉积,共四期沉积模拟,记为I,II,III,IV,其中I期不加入有机质,为三角洲底型沉积,II期开始加入有机质。自然界中供水期、中水期、枯水期的变化具有一定的规律,按照自然规律设计实验过程中的洪水期∶中水期∶枯水期持续时间为1∶3∶6[24],实验供水流量对应为6∶3∶1,物源供给量与供水量匹配为6∶3∶1,每一期均经历两次“中水期—洪水期—中水期—枯水期”持续性供水模式。根据研究区实际样品的各粒级平均含量确定实验砂的粒度配比,实验中有机质与沉积物配比根据崖城组泥岩有机碳平均含量进行配比,实验砂与煤矸石比例最终确定为6∶1,各沉积期物源粒度配比情况见图5。根据研究区崖三段持续海侵并伴随潮汐影响的特征,设计各实验期次水体整体上涨,并伴随着间断性水退。由于波浪作用对三角洲前缘沉积有明显的破坏作用,不利于煤系烃源岩的发育,而研究区崖城组发育煤层,因此研究区受波浪作用较弱,本次实验不考虑波浪影响。实验各项参数见表2

    Figure 5.  Grain size distribution of provenance in each sedimentary period

    时期流量/L·s-1加沙量/g·s-1加砂组成/%历时/h水深/cm
    洪水期中水期枯水期
    中粗细粉中粗细粉中粗细粉
    I1.5~1.80.45~0.70.1~0.34.5~61~2.00.5~1105035554545554045104813
    II1.5~1.80.45~0.70.1~0.34.5~61~2.00.5~11050355104540554045104812
    III0.9~1.20.4~0.50.05~0.24~51~1.50~0.55503510050401004545154814
    IV0.9~1.20.4~0.50.05~0.24~51~1.50~0.55503510045451004045154817

    实验过程中,对有机质搬运与富集过程进行观察,对最终沉积体进行切片精细刻画和采取样品,并对取样位置坐标、层位、特征等信息进行记录,采取样品234样次,其中实验一(坡度3°~5°)163样次,实验二(坡度1°~3°)71样次。对样品分别进行粒度分析和总有机碳含量测定,粒度分析由Malvern Mastersizer3000型激光粒度仪测定,有机碳含量由Leco-CS-230碳硫分析仪测定。

  • 通过观察沉积模拟实验过程发现,由三角洲平原向前缘方向,陆源有机质富集程度明显增加(图6a,b),三角洲平原近物源区有机质沉积较少,远离物源方向的三角洲前缘存在明显的有机质富集带(图6a)。在水流直接流经的河道部位,有机质以沉积过路作用为主,而在河道两侧的河漫部位明显富集(图6b),这是由于河流水动力在远离物源方向上逐渐损耗减弱,使得三角洲前缘部位更易富集有机质,而河漫部位水流呈漫溢流动状态,水动力环境较弱,相对更易富集有机质。值得注意的是,在沉积过程中河道不断摆动,早期河漫部位已沉积的有机质在后期河道改道时会被后期河道冲刷破坏(图6c)。三角洲平原地区常存在砾石,水流越过砾石时会对背水面下切形成地势低洼区(图6d),这些地势相对较低的冲沟在后期沉积过程中处于相对闭塞的环境,有利于有机质的沉积和保存。综上所述,陆源有机质主要沉积于水动力较弱、地势较低的部位。

    Figure 6.  Photos of organic matter deposition process

  • 对实验所采的234个样品分别进行粒度分析及TOC测定,实验结果见表3。粒度分析测试结果显示,两次实验粒度中值与物源距离的相关性均较强。坡度较缓时,水动力环境相对较弱,粒度衰减速率较快,顺物源方向上三角洲延伸距离较短,在海平面以下,泥质含量向浅海方向迅速增大(图7)。

    参数实验一(坡度3°~5°)实验二(坡度1°~3°)
    三角洲平原三角洲前缘前三角洲—浅海三角洲平原三角洲前缘前三角洲—浅海
    泥/%(<0.004 mm)0~14.0660.202[85]0~0.5240.084[28]0~62.61543.875[50]0~0.4860.050[40]0~1.8320.146[16]19.862~74.02550.683[15]
    粉砂/%(0.004~0.063 mm)0~40.2733.658[85]0~16.1614.448[28]1.486~49.15141.173[50]0~23.6096.246[40]1.167~43.3109.223[16]25.307~56.90841.866[15]
    细砂/%(0.063~0.250 mm)2.708~72.52627.348[85]5.508~62.88537.491[28]1.892~39.5556.715[50]2.289~50.53226.672[40]4.386~49.92330.984[16]0.668~15.8814.519[15]
    中砂/%(0.250~0.500 mm)11.009~62.64640.651[85]16.962~56.97944.799[28]0~24.2942.526[50]8.374~56.54339.907[40]8.510~52.83737.543[16]0~5.7861.495[15]
    粗砂/%(0.500~2.000 mm)0.174~66.04825.709[85]1.914~52.38312.247[28]0~27.0654.249[50]3.547~67.38823.544[40]0.519~63.11920.366[16]0~5.3721.352[15]
    砾/%(>2.000 mm)0~15.9212.432[85]0~14.6060.932[28]0~24.6661.463[50]0~26.6143.580[40]0~11.8571.738[16]0~0.6750.085[15]
    TOC/%0.04~1.990.46[85]0.22~1.670.81[28]1.48~2.962.50[50]0.26~3.080.92[40]0.22~2.320.79[16]2.40~3.212.79[15]
    注:0~14.066/0.202[85]指最大值~最小值/平均值[样品数量]。

    Figure 7.  Variation of sediment grain size median with transportation distance

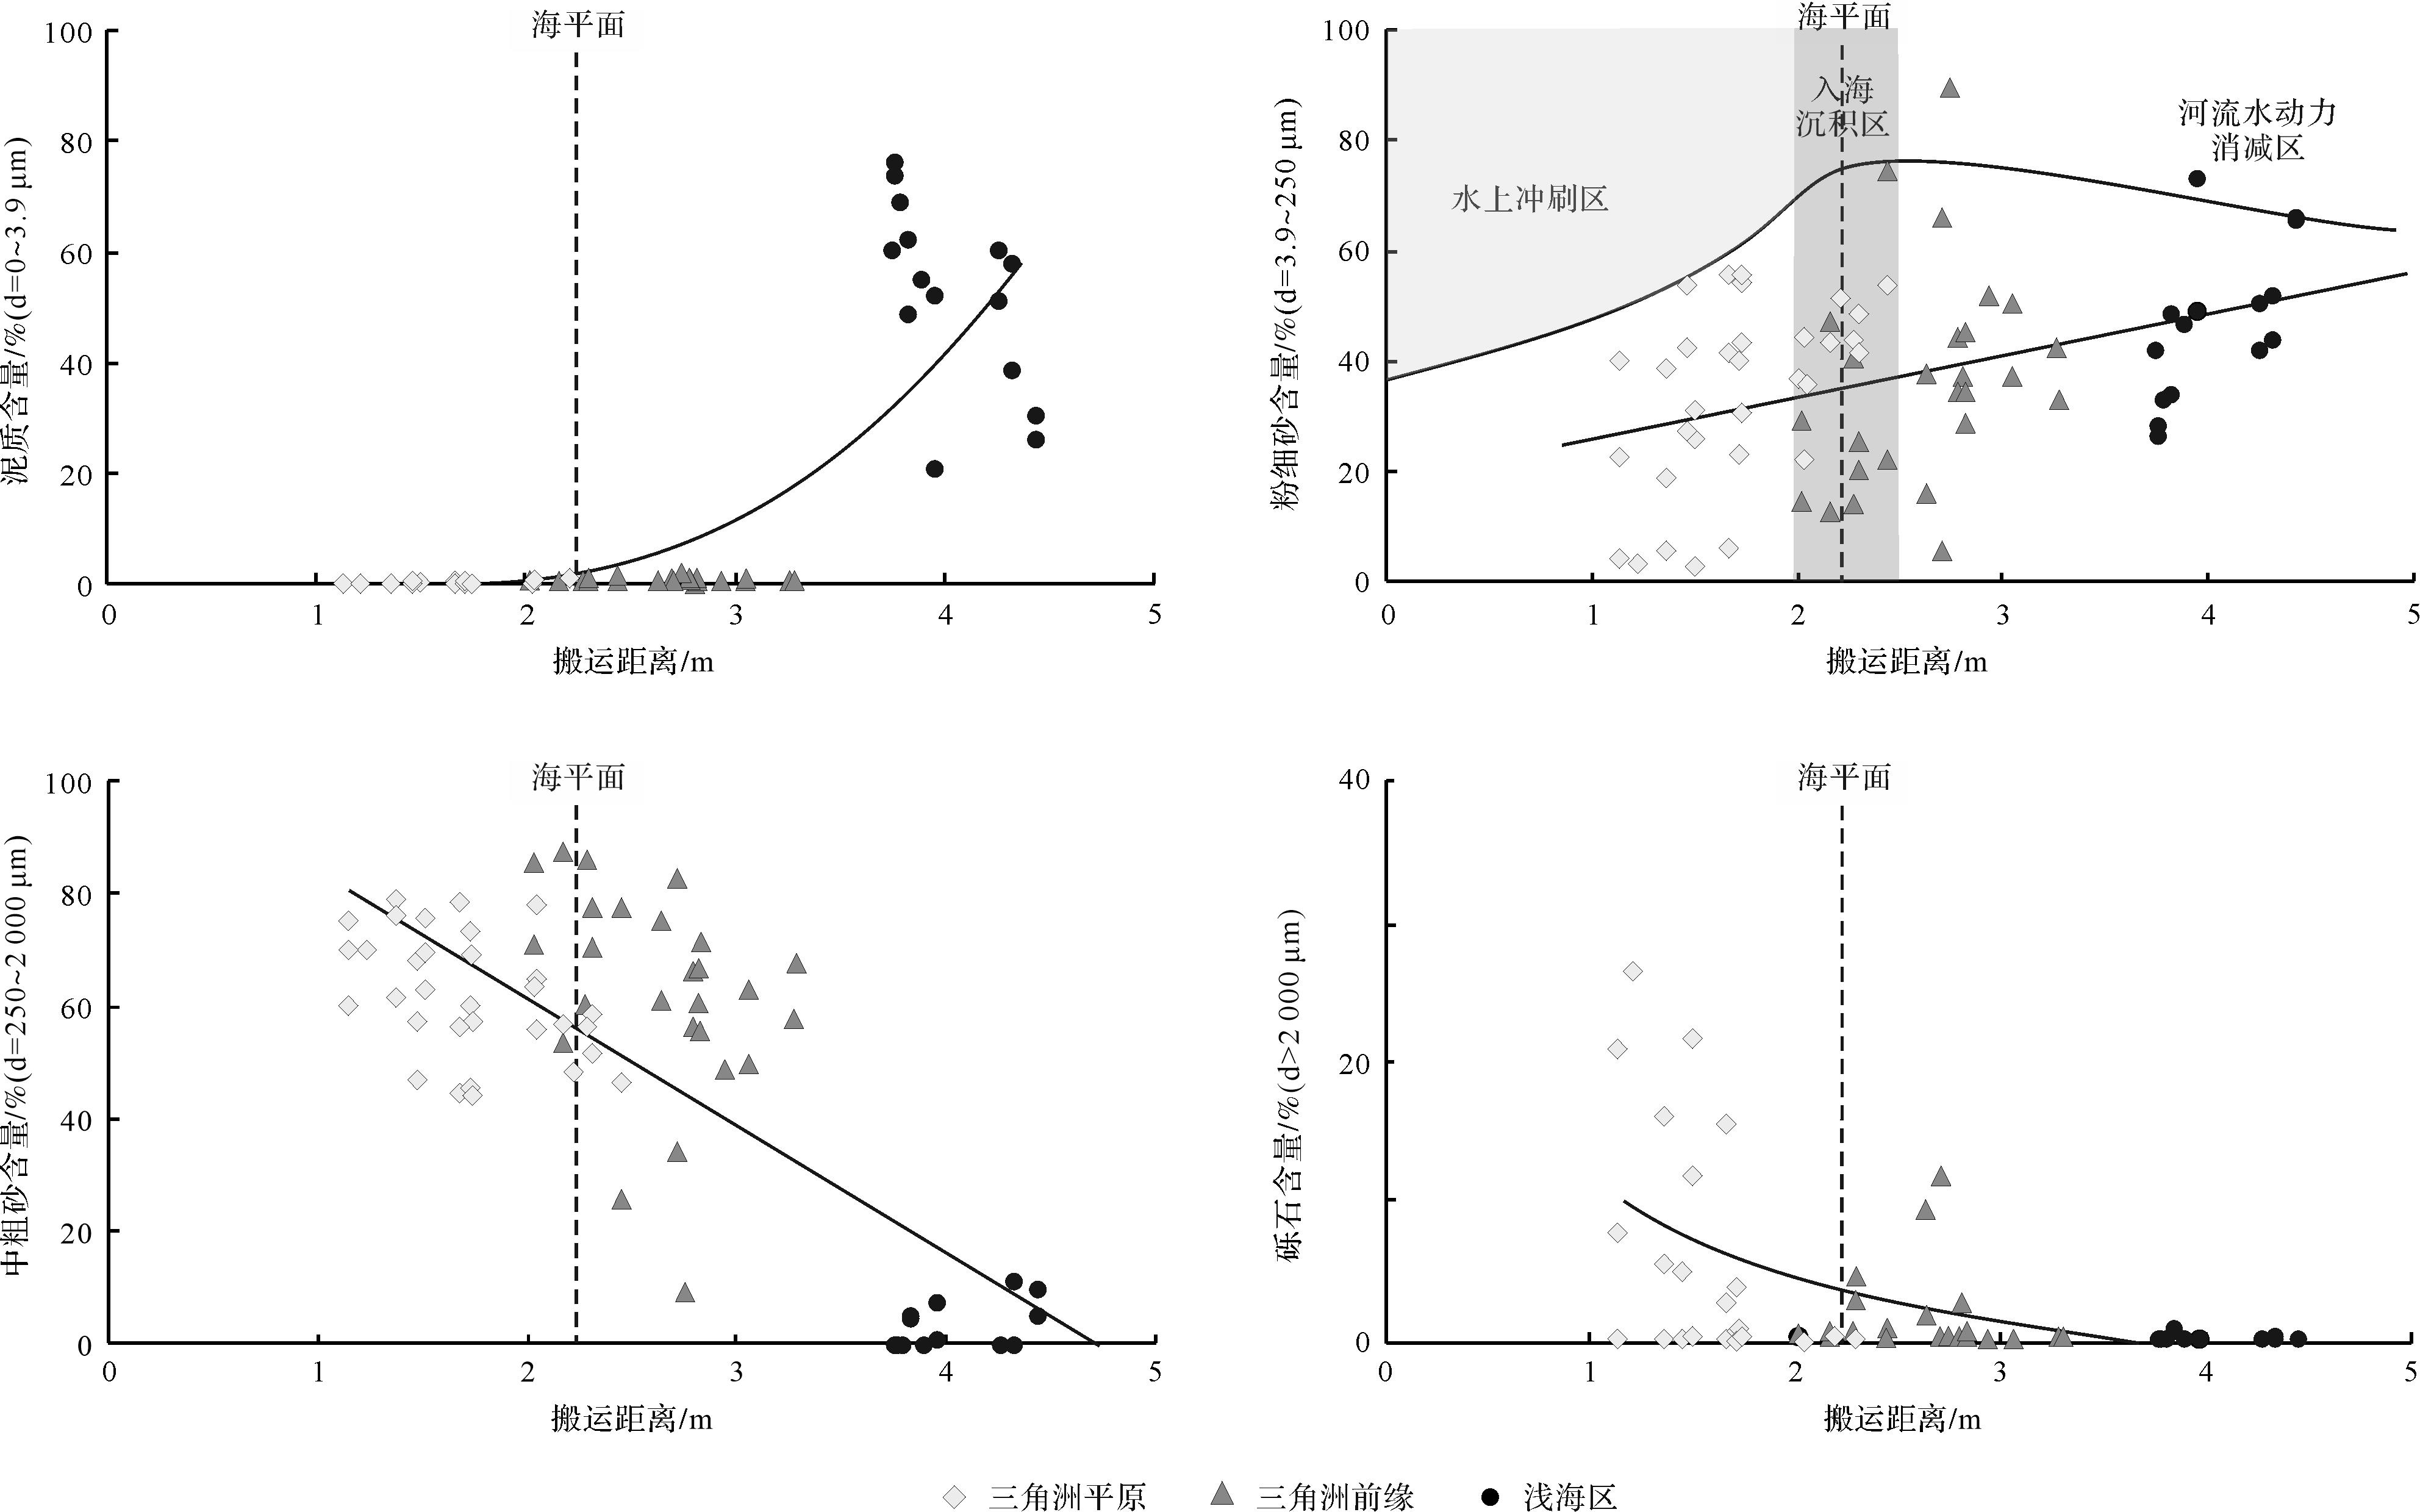
    两次实验均显示,泥质沉积物含量随搬运距离的增加而增加,中—粗砂及砾石含量均随搬运距离的增加而减少,而粉—细砂含量随搬运距离的增加呈先增大后减小的趋势。当沉积物粒径增大超过河流的运载力时,随搬运距离的增加其含量便会减少,粉—细砂含量随搬运距离开始呈增大趋势,表明河流运载能力足以搬运该粒级沉积物,而当河流与海水交锋之后,粉—细砂含量开始呈现减小趋势,表明衰减后的河流运载力开始无法搬运该粒级沉积物。因此,河流运载力的临界粒度处于粉—细砂粒径范围内,使得其变化呈先增后减的趋势(图8,9)。

    Figure 8.  Variation of each particle level for sediments with a transportation distance at a slope of 3°⁃5°

    Figure 9.  Variation of each particle level for sediments with a transportation distance at a slope of 1°⁃3°

    TOC分析测试数据显示,有机碳含量向浅海方向呈明显增大的趋势,这是由于河流入海后,与海水交锋极大地减小了河流的搬运能力,有机质随沉积物大量堆积,使得三角洲前缘区域有机碳含量会迅速增大。在超出浅海区一定范围,有机碳含量出现了减小趋势,这是由于河流搬运能力逐渐衰减所致(图10)。

    Figure 10.  Relationship between TOC content and transport distance of sediments

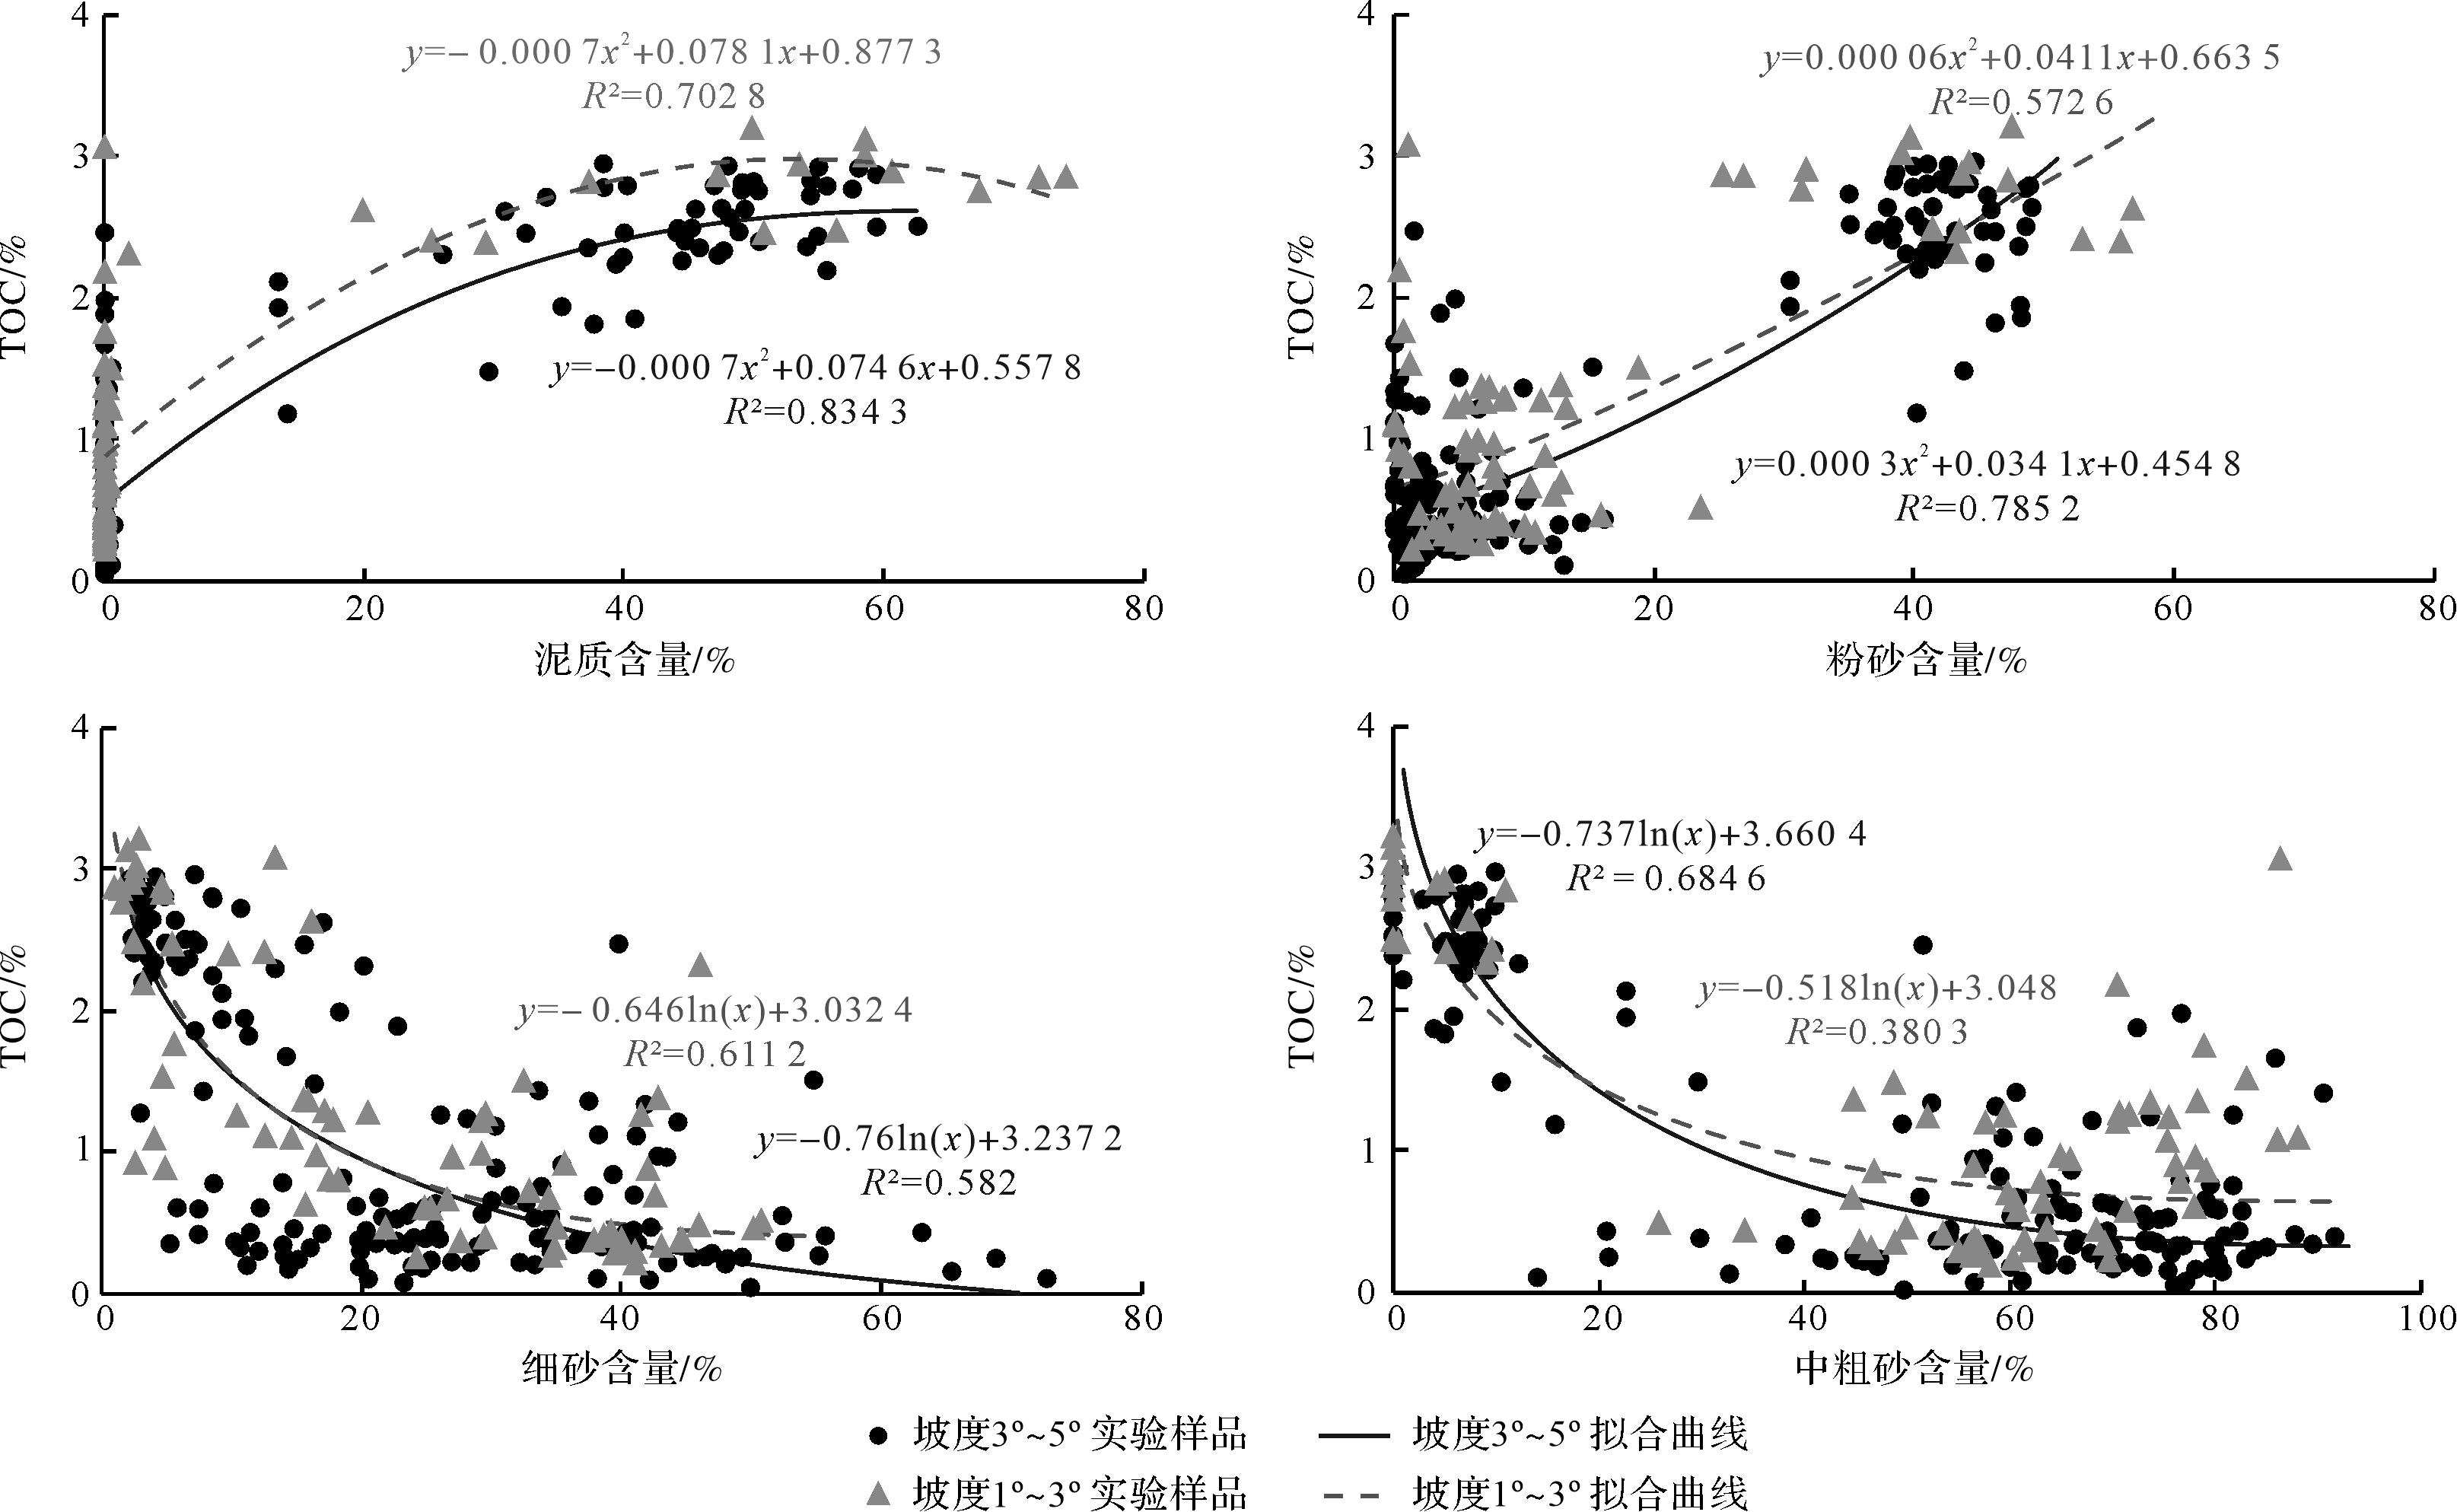
  • 河流流动过程中,水流能量会由于能量的损耗或转换而减小或增大,水流能量的改变使得其自身运载能力也相应改变,沉积物粒度的配比也相应改变,因此沉积物粒度配比的变化是水动力条件变化的最直观的反映。陆源有机质与物源一起随河流搬运,水动力条件也控制着陆源有机质的搬运与沉积,因此陆源有机碳含量与粒度参数之间必然存在某种联系。经拟合发现,泥质含量、粉砂含量、细砂含量及中粗砂含量与TOC均具有较好的相关性(图11)。

    Figure 11.  Relationship between TOC content and sediment grain size content

    基于泥质含量、粉砂含量、细砂含量及中粗砂含量与TOC的相关性,对各个组分含量与有机碳含量进行多元线性回归得到预测关系式:

    TOC=b+a1Cm+a2CS+a3Cf+a4Cme (1)

    式中:TOC为陆源有机碳含量,%;Cm为泥质含量,%;CS为粉砂含量,%;Cf为细砂含量,%;Cme为中粗砂含量,%;a1,a2,a3,a4,b均为常量系数。

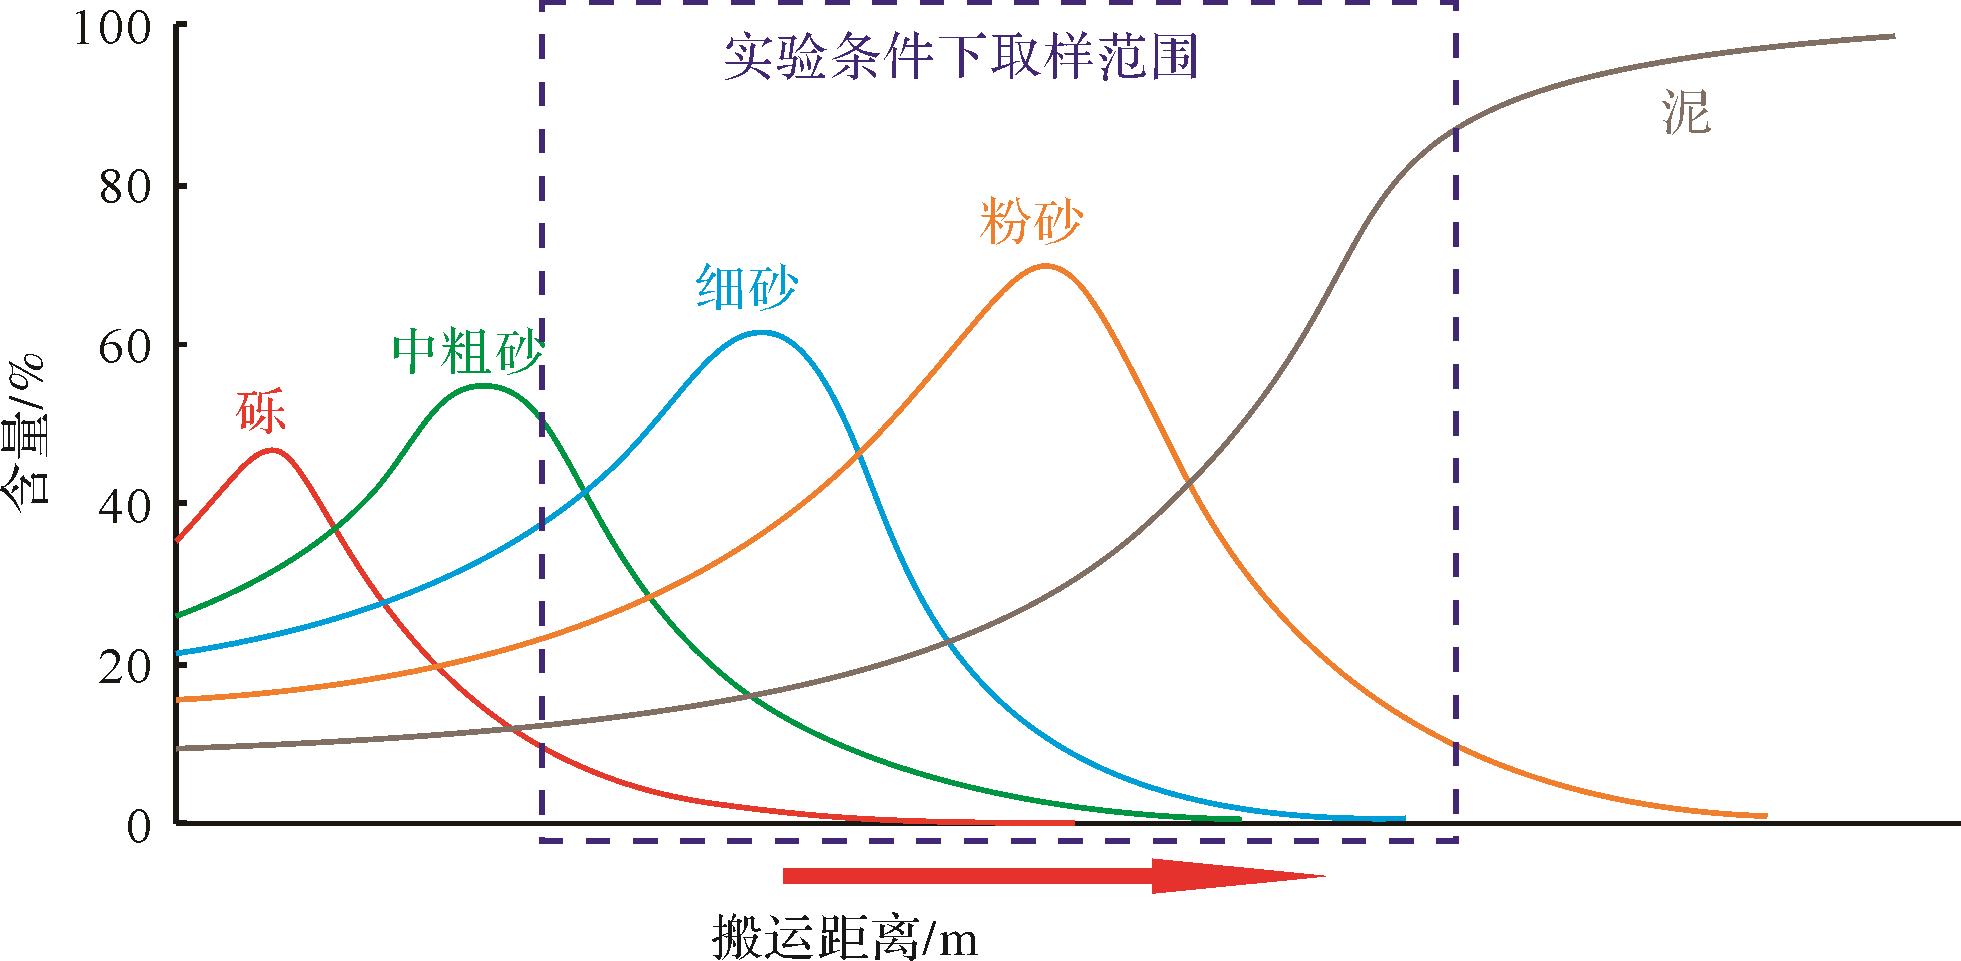
    在深水无钻井区缺少粒度资料使得式(1)无法使用。随搬运距离的增加,水动力环境整体上呈规律性变化,相应的沉积物粒度组成配比也呈规律性渐变。为了得到深水无钻井区陆源有机质的变化趋势,根据各个粒级组分含量与搬运距离的关系,建立各个粒级随搬运距离变化的关系式,与式(1)联立即可建立TOC与搬运距离之间的关系。因此对各个粒级组分含量随搬运距离变化的函数选择至关重要。在理想状态下,各粒级颗粒依次沉积(图12),泥质含量随搬运距离的增加呈缓慢增长—快速增长—缓慢增长的过程,泥质含量采取模型为50%含量以下为指数函数增长关系,泥质含量大于50%时,增长关系为与50%含量点呈中心对称的关系式(图13a);中粗砂含量采取模型为二次函数,拟合效果较好(图13b);但粉细砂粒级范围内由于存在河流运载力的临界值(图8,9),使得粉砂含量、细砂含量与搬运距离的拟合效果较差,经过拟合发现,粉砂含量与泥质含量相关性较高,细砂含量与中粗砂含量相关性较高(图13c,d),因此得到方程组式(2)。通过式(2)即可得到陆源有机质随物源距离的变化趋势。

    Figure 12.  Schematic diagram of the sedimentary sequence in its ideal state

    Figure 13.  Relationship between sediment particle content and transport distance

    TOC=b+a1Cm+a2CS+a3Cf+a4CmeCm=n1en2x,0<x<x0;Cm=100-n1en2(2x0-x),0<x<x0CS=n3Cm2+n4Cm+n5Cf=n6Cme2+n7Cme+n8Cme=n9x2+n10x+n110  C* 100;0  C* 100 (2)

    式中:TOC为陆源有机碳含量,%;Cm为泥质含量,%;CS为粉砂含量,%;Cf为细砂含量,%;Cme为中粗砂含量,%;x为搬运距离;C*为各粒级含量,%;∑C*为各粒级含量之和,%;a1,a2,a3,a4,b,n ii=1,2,…,11)均为常量系数。

    通过模型式(2)分别对两次实验及崖南凹陷的陆源有机碳含量变化趋势进行预测(图14)。结果表明陆源有机碳含量随搬运距离的增加呈先增大后减小的变化趋势,这与诸多学者在对现代入海河口沉积中陆源有机质的分布特征是一致的,在近物源区通常由于水动力环境过强使得陆源有机质难以保存,但阵发性洪水导致沉积物快速堆积也可使得陆源有机碳含量相对较高。实验一(坡度3°~5°)时陆源有机质搬运最远距离6.66 m,陆源有机碳含量在4.40 m处达到最大值(图14a);实验二(坡度1°~3°)陆源有机质搬运最远距离6.00 m,陆源有机碳含量在4.12 m处达到最大值(图14b);崖城组(坡度<0.1°)陆源有机质搬运最远距离47.7 km,陆源有机碳含量在30 km处达到最大值(图14c)。将实际研究区按比例缩小后进行对比,随古地形坡度的减小,陆源有机质最大搬运距离也在减小,有机碳含量高值区向物源方向迁移,陆源有机质优势分布区域位于三角洲前缘—浅海区域附近(图14d)。两次实验条件下,地形坡度不同、供水量相同,陡坡度条件下重力在物源搬运方向的分力更大,使得水流流速更大(即水动力环境更强),同时沉积物可以搬运更远的距离,因此,随古地形坡度的减小,陆源有机质最大搬运距离减小这一规律,是古地形和水动力环境共同控制的结果。

    Figure 14.  Prediction results and comparison chart of terrigenous organic carbon content in the experiment and Yacheng Formation

  • 关于地质历史时期沉积地层中陆源有机质分布规律的研究相对较少,主要集中在对澳大利亚北卡那封盆地中上三叠统Mungaroo组三角洲的研究[5,25],李丹等[5]将Mungaroo组三角洲划分为近端三角洲平原、远端三角洲平原、三角洲前缘、前三角洲4个沉积亚相,陆源有机碳含量平均为1.59%、4.11%、1.05%和1.16%(图15),陆源有机碳含量整体呈先增大后减小的趋势,与上述预测模型分析结果一致。与实验和崖城组分析结果不同的是,陆源有机碳含量在远端三角洲平原出现了最高值,这可能主要由两方面原因导致。一方面北卡那封盆地上三叠统沉积时期受三叠纪环特提斯洋巨型季风的影响,阵发性洪水频发,冲散了块状陆源有机质使得泥岩中多含炭屑,从而导致煤层相对发育的远端三角洲平原的暗色泥岩陆源有机碳含量偏高;另一方面可能是由于烃源岩岩性划分标准的差异,在近端三角洲平原和远端三角洲平原暗色泥岩陆源有机碳含量最高可达18%和26.8%,这类泥岩实际上应该属于炭质泥岩范畴,统计方法的不同使得陆源有机碳含量的高值区位置有差异。此外,这一差异还与后期成岩演化过程中的保存条件有关。

    Figure 15.  Distribution pattern of terrigenous organic matter in the delta of the Mungaroo Formation in the North Carnarvon Basin (modified from Li et al.[5])

    学者们对现代入海河口表层沉积物的陆源有机质分布特征有大量研究[7-9,22,26-28]。珠江口表层沉积物中陆源有机质表征参数正构烷烃C29含量呈现出向远离河口区方向先增大后减小的规律,在远离河口一定距离处出现陆源有机质含量的最高值[29]图16a,b);红河水下三角洲表层沉积物中陆源有机质表征参数木质素∑8含量也出现同样的趋势[30]图16c,d);在我国渤海湾、南黄海、长江口及珠江口等河口区,表层沉积物陆源有机质分布总体上均呈现向海方向含量先增高后降低的趋势[9,27,29,31-34],均与实验分析结果一致。此外,潮汐、波浪、沿岸流等对陆源有机质的分布有控制和改造作用[31,35-37]

    Figure 16.  Change pattern of indicator parameters for terrestrial organic matter in modern estuaries

    已有研究表明,陆源有机质在沉积埋藏之后,相当一部分有机质会发生降解[26,38-39],但埋藏作用过程中陆源有机质的变化规律尚无深入研究。对比地质地层三角洲沉积体系与现代河口沉积的陆源有机质分布特征可得,两者变化趋势大致相似,因此认为埋藏作用对有机质的降解不会改变陆源有机质总体的分布规律。综合实验和崖城组陆源有机质分布预测结果及前人研究成果认为,远离物源方向,陆源有机质呈先增后减的趋势。在没有潮汐、波浪、沿岸流等水动力影响时,陆源有机碳峰值区位于三角洲前缘—浅海区附近;当受到其他类型水动力影响时,陆源有机碳峰值区会向物源方向发生迁移,同时海平面以下陆源有机质遭受冲刷破坏使得其含量降低,但分布范围更广。

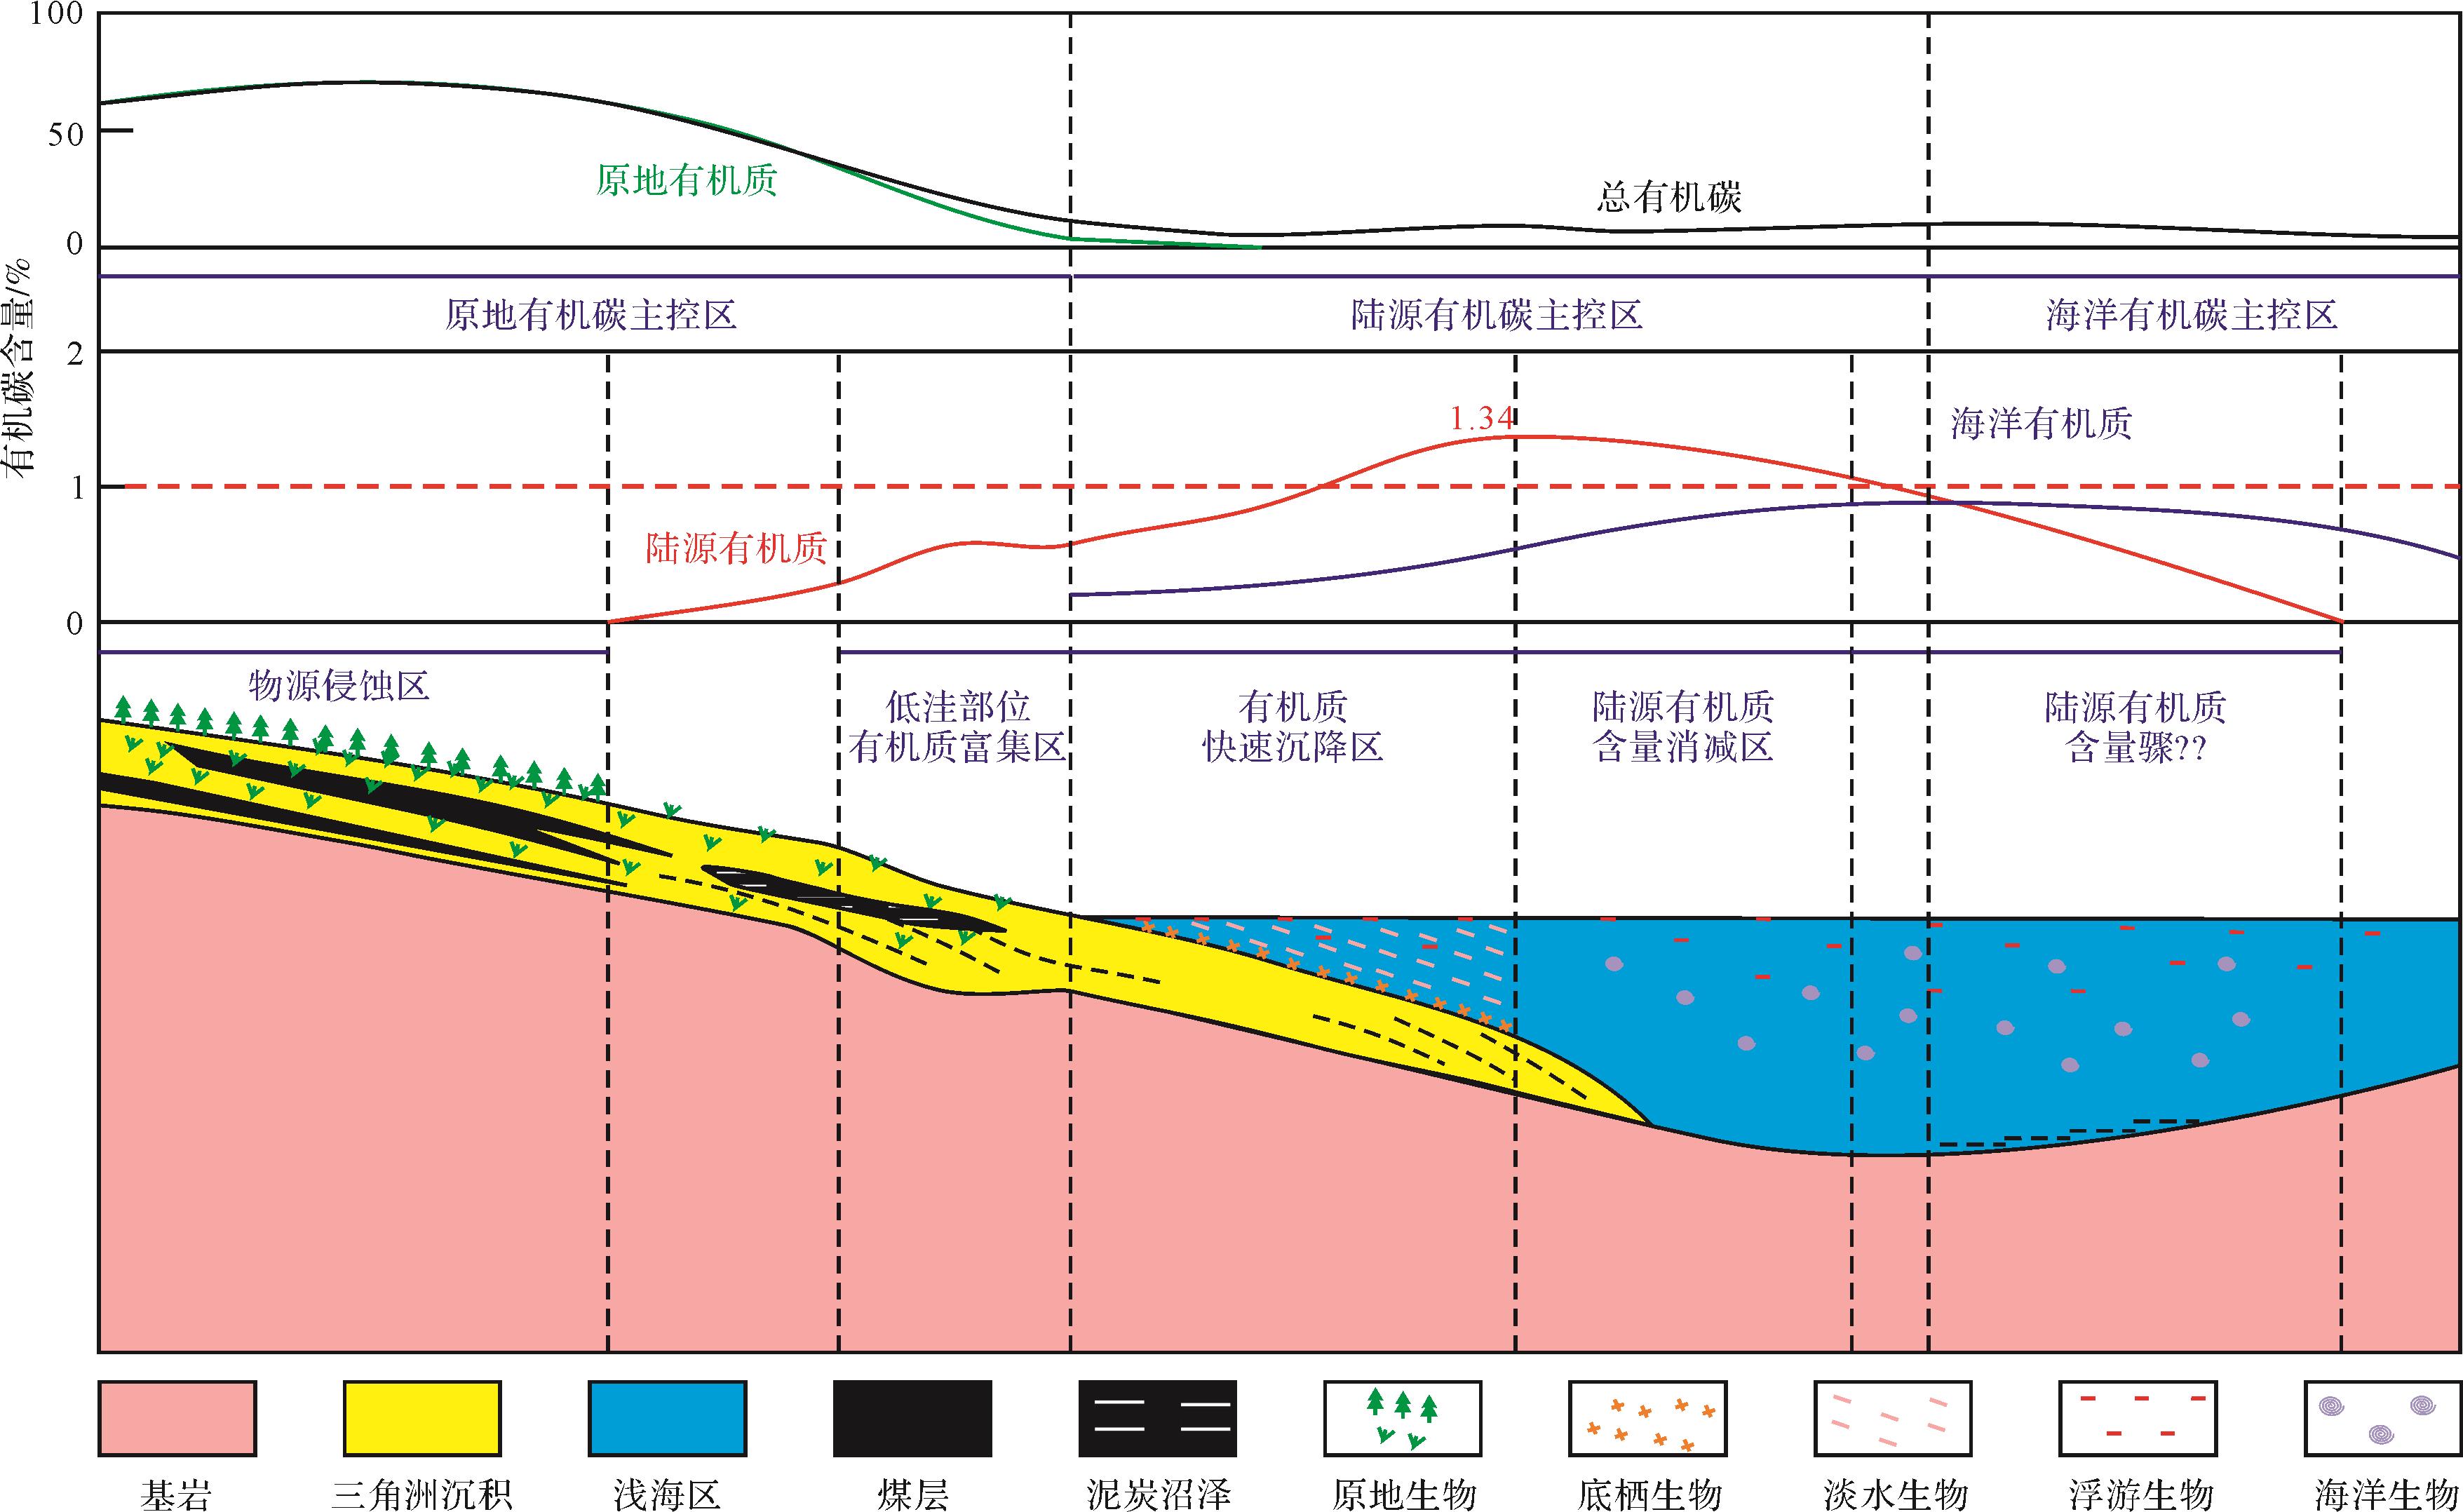
  • 结合实验过程观察与陆源有机碳含量变化趋势预测结果,建立陆源有机质分布模式。单一物源条件下,随搬运距离的增加,陆源有机质含量呈先增大后减小的“单峰型”变化趋势。在近物源区一定范围内由于水动力环境过强,以侵蚀作用为主,使得陆源有机质无法保存,为陆源侵蚀区;在凹槽、冲沟等下切低地势部位为陆源有机质偏高区域,为低洼部位陆源有机质富集区;河流一旦入海,水动力会快速下降,在海平面附近形成陆源有机质的快速沉积带,即有机质快速沉降带;当河流水动力强度被削减到一定程度时,较大颗粒的陆源有机质将无法被搬运,可被搬运的那一部分有机质的量将逐渐减少,因此会出现陆源有机质含量的消减区。在水动力环境被海水削弱的同时,基底地势逐渐升高,对有机质的迁移形成阻挡,在水动力环境与地形的双重控制作用下,出现陆源有机碳含量的骤减区。在三角洲平原区,常因原地植被及生物的存在形成泥炭沼泽,其中在未受海平面影响的近物源处可形成煤层,煤层有机碳含量可达90%,而泥炭沼泽大量发育炭质泥岩,直至滨浅海部位,煤层及沼泽逐渐欠发育,因此,原地有机碳含量由物源区向浅海方向呈先缓慢增长后急速下降的趋势,但其有机碳含量通常较大。滨浅海区域是底栖生物及浮游生物的生存之所,向海洋方向逐渐过渡为海洋生物及浮游生物,生物死后遗体大量堆积是海洋有机质的主要来源。因此,在三角洲平原区域,有机碳含量主要受控于原地生物的生长富集,为原地有机碳主控区;在三角洲前缘—滨浅海区域,陆源有机质大量沉积,其贡献可能超过浅海生物的贡献,为陆源有机碳主控区;在滨浅海—深海区域,海洋生物是有机质的主要供应者,为海洋有机碳主控区(图17)。

    Figure 17.  Distribution pattern of "unimodal" terrigenous organic matter from a single source

    多物源交汇条件下,陆源有机质的分布特征是单一物源条件下的叠加,物源交汇之前的陆源有机质分布特征与单物源条件时相同,当物源交汇时陆源有机质在物源交汇区的有机碳含量将高于单一物源供给时的量。因此,向深水方向,由于多物源的交汇,可使陆源有机质消减区范围缩小或消失且不出现陆源有机质含量骤减区,向深水方向过渡为“源—汇区”陆源有机质富集区,深水区的总有机碳含量由陆源有机质与海洋有机质共同控制,划分区域由混和有机碳主控区替代单一物源时的海洋有机碳主控区(图18)。

    Figure 18.  Distribution pattern of terrestrial organic matter enriched in “source⁃sink area” from multiple sources

  • 结合预测模型计算结果及单物源“单峰型”陆源有机质分布模式,对崖南凹陷崖城组搬运陆源有机碳含量分布进行预测,崖南凹陷西北部物源可输送陆源有机质至47.7 km处,即搬运的陆源有机质可输送到凹陷中央处,Y1井处向凹陷中央方向陆源有机碳含量逐渐增大,在Y4井处陆源有机碳含量达到最大,自此向凹陷中央方向陆源有机碳含量逐渐降低,Y6井处为陆源有机碳含量快速下降区,直至凹陷中央下降为0(图19)。

    Figure 19.  Prediction map of terrestrial organic matter distribution in the Yanan Sag

  • (1) 陆源有机质主要沉积于水动力较弱、地势较低的部位,最远搬运距离及搬运量受水动力环境控制。地形坡度越陡,水动力环境越强,陆源有机质最大搬运距离越大,搬运量越大。

    (2) 陆源有机碳含量向远离物源方向呈先增大后减小的变化趋势,在三角洲前缘—浅海沉积区附近出现高值区。单一物源条件下,远离物源方向依次为原地有机质主控区、陆源有机质主控区及海洋有机质主控区;多物源条件下,远离物源方向依次为原地有机质主控区、陆源有机质主控区及混和有机质主控区。其中陆源有机质主控区及混合有机质主控区是陆源海相烃源岩发育有利区,这一区域通常位于三角洲前缘—浅海范围内。

    (3) 崖南凹陷崖城组陆源有机质最远搬运距离约47.7 km,在距物源区约30 km处达到陆源有机碳含量的最大值1.4%,即崖南凹陷陆源有机质最远可搬运至Y6井附近,在Y4井附近达到最大值,Y4井区域是陆源海相烃源岩的有利发育区。

Reference (39)

Catalog

    /

    DownLoad:  Full-Size Img  PowerPoint
    Return
    Return