Advanced Search
Volume 40 Issue 3
Jun.  2022
Turn off MathJax
Article Contents

WANG Yue, GUI HeRong, SU ShangGuo, ZHOU QiMing, LI Jun, ZHANG YaNan. Sedimentary Environment and Paleoclimate Geochemical Characteristics of Shale in the Wufeng and Longmaxi Formations, Northern Yunan-Guizhou Area[J]. Acta Sedimentologica Sinica, 2022, 40(3): 653-666. doi: 10.14027/j.issn.1000-0550.2021.113
Citation: WANG Yue, GUI HeRong, SU ShangGuo, ZHOU QiMing, LI Jun, ZHANG YaNan. Sedimentary Environment and Paleoclimate Geochemical Characteristics of Shale in the Wufeng and Longmaxi Formations, Northern Yunan-Guizhou Area[J]. Acta Sedimentologica Sinica, 2022, 40(3): 653-666. doi: 10.14027/j.issn.1000-0550.2021.113

Sedimentary Environment and Paleoclimate Geochemical Characteristics of Shale in the Wufeng and Longmaxi Formations, Northern Yunan-Guizhou Area

doi: 10.14027/j.issn.1000-0550.2021.113
Funds:

National Natural Science Foundation of China 41773100, 41373095

  • Received Date: 2021-06-22
  • Rev Recd Date: 2021-07-21
  • Publish Date: 2022-06-10
  • To study the relationship between the mass extinction of life in the Ordovician and the paleoenvironment and paleogeography of that period, total organic carbon (TOC), major elements, trace elements and carbon isotope geochemical analyses were carried out on samples from the Wufeng Formation⁃Longmaxi Formation in the northern Yunan-Guizhou area. The results show that the changes in the Ba/Al and Ni/Al values of the Wufeng Formation⁃Longmaxi Formation indicate that the marine productivity of the Wufeng Formation was relatively stable, starting from the Wufeng Formation and gradually increasing until the Guanyinqiao Formation reached its peak and then decreased. In the Longmaxi Formation, marine productivity began to rise again, then gradually decreased and stabilized. Especially in the Guanyinqiao Formation during the Hirnantian period, there was a jump in productivity in the Guanyinqiao Formation, which indicated a significant change in the nature of the Ordovician seawater. The Vr/Cr ratio and U/Th ratio generally show that the Wufeng, Guanyinqiao and Longmaxi Groups were in anaerobic environments. The U-Mo covariant model shows that the Dianqianbei area was a strong retention basin during the period of the Wufeng Formation, and during the period of Longmaxi Formation it was a semi-retention basin. The chemical weathering index (CIA) indicates that the temperature in northern Yunnan and Guizhou began to decline slowly in the early Wufeng Formation. The regional temperature fell until the glacial period during the Guanyinqiao period. The Longmaxi Formation gradually recovered in the early period, but from the Longmaxi Formation to the Guanyinqiao Formation to the Wufeng Formation the climate was extremely unstable. The mass extinction of life at the end of the Ordovician was caused by changes in the pattern and intensity of ocean currents, and changes in the physical and chemical properties of seawater as polar glaciers developed. Both of these changes were due to the distribution pattern of sea and land.
  • [1] Gerhard L C, Harrison W E. Distribution of oceans and continents: A geological constraint on global climate variability[M]//Gerhard L C, Harrison W E, Hanson B M. Geological perspectives of global climate change. American: American Association of Petroleum Geologists, 2001: 35-49.
    [2] Raup D M, Sepkoski J J. Mass extinctions in the marine fossil record[J]. Science, 1982, 215(4539): 1501-1503.
    [3] Sepkoski J J. Stratigraphic biases in the analysis of taxonomic survivorship[J]. Paleobiology, 1975, 1(4): 343-355.
    [4] Bambach R K, Knoll A H, Wang S C. Origination, extinction, and mass depletions of marine diversity[J]. Paleobiology, 2004, 30(4): 522-542.
    [5] Barnes C R. Ordovician oceans and climate[M]//Webby B D, Paris F, Droser M L, et al. The great Ordovician biodiversification event (The critical moments and perspectives in earth history and paleobiology). Columbia: Columbia University Press, 2004: 72-76.
    [6] Stanley S M. Estimates of the magnitudes of major marine mass extinctions in earth history[J]. Proceedings of the National Academy of Sciences of the United States of America, 2016, 113(42): E6325-E6334.
    [7] Banner J L. Radiogenic isotopes: Systematics and applications to Earth surface processes and chemical stratigraphy[J]. Earth-Science Reviews, 2004, 65(3/4): 141-194.
    [8] Wang K, Chatterton B D E, Wang Y. An organic carbon isotope record of Late Ordovician to Early Silurian marine sedimentary rocks, Yangtze Sea, South China: Implications for CO2 changes during the Hirnantian glaciation[J]. Palaeogeography, Palaeoclimatology, Palaeoecology, 1997, 132(1/2/3/4): 147-158.
    [9] Kump L R. Interpreting carbon-isotope excursions: Strangelove oceans[J]. Geology, 1991, 19(4): 299-302
    [10] Chen X, Rong J Y, Fan J X, et al. The Global Boundary Stratotype Section and Point (GSSP) for the base of the Hirnantian stage (the uppermost of the Ordovician System)[J]. Episodes, 2006, 29(3): 183-196.
    [11] Melchin M J, Holmden C. Carbon isotope chemostratigraphy in Arctic Canada: Sea-level forcing of carbonate platform weathering and implications for Hirnantian global correlation[J]. Palaeogeography, Palaeoclimatology, Palaeoecology, 2006, 234(2/3/4): 186-200.
    [12] Yan D T, Chen D Z, Wang Q C, et al. Carbon and sulfur isotopic anomalies across the Ordovician-Silurian boundary on the Yangtze Platform, South China[J]. Palaeogeography, Palaeoclimatology, Palaeoecology, 2009, 274(1/2): 32-39.
    [13] Fan J X, Peng P A, Melchin M J. Carbon isotopes and event stratigraphy near the Ordovician-Silurian boundary, Yichang, South China[J]. Palaeogeography, Palaeoclimatology, Palaeoecology, 2009, 276(1/2/3/4): 160-169.
    [14] Chen C, Wang J S, Algeo T J, et al. Negative δ13Ccarb shifts in Upper Ordovician (Hirnantian) Guanyinqiao bed of South China linked to diagenetic carbon fluxes[J]. Palaeogeography, Palaeoclimatology, Palaeoecology, 2007, 487: 430-446.
    [15] Le Heron D P, Craig J, Etienne J L. Ancient glaciations and hydrocarbon accumulations in North Africa and the Middle East[J]. Earth-Science Reviews, 2009, 93(3/4): 47-76.
    [16] Melchin M J, Mitchell C E, Holmden C, et al. Environmental changes in the Late Ordovician–early Silurian: Review and new insights from black shales and nitrogen isotopes[J]. GSA Bulletin, 2013, 125(11/12): 1635-1670.
    [17] 尹福光,许效松,万方,等. 华南地区加里东期前陆盆地演化过程中的沉积响应[J]. 地球学报,2001,22(5):425-428.

    Yin Fuguang, Xu Xiaosong, Wan Fang, et al. The sedimentary response to the evolutionary process of Caledonian Foreland Basin system in South China[J]. Acta Geoscientia Sinica, 2001, 22(5): 425-428.
    [18] 万方,许效松. 川滇黔桂地区志留纪构造岩相古地理[J]. 古地理学报,2003,5(2):180-186.

    Wan Fang, Xu Xiaosong. Tectonic- lithofacies palaeogeography of the Silurian in Sichuan-Yunnan-Guizhou-Guangxi region[J]. Journal of Palaeogeography, 2003, 5(2): 180-186.
    [19] 郭英海,李壮福,李大华,等. 四川地区早志留世岩相古地理[J]. 古地理学报,2004,6(1):20-29.

    Guo Yinghai, Li Zhuangfu, Li Dahua, et al. Lithofacies palaeogeography of the Early Silurian in Sichuan area[J].Journal of Palaeogeography, 2004, 6(1): 20-29.
    [20] 戎嘉余,陈旭,王怿,等. 奥陶—志留纪之交黔中古陆的变迁:证据与启示[J]. 中国科学(D辑):地球科学,2011,41(10):1407-1415.

    Rong Jiayu, Chen Xu, Wang Yi, et al. Northward expansion of Central Guizhou Oldland through the Ordovician and Silurian transition: Evidence and implications[J]. Science China (Seri. D): Earth Sciences, 2011, 41(10): 1407-1415.
    [21] 冯增昭,彭勇民,金振奎,等. 中国南方中及晚奥陶世岩相古地理[J]. 古地理学报,2001,3(4):10-24.

    Feng Zengzhao, Peng Yongmin, Jin Zhenkui, et al. Lithofacies palaeogeography of the Middle and Late Ordovician in South China[J]. Journal of Palaeogeography, 2001, 3(4): 10-24.
    [22] 苏文博,李志明, Ettensohn F R,等. 华南五峰组—龙马溪组黑色岩系时空展布的主控因素及其启示[J]. 地球科学:中国地质大学学报,2007,32(6):819-827.

    Su Wenbo, Li Zhiming, Ettensohn F R, et al. Distribution of black shale in the Wufeng–Longmaxi Formations (Ordovician–Silurian), South China: Major controlling factors and implications[J]. Earth Science: Journal of China University of Geosciences, 2007, 32(6): 819-827.
    [23] 牟传龙,周恳恳,梁薇,等. 中上扬子地区早古生代烃源岩沉积环境与油气勘探[J]. 地质学报,2011,85(4):526-532.

    Mu Chuanlong, Zhou Kenken, Liang Wei, et al. Early Paleozoic sedimentary environment of hydrocarbon source rocks in the Middle-Upper Yangtze region and petroleum and gas exploration[J]. Acta Geologica Sinica, 2011, 85(4): 526-532.
    [24] Chen X, Rong J Y, Li Y, et al. Facies patterns and geography of the Yangtze region, South China, through the Ordovician and Silurian transition[J]. Palaeogeography, Palaeoclimatology, Palaeoecology, 2004, 204(3/4): 353-372.
    [25] Tribovillard N, Algeo T J, Lyons T, et al. Trace metals as paleoredox and paleoproductivity proxies: An update[J]. Chemical Geology, 2006, 232(1/2): 12-32.
    [26] Nesbitt H W, Young G M. Early Proterozoic climates and plate motions inferred from major element chemistry of lutites[J]. Nature, 1982, 299(5885): 715-717.
    [27] McLennan S M. Weathering and global denudation[J]. The Journal of Geology, 1993, 101(2): 295-303.
    [28] Dymond J, Suess E, Lyle M. Barium in deep-sea sediment: A geochemical proxy for paleoproductivity[J]. Paleoceanography, 1992, 7(2): 163-181.
    [29] Böning P, Shaw T, Pahnke K, et al. Nickel as indicator of fresh organic matter in upwelling sediments[J]. Geochimica et Cosmochimica Acta, 2015, 162: 99-108.
    [30] Sepkoski J J. The Ordovician radiations: Diversification and extinction shown by global genus-level taxonomic data[M]//Cooper J D, Droser M L, Finney S C. Ordovician odyssey: Short papers for the Seventh International Symposium on the Ordovician System. Las Vegas, Nevada, USA: Pacific Section Society for Sedimentary Geology (SEPM), 1995: 393-396.
    [31] Sepkoski J J. A kinetic model of Phanerozoic taxonomic diversity. III. Post-Paleozoic families and mass extinctions[J]. Paleobiology, 1984, 10(2): 246-267.
    [32] Copper P. Frasnian/Famennian mass extinction and cold-water oceans[J]. Geology, 1986, 14(10): 835-839.
    [33] McGhee G R. The Frasnian–Famennian event[M]//Donovan S K. Mass extinction: Processes and evidences. California: The University of California, 1989: 266.
    [34] McGhee G R. The Late Devonian mass extinction: The Frasnian/Famennian crisis[M]. New York: Columbia University Press, 1996: 378.
    [35] Hallam A, Wignall P B. Mass extinctions and sea-level changes[J]. Earth-Science Reviews, 1999, 48(4): 217-250.
    [36] House M R. Strength, timing, setting and cause of mid-Palaeozoic extinctions[J]. Palaeogeography, Palaeoclimatology, Palaeoecology, 2002, 181(1/2/3): 5-25.
    [37] Brenchley P J, Cullen B. The environmental distribution of associations belonging to the Hirnantia fauna–evidence from North Wales and Norway[M]//Bruton D L. Aspeels of the Ordovician system. Oslo: Paleontological Contributions University Oslo, 1984: 113-125.
    [38] Hatch J R, Leventhal J S. Relationship between inferred redox potential of the depositional environment and geochemistry of the Upper Pennsylvanian (Missourian) Stark Shale member of the Dennis Limestone, Wabaunsee County, Kansas, U.S.A.[J]. Chemical Geology, 1992, 99(1/2/3): 65-82.
    [39] Jones B, Manning D A C. Comparison of geochemical indices used for the interpretation of palaeoredox conditions in ancient mudstones[J]. Chemical Geology, 1994, 111(1/2/3/4): 111-129.
    [40] Klinkhammer G P, Palmer M R. Uranium in the oceans: Where it goes and why[J]. Geochimica et Cosmochimica Acta, 1991, 55(7): 1799-1806.
    [41] Crusius J, Calvert S, Pedersen T, et al. Rhenium and molybdenum enrichments in sediments as indicators of oxic, suboxic and sulfidic conditions of deposition[J]. Earth and Planetary Science Letters, 1996, 145(1/2/3/4): 65-78.
    [42] Calvert S E, Pedersen T F. Chapter fourteen elemental proxies for Palaeoclimatic and Palaeoceanographic variability in marine sediments: Interpretation and application[J]. Developments in Marine Geology, 2007, 1: 567-644.
    [43] Taylor S R, McLennan S M. The continental Crust: Its composition and evolution[M]. Oxford: Blackwell Scientific Publications, 1985: 12-13.
    [44] Rowe H D, Loucks R G, Ruppel S C, et al. Mississippian Barnett Formation, Fort Worth Basin, Texas: Bulk geochemical inferences and Mo-TOC constraints on the severity of hydrographic restriction[J]. Chemical Geology, 2008, 257(1/2): 16-25.
    [45] Marynowski L, Zatoń M, Rakociński M, et al. Deciphering the Upper Famennian Hangenberg Black Shale depositional environments based on multi-proxy record[J]. Palaeogeography, Palaeoclimatology, Palaeoecology, 2012, 346-347: 66-86.
    [46] Algeo T J, Tribovillard N. Environmental analysis of paleoceanographic systems based on molybdenum-uranium covariation[J]. Chemical Geology, 2009, 268(3/4): 211-225.
    [47] Algeo T J, Lyons T W. Mo-total organic carbon covariation in modern anoxic marine environments: Implications for analysis of paleoredox and paleohydrographic conditions[J]. Paleoceanography, 2006, 21(1): PA1016.
    [48] Ross D J K, Bustin R M. Investigating the use of sedimentary geochemical proxies for paleoenvironment interpretation of thermally mature organic-rich strata: Examples from the Devonian-Mississippian shales, western Canadian Sedimentary Basin[J]. Chemical Geology, 2009, 260(1/2): 1-19.
    [49] Fedo C M, Nesbitt H W, Young G M. Unraveling the effects of potassium metasomatism in sedimentary rocks and paleosols, with implications for paleoweathering conditions and provenance[J]. Geology, 1995, 23(10): 921-924.
    [50] 张喜,张廷山,赵晓明,等. 天文轨道周期及火山活动对中上扬子区晚奥陶世—早志留世有机碳聚集的影响[J]. 石油勘探与开发,2021,48(4):732-744.

    Zhang Xi, Zhang Tingshan, Zhao Xiaoming, et al. Effects of astronomical orbital cycle and volcanic activity on organic carbon accumulation during Late Ordovician-Early Silurian in the Upper Yangtze area, South China[J]. Petroleum Exploration and Development, 2021, 48(4): 732-744.
    [51] 邱振,邹才能. 非常规油气沉积学:内涵与展望[J]. 沉积学报,2020,38(1):1-29.

    Qiu Zhen, Zou Caineng. Unconventional petroleum sedimentology: Connotation and prospect[J]. Acta Sedimentologica Sinica, 2020, 38(1): 1-29.
    [52] Ripperdan R L, Magaritz M, Kirschvink J L. Carbon isotope and magnetic polarity evidence for non-depositional events within the Cambrian- Ordovician boundary section near Dayangcha, Jilin province, China[J]. Geological Magazine, 1993, 130(4): 443-452.
    [53] Ripperdan R L, Magaritz M, Nicoll R S, et al. Simultaneous changes in carbon isotopes, sea level, and conodont biozones within the Cambrian-Ordovician boundary interval at Black Mountain, Australia[J]. Geology, 1992, 20(11): 1039-1042.
    [54] Underwood C J, Deynoux M, Ghienne J F. High palaeolatitude (Hodh, Mauritania) recovery of graptolite faunas after the Hirnantian (end Ordovician) extinction event[J]. Palaeogeography, Palaeoclimatology, Palaeoecology, 1998, 142(3/4): 91-105.
    [55] LaPorte D F, Holmden C, Patterson W P, et al. Local and global perspectives on carbon and nitrogen cycling during the Hirnantian glaciation[J]. Palaeogeography, Palaeoclimatology, Palaeoecology, 2009, 276(1/2/3/4): 182-195.
    [56] Munnecke A, Zhang Y D, Liu X, et al. Stable carbon isotope stratigraphy in the Ordovician of South China[J]. Palaeogeography, Palaeoclimatology, Palaeoecology, 2011, 307(1/2/3/4): 17-43.
    [57] Bergström S M, Lehnert O, Calner M, et al. A new Upper Middle Ordovician–Lower Silurian drillcore standard succession from Borenshult in Östergötland, southern Sweden: 2. Significance of δ13C chemostratigraphy[J]. GFF, 2012, 134(1): 39-63.
    [58] Harper D A T, Hammarlund E U, Rasmussen C M Ø. End Ordovician extinctions: A coincidence of causes[J]. Gondwana Research, 2014, 25(4): 1294-1307.
    [59] Harper D A T, Hints L. Hirnantian (Late Ordovician) brachiopod faunas across Baltoscandia: A global and regional context[J]. Palaeogeography, Palaeoclimatology, Palaeoecology, 2016, 444: 71-83.
    [60] Boucot A J, Rong J Y, Chen X, et al. Pre-Hirnantian Ashgill climatically warm event in the Mediterranean Region[J]. Lethaia, 2002, 36(2): 119-131.
    [61] Fortey R A, Cocks L R M. Late Ordovician global warming-the Boda event[J]. Geology, 2005, 33(5): 405-408.
    [62] Finnegan S, Heim N A, Peters S E, et al. Climate change and the selective signature of the Late Ordovician mass extinction[J]. Proceedings of the National Academy of Sciences of the United States of America, 2012, 109(18): 6829-6834.
    [63] Gorjan P, Kaiho K, Fike D A, et al. Carbon- and sulfur-isotope geochemistry of the Hirnantian (Late Ordovician) Wangjiawan (Riverside) section, South China: Global correlation and environmental event interpretation[J]. Palaeogeography, Palaeoclimatology, Palaeoecology, 2012, 337-338: 14-22.
    [64] Trotter J A, Williams I S, Barnes C R, et al. Did cooling oceans trigger Ordovician biodiversification? Evidence from conodont thermometry[J]. Science, 2008, 321(5888): 550-554.
    [65] Jeppsson L. Lithological and conodont distributional evidence for episodes and anomalous oceanic conditions during the Silurian[M]//Aldridge R J. Palaeobiology of conodonts. Chichester: Ellis Horwood, 1987: 129-145.
    [66] Bickert T, Pätzold J, Samtleben C, et al. Paleoenvironmental changes in the Silurian indicated by stable isotopes in brachiopod shells from Gotland, Sweden[J]. Geochimica et Cosmochimica Acta, 1997, 61(13): 2717-2730.
    [67] Brenchley P J, Carden G A, Hints L, et al. High-resolution stable isotope stratigraphy of Upper Ordovician sequences: Constraints on the timing of bioevents and environmental changes associated with mass extinction and glaciation[J]. GSA Bulletin, 2003, 115(1): 89-104.
    [68] Brenchley P J, Marshall J D, Carden G A F, et al. Bathymetric and isotopic evidence for a short-lived Late Ordovician glaciation in a greenhouse Period[J]. Geology, 1994, 22(4), 295-298.
    [69] Kump L R, Arthur M A, Patzkowsky M E, et al. A weathering hypothesis for glaciation at high atmospheric pCO2 during the Late Ordovician[J]. Palaeogeography, Palaeoclimatology, Palaeoecology, 1999, 152(1/2): 173-187.
    [70] Armstrong H A, Coe A L. Deep-sea sediments record the geophysiology of the Late Ordovician glaciation[J]. Journal of the Geological Society, 1997, 154(6): 929-934.
    [71] 贵州省地质矿产局 .贵州省区域地质志[M].北京: 地质出版社, 1987: 97-137.

    Bureau of Geology and Mineral Resources of Guizhou Province. Regional geology of Guizhou province[M]. Beijing: Geology Publishing House, 1987: 97-137.
    [72] Wilde P, Berry W B N. Destabilization of the oceanic density structure and its significance to marine “extinction” events[J]. Palaeogeography, Palaeoclimatology, Palaeoecology, 1984, 48(2/3/4): 143-162.
    [73] Hammarlund E U, Dahl T W, Harper D A T, et al. A sulfidic driver for the end-Ordovician mass extinction[J]. Earth and Planetary Science Letters, 2012, 331-332: 128-139.
    [74] Pope K. Impact dust not the cause of the Cretaceous-Tertiary mass extinction[J]. Geology, 2002, 30(2): 99-102.
    [75] Harper D A T, Rong J Y. Patterns of change in the brachiopod faunas through the Ordovician-Silurian interface[J]. Modern Geology, 1995, 20(1): 83-100.
    [76] Sheehan P M. The Late Ordovician mass extinction[J]. Annual Review of Earth and Planetary Sciences, 2001, 29(1): 331-364.
    [77] Rasmussen C M Ø, Harper D A T. Interrogation of distributional data for the End Ordovician crisis interval: Where did disaster strike?[J]. Geological Journal, 2011, 46(5): 478-500.
    [78] Yan D T, Chen D Z, Wang Q C, et al. Carbon and sulfur isotopic anomalies across the Ordovician–Silurian boundary on the Yangtze Platform, South China[J]. Palaeogeography, Palaeoclimatology, Palaeoecology, 2009, 274, 32-39.
    [79] Zhang T G, Shen Y N, Zhan R B, et al. Large perturbations of the carbon and sulfur cycle associated with the Late Ordovician mass extinction in South China[J]. Geology, 2009, 37(4): 299-302.
    [80] Bergström S M, Eriksson M E, Young S A, et al. Hirnantian (latest Ordovician) δ13C chemostratigraphy in southern Sweden and globally: A refined integration with the graptolite and conodont zone successions[J]. GFF, 2014, 136(2): 355-386.
    [81] Barnes C R. Ordovician oceans and climate[M]//Webby B D, Paris F, Droser M L, et al. The great Ordovician biodiversification event (The critical moments and perspectives in earth history and paleobiology). Columbia: Columbia University Press, 2004: 72-76.
    [82] Frakes L A, Francis J E, Syktus J I. Climate modes of the Phanerozoic[M]. Cambridge: Cambridge University Press, 1992: 15-25.
    [83] Hallam A. Phanerozoic sea-level changes[M]. New York: Columbia University Press, 1992.
    [84] Berner R A. Palaeo-CO2 and climate[J]. Nature, 1992, 358(6382): 114.
    [85] Berner R A. GEOCARB II; a revised model of atmospheric CO2 over Phanerozoic time[J]. American Journal of Science, 1994, 294(1): 56-91.
    [86] Yapp C J, Poths H. Ancient atmospheric CO2 pressures inferred from natural goethites[J]. Nature, 1992, 355(6358): 342-344.
    [87] Berner R A, Kothavala Z. Geocarb III; a revised model of atmospheric CO2 over Phanerozoic time[J]. American Journal of Science, 2001, 301(2): 182-204.
    [88] Tabor N J, Poulsen C J. Palaeoclimate across the Late Pennsylvanian–Early Permian tropical palaeolatitudes: A review of climate indicators, their distribution, and relation to palaeophysiographic climate factors[J]. Palaeogeography, Palaeoclimatology, Palaeoecology, 2008, 268(3/4): 293-310.
    [89] Parrish J T. Upwelling and petroleum source beds, with reference to Paleozoic[J]. AAPG Bulletin, 1982, 66(6): 750-774.
    [90] Pohl A, Nardin E, Vandenbroucke T R A, et al. High dependence of Ordovician ocean surface circulation on atmospheric CO2 levels[J]. Palaeogeography, Palaeoclimatology, Palaeoecology, 2016, 458: 39-51.
    [91] Boucot A J, Xu C, Scotese C R, et al. Phanerozoic Paleoclimate: An atlas of Lithologic indicators of climate[M]. Tulsa, Oklahoma: SEPM Society for Sedimentary Geology, 2013: 38-47.
    [92] Gerhard L C, Harrison W E, “Bruno” Hanson B M. Introduction and Overview[M]//Gerhard L C, Harrison W E, Hanson B M. Geological perspectives of global climate change. American: American Association of Petroleum Geologists. 2001: 35-49.
    [93] Pope M, Read J F. Ordovician metre-scale cycles: Implications for climate and eustatic fluctuations in the central Appalachians during a global greenhouse, non-glacial to glacial transition[J]. Palaeogeography, Palaeoclimatology, Palaeoecology, 1998, 138(1/2/3/4): 27-42.
    [94] Bigg G R. The Oceans and climate[M]. Cambridge: Cambridge University Press, 1996: 266.
  • 加载中
通讯作者: 陈斌, bchen63@163.com
  • 1. 

    沈阳化工大学材料科学与工程学院 沈阳 110142

  1. 本站搜索
  2. 百度学术搜索
  3. 万方数据库搜索
  4. CNKI搜索

Figures(7)  / Tables(1)

Article Metrics

Article views(263) PDF downloads(239) Cited by()

Proportional views
Related
Publishing history
  • Received:  2021-06-22
  • Revised:  2021-07-21
  • Published:  2022-06-10

Sedimentary Environment and Paleoclimate Geochemical Characteristics of Shale in the Wufeng and Longmaxi Formations, Northern Yunan-Guizhou Area

doi: 10.14027/j.issn.1000-0550.2021.113
Funds:

National Natural Science Foundation of China 41773100, 41373095

Abstract: To study the relationship between the mass extinction of life in the Ordovician and the paleoenvironment and paleogeography of that period, total organic carbon (TOC), major elements, trace elements and carbon isotope geochemical analyses were carried out on samples from the Wufeng Formation⁃Longmaxi Formation in the northern Yunan-Guizhou area. The results show that the changes in the Ba/Al and Ni/Al values of the Wufeng Formation⁃Longmaxi Formation indicate that the marine productivity of the Wufeng Formation was relatively stable, starting from the Wufeng Formation and gradually increasing until the Guanyinqiao Formation reached its peak and then decreased. In the Longmaxi Formation, marine productivity began to rise again, then gradually decreased and stabilized. Especially in the Guanyinqiao Formation during the Hirnantian period, there was a jump in productivity in the Guanyinqiao Formation, which indicated a significant change in the nature of the Ordovician seawater. The Vr/Cr ratio and U/Th ratio generally show that the Wufeng, Guanyinqiao and Longmaxi Groups were in anaerobic environments. The U-Mo covariant model shows that the Dianqianbei area was a strong retention basin during the period of the Wufeng Formation, and during the period of Longmaxi Formation it was a semi-retention basin. The chemical weathering index (CIA) indicates that the temperature in northern Yunnan and Guizhou began to decline slowly in the early Wufeng Formation. The regional temperature fell until the glacial period during the Guanyinqiao period. The Longmaxi Formation gradually recovered in the early period, but from the Longmaxi Formation to the Guanyinqiao Formation to the Wufeng Formation the climate was extremely unstable. The mass extinction of life at the end of the Ordovician was caused by changes in the pattern and intensity of ocean currents, and changes in the physical and chemical properties of seawater as polar glaciers developed. Both of these changes were due to the distribution pattern of sea and land.

WANG Yue, GUI HeRong, SU ShangGuo, ZHOU QiMing, LI Jun, ZHANG YaNan. Sedimentary Environment and Paleoclimate Geochemical Characteristics of Shale in the Wufeng and Longmaxi Formations, Northern Yunan-Guizhou Area[J]. Acta Sedimentologica Sinica, 2022, 40(3): 653-666. doi: 10.14027/j.issn.1000-0550.2021.113
Citation: WANG Yue, GUI HeRong, SU ShangGuo, ZHOU QiMing, LI Jun, ZHANG YaNan. Sedimentary Environment and Paleoclimate Geochemical Characteristics of Shale in the Wufeng and Longmaxi Formations, Northern Yunan-Guizhou Area[J]. Acta Sedimentologica Sinica, 2022, 40(3): 653-666. doi: 10.14027/j.issn.1000-0550.2021.113
  • 在奥陶纪—志留纪时期,地球经历了广泛的冰川事件、海平面升降、碳同位素的大幅度波动、广泛的火山活动、大洋缺氧事件和富有机质泥页岩的广泛沉积等[1]。奥陶纪大灭绝事件是五大灭绝事件最古老的一个,此次大灭绝事件使得海洋中约50%的属和85%的种消亡[2-6]。目前,主要认为奥陶纪末期的冰期事件是此次灭绝事件的原因。然而,在关于奥陶纪末期的冰期事件与生物灭绝事件之间的联系存在诸多争议[7]。由于奥陶纪—志留纪之交是生物灭绝和生态环境突变的重要转折期,同时也是全球重要的页岩广泛发育时期,这为研究奥陶纪大灭绝问题提供了良好的契机。黑色页岩的发育受许多因素控制,例如古海洋的初级生产力、海水的氧化还原状态和大陆风化作用的强弱等。因此,了解古海洋生产力和古氧化还原状态对于探索古地史时期大洋地球化学特征和古海洋的环境演化有重要意义[8-14]。在奥陶纪—志留纪时期,扬子板块及其周缘地区广泛发育有五峰组—龙马溪组黑色页岩,与同一时期其他地区的页岩相比,北美Vinini页岩和Moffett页岩具有较大的厚度和较早的形成特征,这表明不同地区之间的沉积环境也存在很大差异[15-16]。因此,本研究通过滇黔北地区五峰组—龙马溪组黑色页岩的总有机碳(TOC)、主量元素、微量元素和碳同位素地球化学分析,揭示滇黔北地区奥陶纪—志留纪时期古海洋地球化学特征,并尝试探讨奥陶纪末期大灭绝的成因。

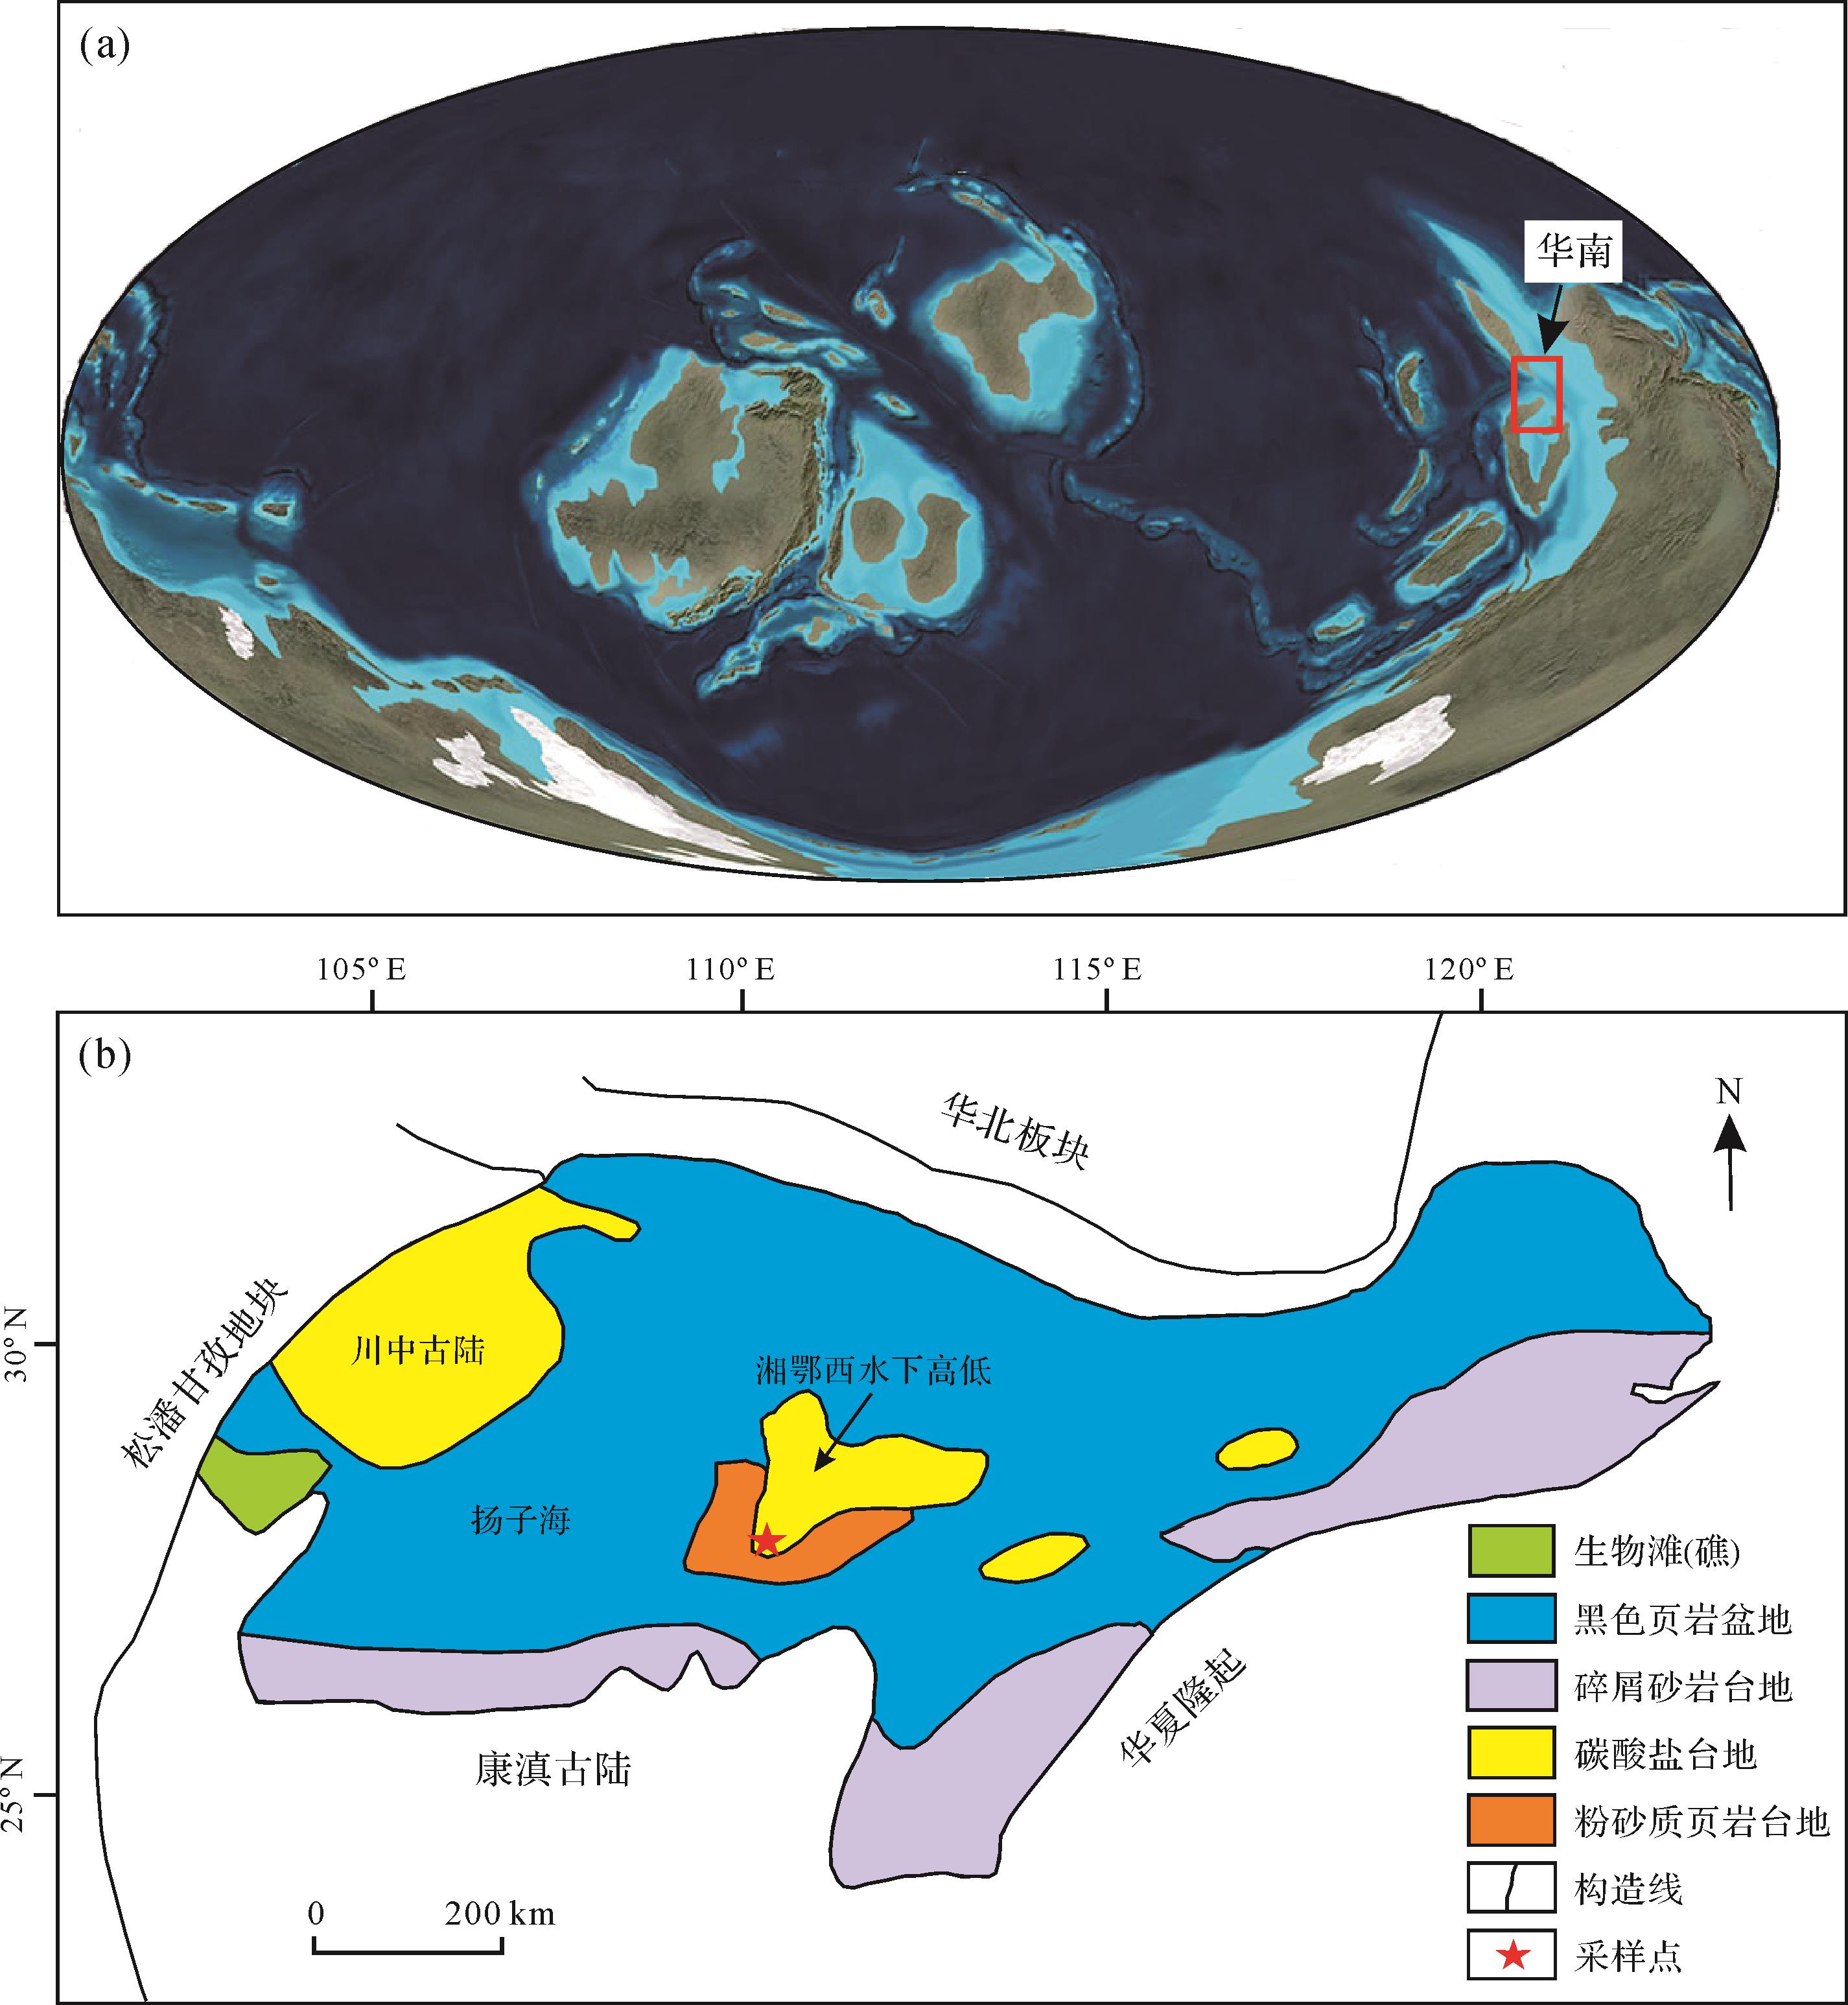
  • 滇黔北地区位于上扬子台地的西部,所处大地构造位置东南部为扬子板块、北面为黔中隆起[17-21]图1)。自奥陶纪早期以来,扬子地区大量接受碳酸盐沉积,受广西运动的影响,板块的拼贴作用得到加强,黔中隆起、雪峰隆起、江南隆起与华夏古陆连为一体,该时期东南部成为大陆风化主要的物源区。同时,西部康滇古陆和川中古隆起继续扩大,被动大陆边缘开始转变为前陆盆地。早期的碳酸盐岩平台被后期水体的加深而淹没,低能、欠补偿的沉积盆地在区域上广泛发育,岩相特征开始从碳酸盐岩沉积物逐渐转变为陆相碎屑沉积物[22-24]

    Figure 1.  (a) Global paleogeography of the Upper Ordovician (450 Ma); (b) locations of study area(after Rong et al.[20]; Feng et al. [21]

    区域地层主要发育从新元古代—侏罗纪的沉积岩为主,其中碎屑岩主要发育于下寒武统、志留系和上三叠统,除此外各系主要发育碳酸盐岩。研究区域内五峰组—龙马溪组除了在局部地段缺失外,其余地段分布较好,五峰组—龙马溪组主要岩性为黑色硅质泥岩或碳质泥岩,富含笔石化石,在沉积演化上,从下至上渐变为灰黑—灰色粉砂质泥岩、含钙泥质粉砂岩夹泥灰岩。

  • 研究样品采自于贵州省遵义市习水县骑龙村附近五峰—龙马溪组剖面(图1b)。总有机碳(TOC)分析,所用仪器为Flash 2000 HT进行测试,分析精度优于0.02%。主量元素所用仪器为X荧光光谱仪(岛津XRF-1800)测试,测试元素为Si,Al,Na,K,P,Ca。微量元素测试所用仪器为电感耦合等离子质谱仪(ICP-MS),分析灵敏度小于0.5×10⁻⁹,测试精度优于5%。取样过程严格根据野外岩石分层,以便对地层地球化学进行有效控制。以上实验均在北京科绘测试有限公司完成。

    为了准确评估U和Mo元素相对于平均海相页岩的必要富集程度,一般采取用已知元素与平均页岩的Al含量进行均一化,进而可以比较所研究元素来源于陆相和海相的相对权重[25]。本文采用下面公式计算某一元素的富集系数(EF元素)评价。具体如下:

    EF element=(element/Al)sample/(element/Al)PAAS (1)

    其中元素和铝分别代表样品中某种元素和铝的含量。样品标准化采用PAAS(后Archean澳大利亚页岩)标准化数据。如果富集系数大于1,则表示该元素相对富集海相页岩端元,反之为亏损。

  • 滇黔北五峰组—龙马溪组页岩地球化学数据及地球化学参数见表1,下面从有机碳含量、营养元素、微量元素指标和化学风化强度四个方面来描述。

    地层 TOC/% δ 13Corg/‰ Ba/(μg/g) Ba/Al Ni/(μg/g) Ni/Al V/(μg/g) Cr/(μg/g) V/Cr Th/(μg/g) U/(μg/g) U/Th Mo/(μg/g) f e.U f e.Mo P2O5/% Na2O/% Al2O3/% K2O/% CaO/% CIA Al/%
    LMC Fm. 4.64 -30.27 659.46 194 100.31 30 256.36 47.23 5.43 7.32 15.37 2.10 75.01 12.28 35.10 0.1 0.49 6.42 1.81 8.42 64.39 3.40
    LMC Fm. 3.39 -30.89 762.41 281 85.5 32 200.14 54.23 3.69 6.07 13.06 2.15 46.92 13.08 27.53 0.08 0.47 5.12 1.51 11.06 61.77 2.71
    LMC Fm. 6.51 -30.57 821.47 310 138.23 52 396.62 50.41 7.87 5.92 25.02 4.23 90.11 25.61 54.04 0.1 0.27 5.01 1.44 3.79 67.46 2.65
    LMC Fm. 5.05 -30.98 677.12 294 100.25 44 262.78 52.23 5.03 5.52 17.13 3.10 50.05 20.20 34.57 0.06 0.31 4.35 1.41 5.5 63.21 2.30
    LMC Fm. 5.69 -30.26 659.28 273 118.47 49 357.32 52.12 6.86 6.01 20.19 3.36 74.09 22.66 48.71 0.09 0.37 4.57 1.41 5.49 62.67 2.42
    LMC Fm. 4.78 -30.33 823.44 309 115.23 43 343.75 48.98 7.02 5.98 22.34 3.74 65.02 22.73 38.76 0.09 0.4 5.04 1.49 7.39 63.39 2.67
    LMC Fm. 4.06 -30.47 642.26 230 134.36 48 289.56 57.1 5.07 6.14 21.34 3.48 60.05 20.77 34.23 0.07 0.48 5.27 1.51 10.97 62.20 2.79
    LMC Fm. 7.34 -30.49 875.92 319 102 37 457.6 89.88 5.09 6.42 34.45 5.37 107.08 34.05 61.98 0.11 0.39 5.19 1.52 2.75 64.24 2.75
    LMC Fm. 3.89 -30.23 836.56 387 121.09 56 156.95 43 3.65 5.91 12.34 2.09 34.27 15.51 25.23 0.14 0.5 4.08 1.36 17.03 56.80 2.16
    LMC Fm. 5.88 -30.89 765.55 298 124.45 48 464.35 62.1 7.48 6.19 30.25 4.89 120.05 31.99 74.36 0.12 0.28 4.85 1.51 2.73 65.90 2.57
    LMC Fm. 8.14 -30.45 936.15 376 156.26 63 467.7 59.68 7.84 6.74 31.01 4.60 110.13 33.77 70.25 0.11 0.37 4.71 1.48 3.31 62.87 2.49
    LMC Fm. 7.95 -30.34 682.86 263 178.45 69 460.61 128.43 3.59 7.12 38.35 5.39 119.43 40.14 73.22 0.16 0.26 4.9 1.57 2.9 66.27 2.59
    LMC Fm. 9.02 -29.94 659.12 218 162 54 594.74 131.32 4.53 7.58 49.24 6.50 130.56 44.23 68.69 0.17 0.4 5.71 1.61 10.09 65.33 3.02
    LMC Fm. 7.01 -29.69 917.33 262 159 45 686.12 119.21 5.76 9.02 49.23 5.46 150.05 38.14 68.10 0.18 0.53 6.62 1.93 8.79 63.56 3.50
    LMC Fm. 7.89 -30.82 730.56 236 126.34 41 725.53 25.54 28.41 8.31 50.31 6.05 156.05 44.19 80.28 0.2 0.48 5.84 1.72 9.09 63.19 3.09
    LMC Fm. 7.32 -29.67 687.36 229 169.32 56 683.92 156.23 4.38 8.22 49.23 5.99 114.03 44.45 60.31 0.2 0.42 5.68 1.63 11.87 64.57 3.01
    LMC Fm. 6.72 -30.9 412.80 241 151.38 88 456.48 112.25 4.07 5.41 34.91 6.45 129.83 55.26 120.38 0.31 0.43 3.24 0.88 18.06 57.98 1.71
    LMC Fm. 5.55 -29.67 364.80 218 120 72 342.86 71.25 4.81 4.12 31.12 7.55 60.91 50.51 57.91 0.35 0.39 3.16 0.73 21.06 60.56 1.67
    LMC Fm. 3.14 -29.81 448.32 247 55 30 140.19 54.34 2.58 5.32 17.15 3.22 3.04 25.65 2.66 0.71 0.36 3.43 0.99 12.01 61.08 1.82
    LMC Fm. 3.02 -30.23 660.48 198 66 20 121.45 60.44 2.01 7.34 9.12 1.24 2.05 7.42 0.98 0.22 0.8 6.3 1.68 13.82 58.76 3.33
    LMC Fm. 5.23 -29.84 762.24 194 89 23 202.47 100 2.02 8.12 31.12 3.83 130.05 21.48 52.58 0.24 0.77 7.43 1.96 8.71 61.73 3.93
    KYC Fm. 2.23 -29.88 673.92 187 70.38 20 100.41 54 1.86 8.23 7.1 0.86 7.04 5.36 3.11 0.16 0.81 6.8 1.81 20.13 59.61 3.60
    KYC Fm. 1.28 -29.55 536.64 267 68.97 34 65.83 31.21 2.11 6.12 4.23 0.69 3.14 5.71 2.48 0.31 0.62 3.8 1.04 25.39 54.68 2.01
    KYC Fm. 1.46 -29.32 515.52 256 81.43 40 58.23 35.26 1.65 6.12 3.12 0.51 3.15 4.21 2.49 0.24 0.67 3.8 1.02 24.51 53.55 2.01
    KYC Fm. 1.08 -29.51 545.28 215 127.72 50 57.02 71.24 0.80 7.23 3.15 0.44 5.01 3.37 3.14 0.16 0.81 4.79 1.43 21.46 53.28 2.54
    KYC Fm. 1.26 -29.82 545.28 212 103.43 40 60.01 41.55 1.44 7.12 3.21 0.45 4.16 3.39 2.57 0.17 0.67 4.86 1.3 20.78 57.46 2.57
    KYC Fm. 1.08 -29.72 354.24 235 74 49 41.12 51.26 0.80 4.12 2.16 0.52 4.07 3.89 4.29 0.16 0.55 2.85 0.88 20.33 50.86 1.51
    KYC Fm. 1.04 -29.66 394.56 212 95 51 45.31 48.24 0.94 7.21 2.58 0.36 5.37 3.77 4.60 0.15 0.55 3.51 1.04 17.74 54.55 1.86
    WF Fm. 2.21 -30.79 900.62 212 123 29 92.19 55.21 1.67 12.21 5.35 0.44 5.04 3.42 1.89 0.47 0.1 8.02 2.24 18.09 74.90 4.24
    WF Fm. 3.12 -30.34 823.76 148 129 23 164.21 50.12 3.28 15.78 17.21 1.09 50.01 8.39 14.28 0.19 1.25 10.52 2.65 17.45 60.21 5.57
    WF Fm. 3.22 -30.64 868.04 171 143 28 200.89 51.41 3.91 14.21 18.21 1.28 46.25 9.72 14.46 0.21 1.19 9.61 2.71 18.01 58.51 5.09
    WF Fm. 3.02 -30.25 847.09 177 119 25 188.52 45.35 4.16 13.15 20.81 1.58 45.96 11.82 15.29 0.18 1.07 9.03 2.56 17.87 59.04 4.78
    WF Fm. 3.91 -30.62 857.67 169 147 29 200.43 176.17 1.14 13.48 26.19 1.94 46.51 14.04 14.60 0.19 1.07 9.57 2.64 20.05 60.11 5.06
    WF Fm. 3.61 -30.23 807.89 171 126 27 200.31 51.12 3.92 12.16 25.49 2.10 39.41 14.62 13.24 0.19 1.08 8.94 2.31 20.01 59.72 4.73
    WF Fm. 4.21 -30.57 765.52 170 154 34 183.28 71.21 2.57 12.12 21.59 1.78 38.92 13.04 13.77 0.21 1.09 8.49 2.36 20.13 58.14 4.49
    WF Fm. 3.34 -30.37 722.02 167 138 32 183.12 69.43 2.64 11.29 15.01 1.33 41.26 9.41 15.15 0.19 1.05 8.18 2.14 20.16 58.73 4.33
    WF Fm. 3.19 -30.58 761.26 179 187 44 173.21 56.16 3.08 12.16 15.09 1.24 41.43 9.65 15.52 0.18 1 8.02 2.11 20.14 59.09 4.24
    WF Fm. 3.07 -30.54 737.78 174 157 37 156.32 31.24 5.00 11.03 14.08 1.28 38.91 9.00 14.58 0.2 1 8.02 2.07 20.51 59.28 4.24
    WF Fm. 2.99 -30.35 789.56 186 165 39 175.15 50.12 3.49 11.19 20.31 1.82 37.83 12.97 14.15 0.21 1.04 8.03 2.31 19.4 57.67 4.25
    WF Fm. 2.99 -30.52 720.34 169 139 33 212.21 60.12 3.53 11.19 20.21 1.81 39.01 12.91 14.59 0.19 0.94 8.03 2.11 15.41 60.02 4.25
    WF Fm. 4.02 -30.79 774.24 176 173 39 249.12 80.13 3.11 10.39 15.71 1.51 31.01 9.67 11.18 0.24 0.96 8.33 2.11 10.93 60.68 4.41
    WF Fm. 4.08 -30.84 968.45 180 173 32 312.25 112.14 2.78 14.07 14.19 1.01 37.02 7.18 10.97 0.14 0.84 10.14 2.71 10.48 64.16 5.37
    WF Fm. 4.09 -30.86 673.82 158 138 32 321.21 80.24 4.00 10.82 8.08 0.75 25.03 5.13 9.31 0.17 0.9 8.08 2.21 13.22 60.28 4.28
    WF Fm. 4.21 -30.82 435.28 178 80.46 33 178.41 50.31 3.55 6.46 7.32 1.13 22.04 8.14 14.36 0.07 0.5 4.61 1.21 22.89 60.98 2.44
    WF Fm. 3.17 -30.13 587.78 233 71.84 28 200.12 60.31 3.32 6.06 7.02 1.16 18.13 7.55 11.42 0.09 0.4 4.77 1.34 19.03 63.36 2.52
    WF Fm. 3.02 -30.59 545.67 264 65.8 32 200.61 50.12 4.00 5.41 7.49 1.38 25.05 9.85 19.30 0.1 0.41 3.9 1.26 16.47 59.06 2.06
    WF Fm. 2.95 -30.63 534.36 244 54.1 25 154.14 50.16 3.07 5.12 5.29 1.03 10.06 6.55 7.30 0.12 0.35 4.14 1.31 15.06 61.82 2.19
    WF Fm. 3 -30.34 527.16 218 62.4 26 162.41 48.65 3.34 5.23 5.17 0.99 12.09 5.80 7.95 0.08 0.35 4.57 1.29 12.57 64.29 2.42

    Table 1.  Geochemical data and geochemical parameters of shale from Wufeng Formation⁃Longmaxi Formation in northern Yunan⁃Guizhou area

  • 滇黔北地区龙马溪、观音桥组和五峰组的TOC含量分别为3.02%~9.02%,1.04%~1.23%,2.95%~4.21%,平均值分别为5.82%,1.35%和3.37%。TOC含量五峰组自下而上数值有所减小,观音桥组最低,至龙马溪组向上增加至最大然后降低。五峰组和龙马溪的有机碳同位素(δ 13Corg)值均在29.84%~30.98%之间,观音桥地区δ 13Corg的正偏差达到其峰值-29‰(图2)。

    Figure 2.  Stratigraphic variation of the geochemical properties of TOC and other geochemical indicators in shale from the Wufeng Formation⁃Longmaxi Formation in northern Yunan⁃Guizhou area

  • 从五峰组到龙马溪组,Ba/Al值和Ni/Al值表现出明显的变化。由于海洋沉积物中Ba的主要载体是重晶石,且按来源而言,Ba的储库可以可分为陆源、生物成因和海洋生产力有关的生物成因的重晶石,因此研究海洋中的Ba分布模式可以有效的对古海洋生物生产进行反演[26-29]。五峰组Ba/Al值为148~264,平均为187,Ni/Al值为23~44,平均31,观音桥组Ba/Al值为187~267,平均值为226,Ni/Al值为20~51,平均值为41。龙马溪组Ba/Al值值为194~387,平均为266,Ni/Al值为23~88,其中,平均值为48(图2)。

  • 氧化还原敏感金属(V,Cr,U,Th,Ni)的含量通常用于指示海水的古氧逸度。滇黔北地区,五峰组V/Cr值为1.14~5,平均为3.28,U/Th值为0.44~2.1,平均值为1.33。观音桥组V/Cr值为0.8~2.11,平均值为1.37,U/Th值为0.36~0.86,平均数为0.55。龙马溪组V/Cr值为3.65~28.41,平均值为6.06,U/Th值为3.10~7.55,平均值为4.32。总体来说,五峰组和龙马溪组中的微量元素较富集,观音桥组微量元素含量相对较亏损(图2)。

  • 在评价沉积物特征与古气候关系上,化学风化指数(CIA)可以很好的约束沉积物源区的化学风化强度[26],即化学风化指数(CIA)可以很好的反演沉积源区的古气候演化。

    由于岩石遭受化学风化的时候,K,Na,Ca等碱金属元素容易造成流失,从而造成风化产物中Al2O3与(CaO+Na2O+K2O)比值的增加,下面用CIA指标对化学风化强度进行计算:

    CIA=Al2O3/(Al2O3+CaO*+Na2O+K2O)×100% (2)

    式中:所有化学式计算均采用摩尔数,CaO*表示硅酸盐中的CaO摩尔数,由于形成沉积岩中的CaO的来源有大陆地壳风化来源同时也有海水沉积,即全岩中的CaO扣除掉化学沉积的CaO。对于CaO*的计算和校正,一般采用McLennan et al.[27]提出的公式:CaO*=CaO-(10/3×P2O5),当校正后的CaO摩尔数小于Na2O摩尔数,则采用校正后的CaO摩尔数作为CaO*摩尔数;相反,则采用Na2O摩尔数作为CaO*摩尔数代入计算。同样,由于在硅酸盐矿物风化时形成的黏土矿物对K进行吸附,所以在计算时,也必须对外来代入的K进行校正:

    K2O校正=(m×Al2O3+m×(CaO*+Na2O))/(1-m) (3)

    式中:K2O校正代表校正后的钾含量,m=K2O/(Al2O3+CaO*+Na2O+K2O)为母岩元素组分,最终可得到校正后的数值,即化学风化指数CIA值。计算结果表明,龙马溪组样品化学风化指数(CIA)为57.98~67.46,平均值为62.76。观音桥组样品化学风化指数(CIA)为50.86~57.46,平均值为54.86。五峰组样品化学风化指数(CIA)为58.81~74.90,平均值为60.87。

  • 从五峰组沉积时期到龙马溪组沉积时期,Ba/Al和Ni/Al表现出明显的变化。理论研究表明,海洋中溶解的Ba的分布与表层海水的生物生产有关[27-28],Ba主要以重晶石(BaSO4)的形式保存并输入给沉积物[28]。对于Ni元素与海洋古生产力关系而言,Ni与Cu、Zn等微量元素是衡量海洋初级生产力有效指标,研究表明Ni可能参与光合自养生产的酶相关,即表明Ni是衡量大洋沉积物有机通量或原始叶绿素通量的可靠指标[29]。滇黔北地区Ba/Al和Ni/Al值的变化表明,海洋古生产力从五峰组时期至观音桥组时期再到龙马溪组时期表现为相对稳定至逐渐增加再到逐渐下降并稳定的变化过程,可以看出,奥陶纪末至志留纪初的时间转折处,华南地区的海洋生产力存在很大的波动,特别是在赫南特阶时期的冰川期观音桥段,古海洋生产力出现了跳跃性的波动,即表明在该时期古海水性质存在重大转变。同样,从Ba和Ni等元素指示的海洋营养元素含量变化来看,经历了生物灭绝的海洋仍然具有较高的初级生产力。尽管奥陶纪晚期生物灭绝时的海洋初级生产力依然比较大,但是海洋初级生产力在短时间的波动对整个生态系统来说是一个致命的事件[30-37]

  • 沉积岩中的V,Cr,Th,U,Mo,U/Th和V/Cr等地球化学指标已被用于反演沉积环境中古氧化还原条件[38-39]。V在氧化水体和还原水体中地球化学特征具有本质性的差别。已有研究表明,V在氧化水体中其存在形式为钒酸氢根( H V O 4 2 - H 2 V O 4 - ),同理其价态也以高价的V5+存在,即在氧化水体中V以高价钒酸氢根( H V O 4 2 - H 2 V O 4 - )的形式存在不易发生沉淀。还原条件下V以+4价的VO2+离子存在,这种条件下V4+倾向于被有机质颗粒和有机颗粒络合而吸附,即在还原条件下,大量的V4+被吸附在有机质颗粒表面进而沉积下来。同样,在大洋深海环境中,V易被Mn或Fe的氢氧化物细颗粒吸附发生迁移[40],而在硫化环境中,V可以近一步被还原成V3+,此时V以固态氧化物V2O3或氢氧化物V(OH)3的形式存在[41]。同理,Cr元素在高氧逸度条件下以+6价的 C r O 4 2 - 形式存在,高氧逸度条件下不发生沉淀,在低氧逸度或硫还原条件下Cr以+3价的Cr(OH)2+等形式存在,由于Cr(OH)2+具有胶体聚沉现象,此时在沉积物中Cr(OH)2+容易被铁或锰的氢氧化物吸附而发生沉淀。在陆源沉积物中Cr能类质同象黏土矿物中的Al,而与陆源碎屑相结合[42]。据上所知,由于V与Cr在地球化学过程中随着氧逸度的变化且能够以不同的存在形式存在,所以V/Cr比值可以用来反演古水体含氧量指标,同样,U也具有类似地球化学特征。Th元素不受氧化还原条件的影响并且始终保持不相容性,因此,U/Th比值可以用于识别沉积环境的古氧化还原状态[38]。理论研究表明,V/Cr<2,U/Th<0.75解释为贫氧环境条件,2<V/Cr<4.25,0.75<U/Th<1.25解释为低氧环境条件,V/Cr>4.25,U/Th>1.25解释为厌氧环境条件。滇黔北地区五峰组—龙马溪组页岩Vr/Cr比值和U/Th比值总体上显示出缺氧环境,具体为五峰组表现为缺氧条件,观音桥组表现为厌氧条件,龙马溪组表现为缺氧条件。

    在氧化条件下,Mo或者钼的矿物与氧气和水接触时可以形成钼氧离子(MoO 4 2 - )形式而存在,在还原条件下,Mo会被还原为+4价时而进入沉积物。因此,氧化水体中Mo以稳定的钼氧离子(MoO 4 2 - )稳定存在。而在低氧逸度或硫还原环境中,由于硫化物会与Mo形成络合物,从而有利于Mo的富集。除此外,在厌氧环境中,由于水体的还原性强,不仅有利于硫酸盐的还原而且更有利于有机质的保存,进而有利于Mo元素在沉积物中的富集。所以,若沉积环境为滞留的厌氧海盆,Mo元素的补给途径为欠补偿,即Mo进入沉积物的速率大于外界海水对该厌氧海盆的补偿能力,则造成海水中的Mo浓度较亏损,同理沉积物的Mo/TOC比值也会很低(如黑海)。相反,在一个开放体系且海水流通顺畅的厌氧盆地中,海水中的Mo浓度较高,Mo/TOC比值也较高。故Mo/TOC比值可用来评估厌氧海盆的水体滞留情况[27,43-45]

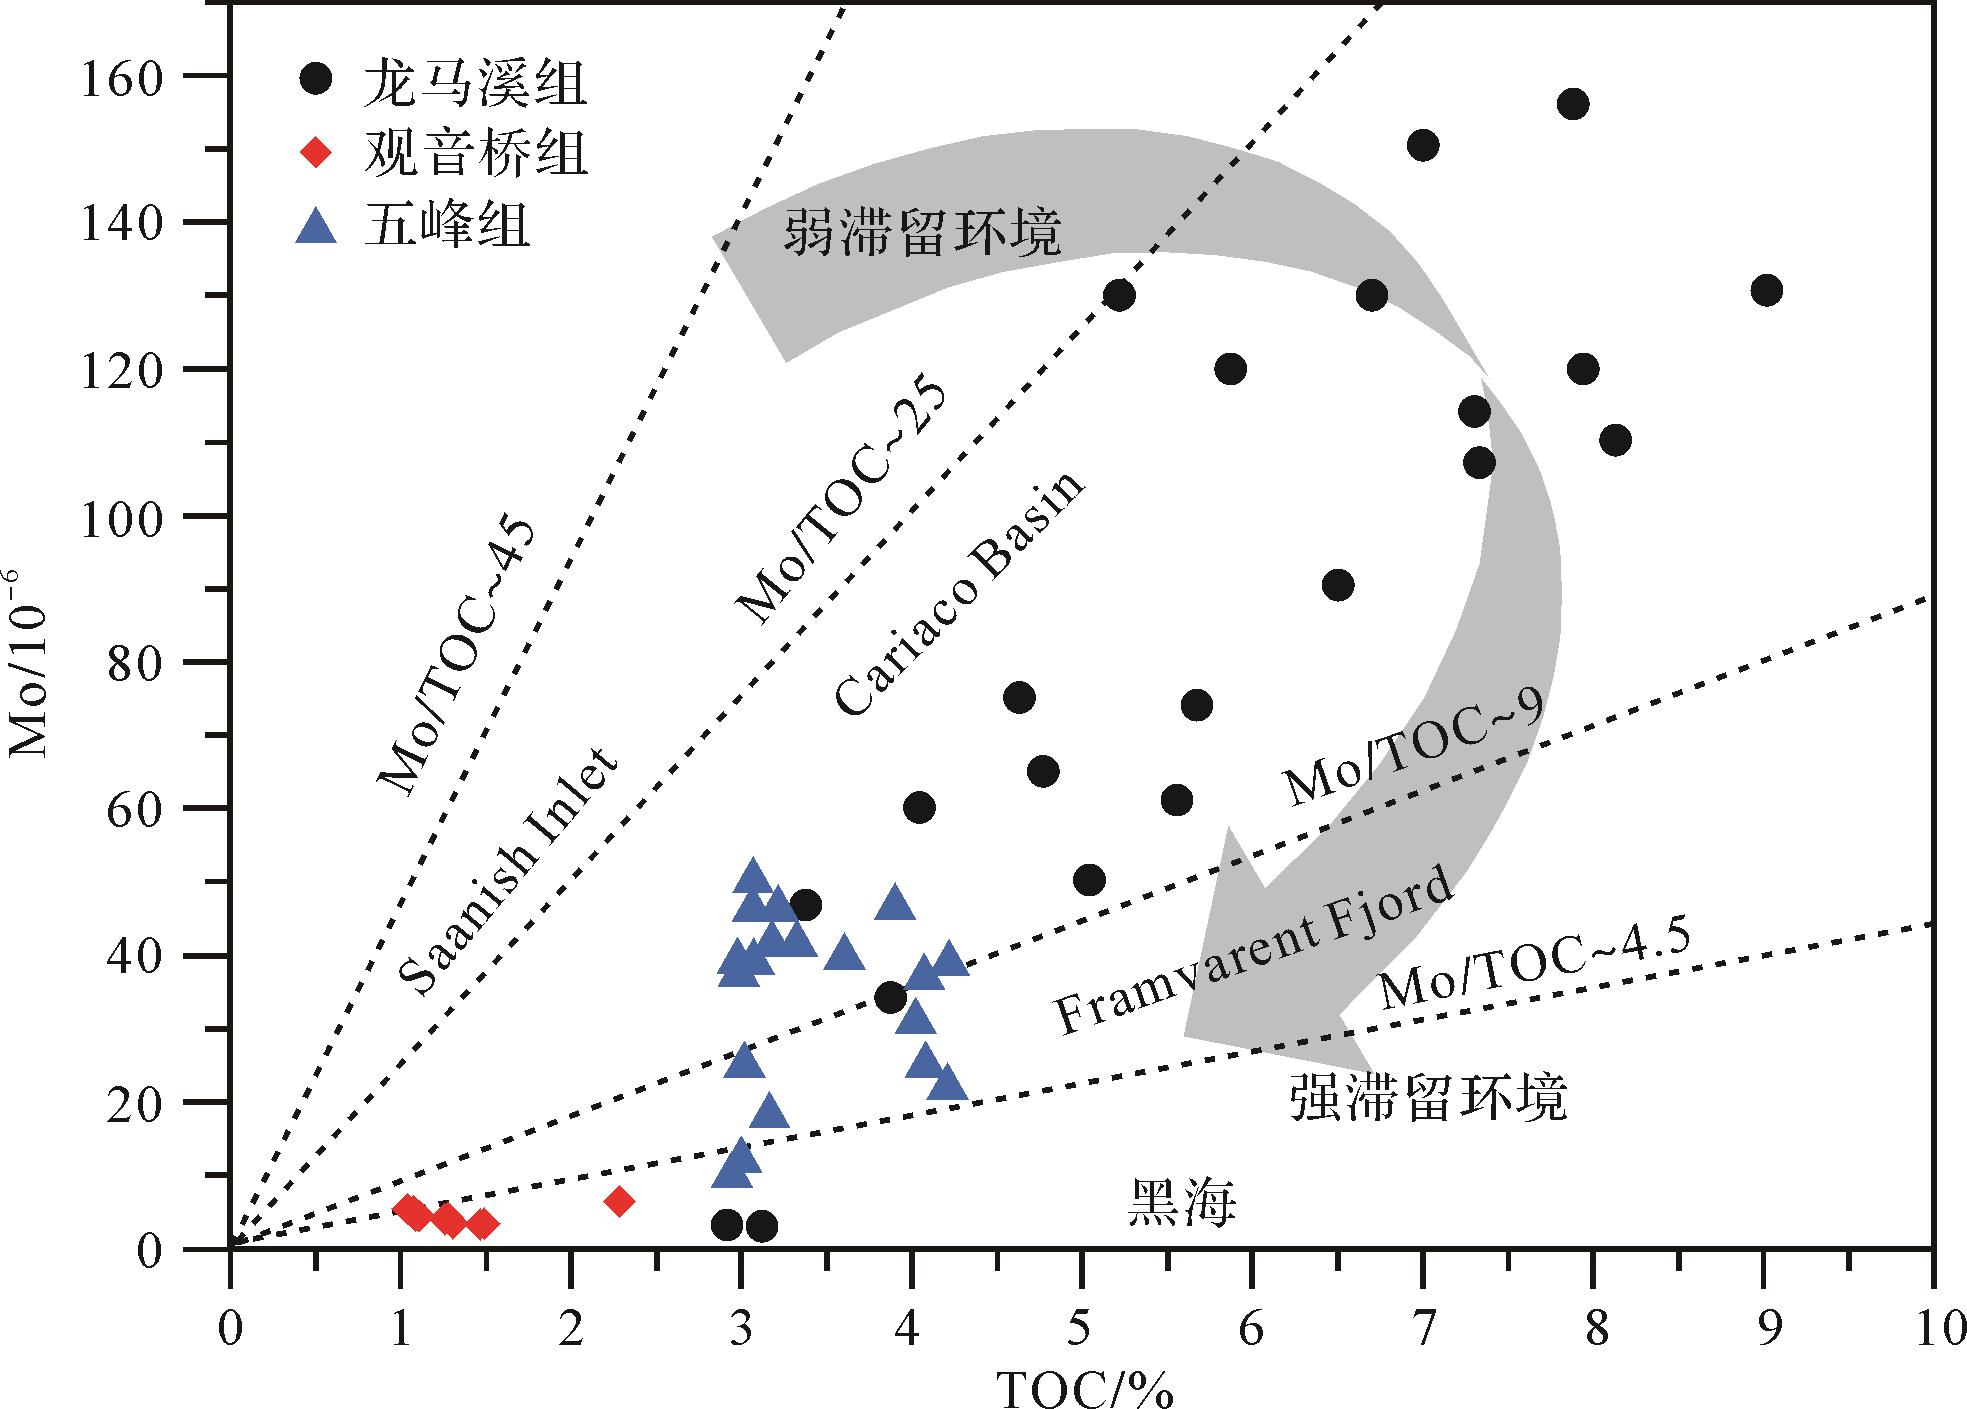
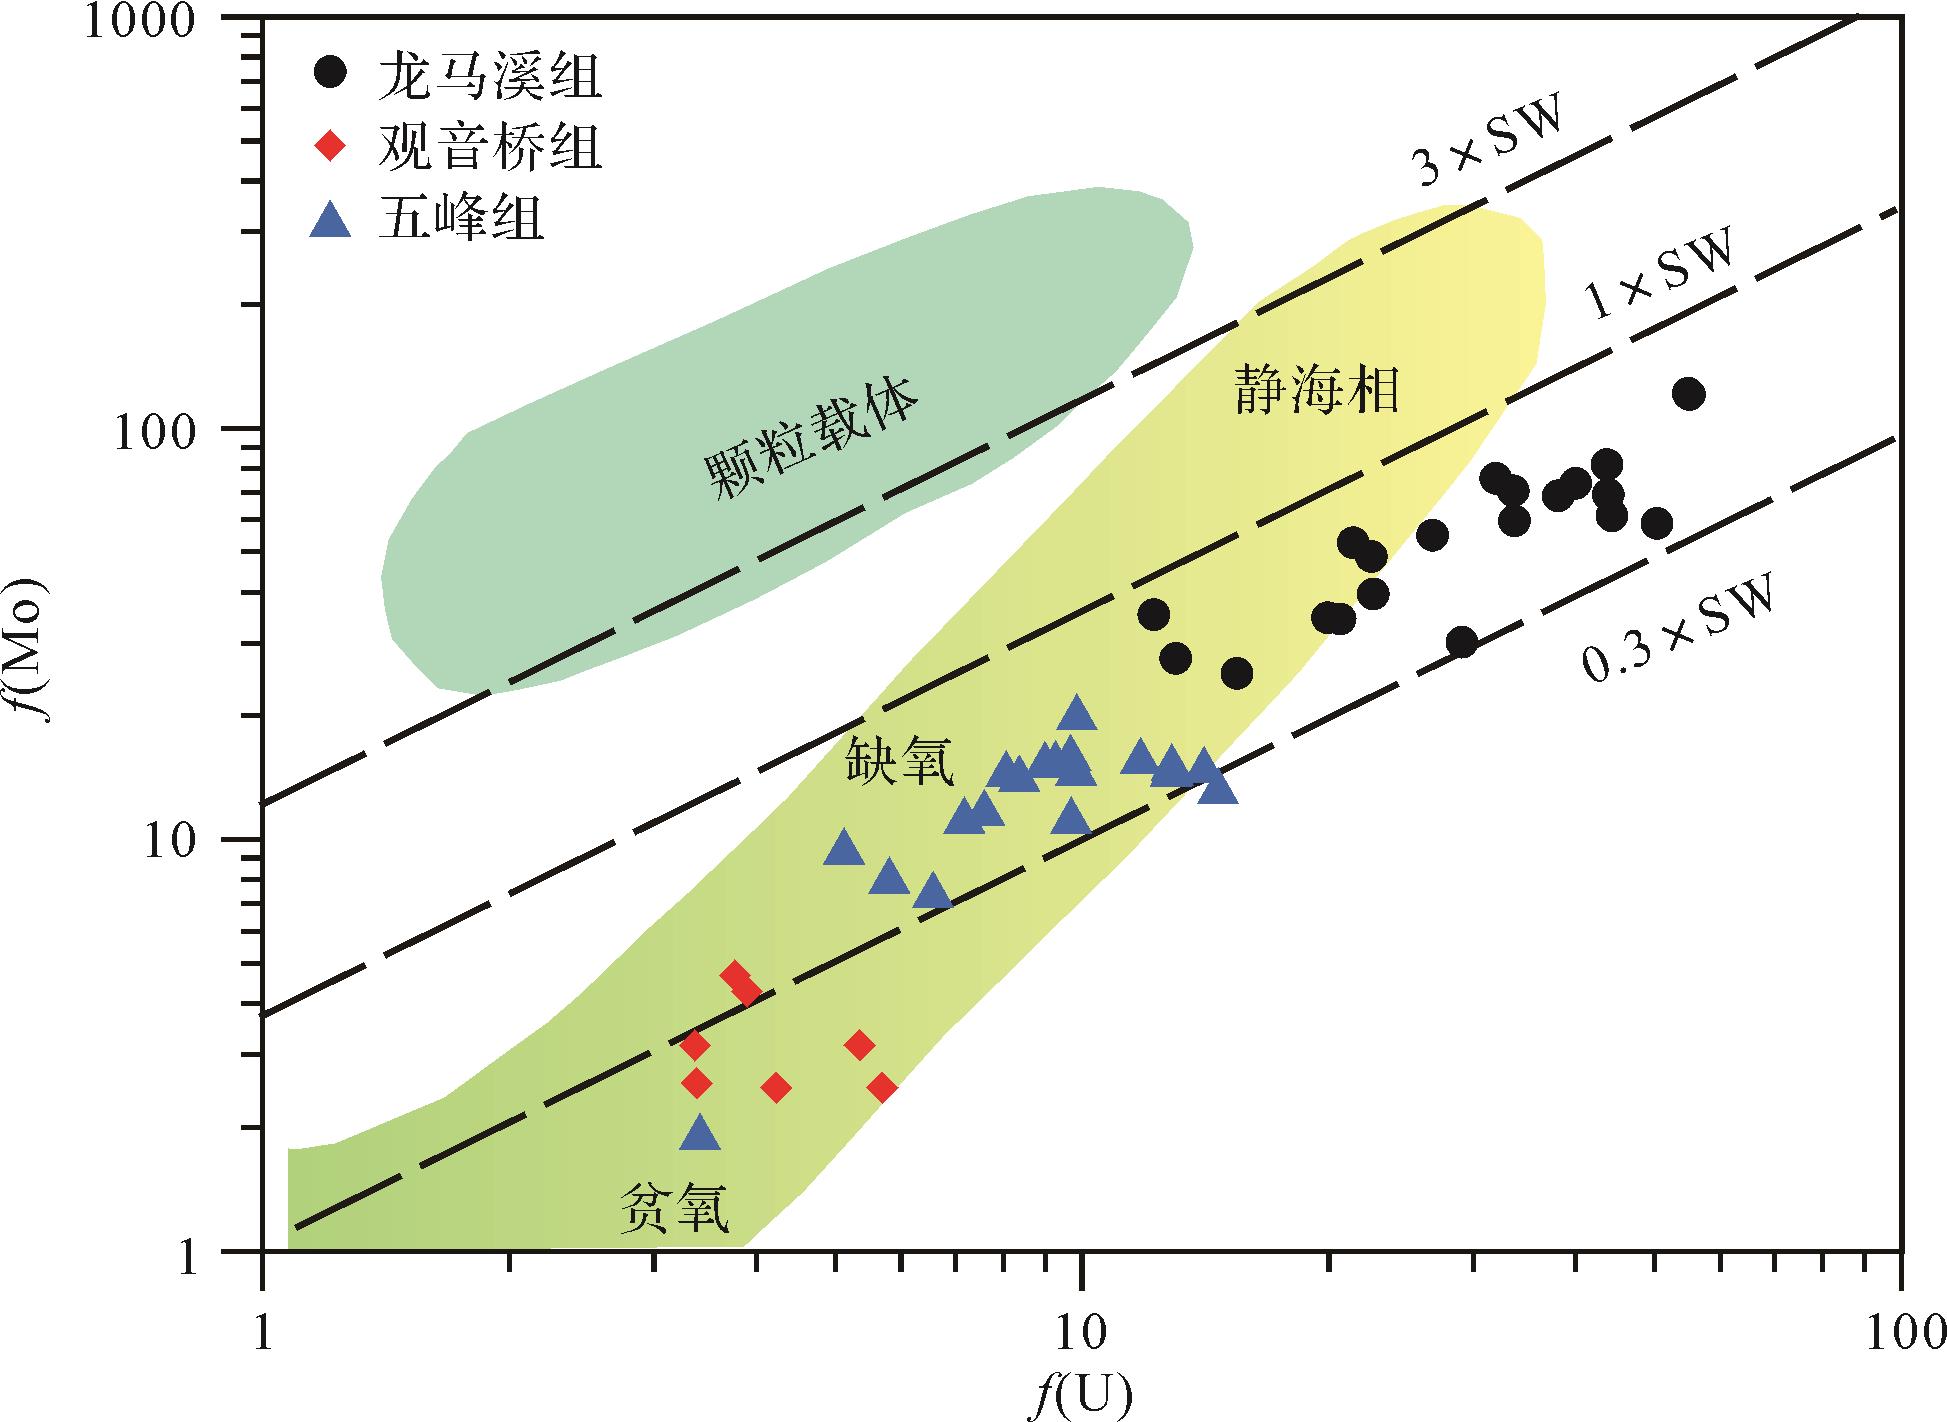
    五峰组样品形成于贫氧—厌氧环境,具体表现为TOC含量不高,Mo含量较低,Mo/TOC比值为4.03~16.03,平均为10,其沉积环境类似于黑海[25,44]图3),因此滇黔北地区五峰组处于强滞留海盆。同样,在Mo-U协变关系图解中,五峰组样品表现为在贫氧—缺氧条件,U和Mo富集系数都低,Mo/U比值也较低,低于非滞留海盆中贫氧—缺氧环境中的Mo/U比值。同时,随着还原程度的增加,五峰组页岩的Mo/U比值从0.1×SW变化到接近于1×SW。在缺氧—静海相环境中样品未表现出随着富集系数增大,即表现为Mo/U比值随之增大的趋势,且Mo/U比值低于正常开放海洋环境中海水的比值,这种特征与黑海这样的强滞留环境的U-Mo变化模式相似[25,44]图4)。结合前文讨论的Mo/TOC比值,认为五峰组沉积时期四川盆地属于强滞留海盆。

    Figure 3.  Comparison of the Mo/TOC covariant relationship between Wufeng Formation⁃Longmaxi Formation in northern Yunan⁃Guizhou area and modern anaerobic basins

    Figure 4.  f(Mo) vs. f(U) covariation for Wufeng Formation⁃Longmaxi Formation shales in northern Yunan⁃Guizhou area

    观音桥组样品,TOC含量低,Mo/TOC值也较低,为2.45~5.16,平均值为3.52,由于该组样品Mo含量过低,Mo含量过低不能排除是Mo输入量过低还是在氧化条件下Mo不容易沉淀,即这些样品不能用来判别滞留程度。

    龙马溪组Mo/TOC值在0.68~20.42,平均为14,该参数与属于半滞留环境的阿巴拉契亚中部盆地的页岩比值接近,因此,本文认为滇黔北地区龙马溪组沉积时期属于半滞留海盆。但随着TOC含量的增大,水体还原程度变强,Mo和U富集系数都增大,且在Mo与U的富集系数变化上,Mo元素富集略低于U,即表现为Mo元素输入不足,龙马溪组样品表现出这种U-Mo协变模式可能的解释是,滇黔北地区龙马溪组沉积时期为一个半滞留海盆,半滞留条件造成海盆中Mo元素的供给不足,从而约束了Mo/U比值像非滞留海盆那样持续增加,又不完全隔离的海盆又使海水能得到一定的U、Mo补给,但又不像强滞留环境那样,海水中的Mo沉淀后又得不到补充,使Mo/U比值降低。Algeo et al.[46-47]也报道了这种U-Mo变化模式属于中等滞留环境下(半滞留)的判断。因此,本文认为龙马溪组富有机质页岩形成于半滞留海盆,该认识与Mo/TOC的论证得出的结论相支持。

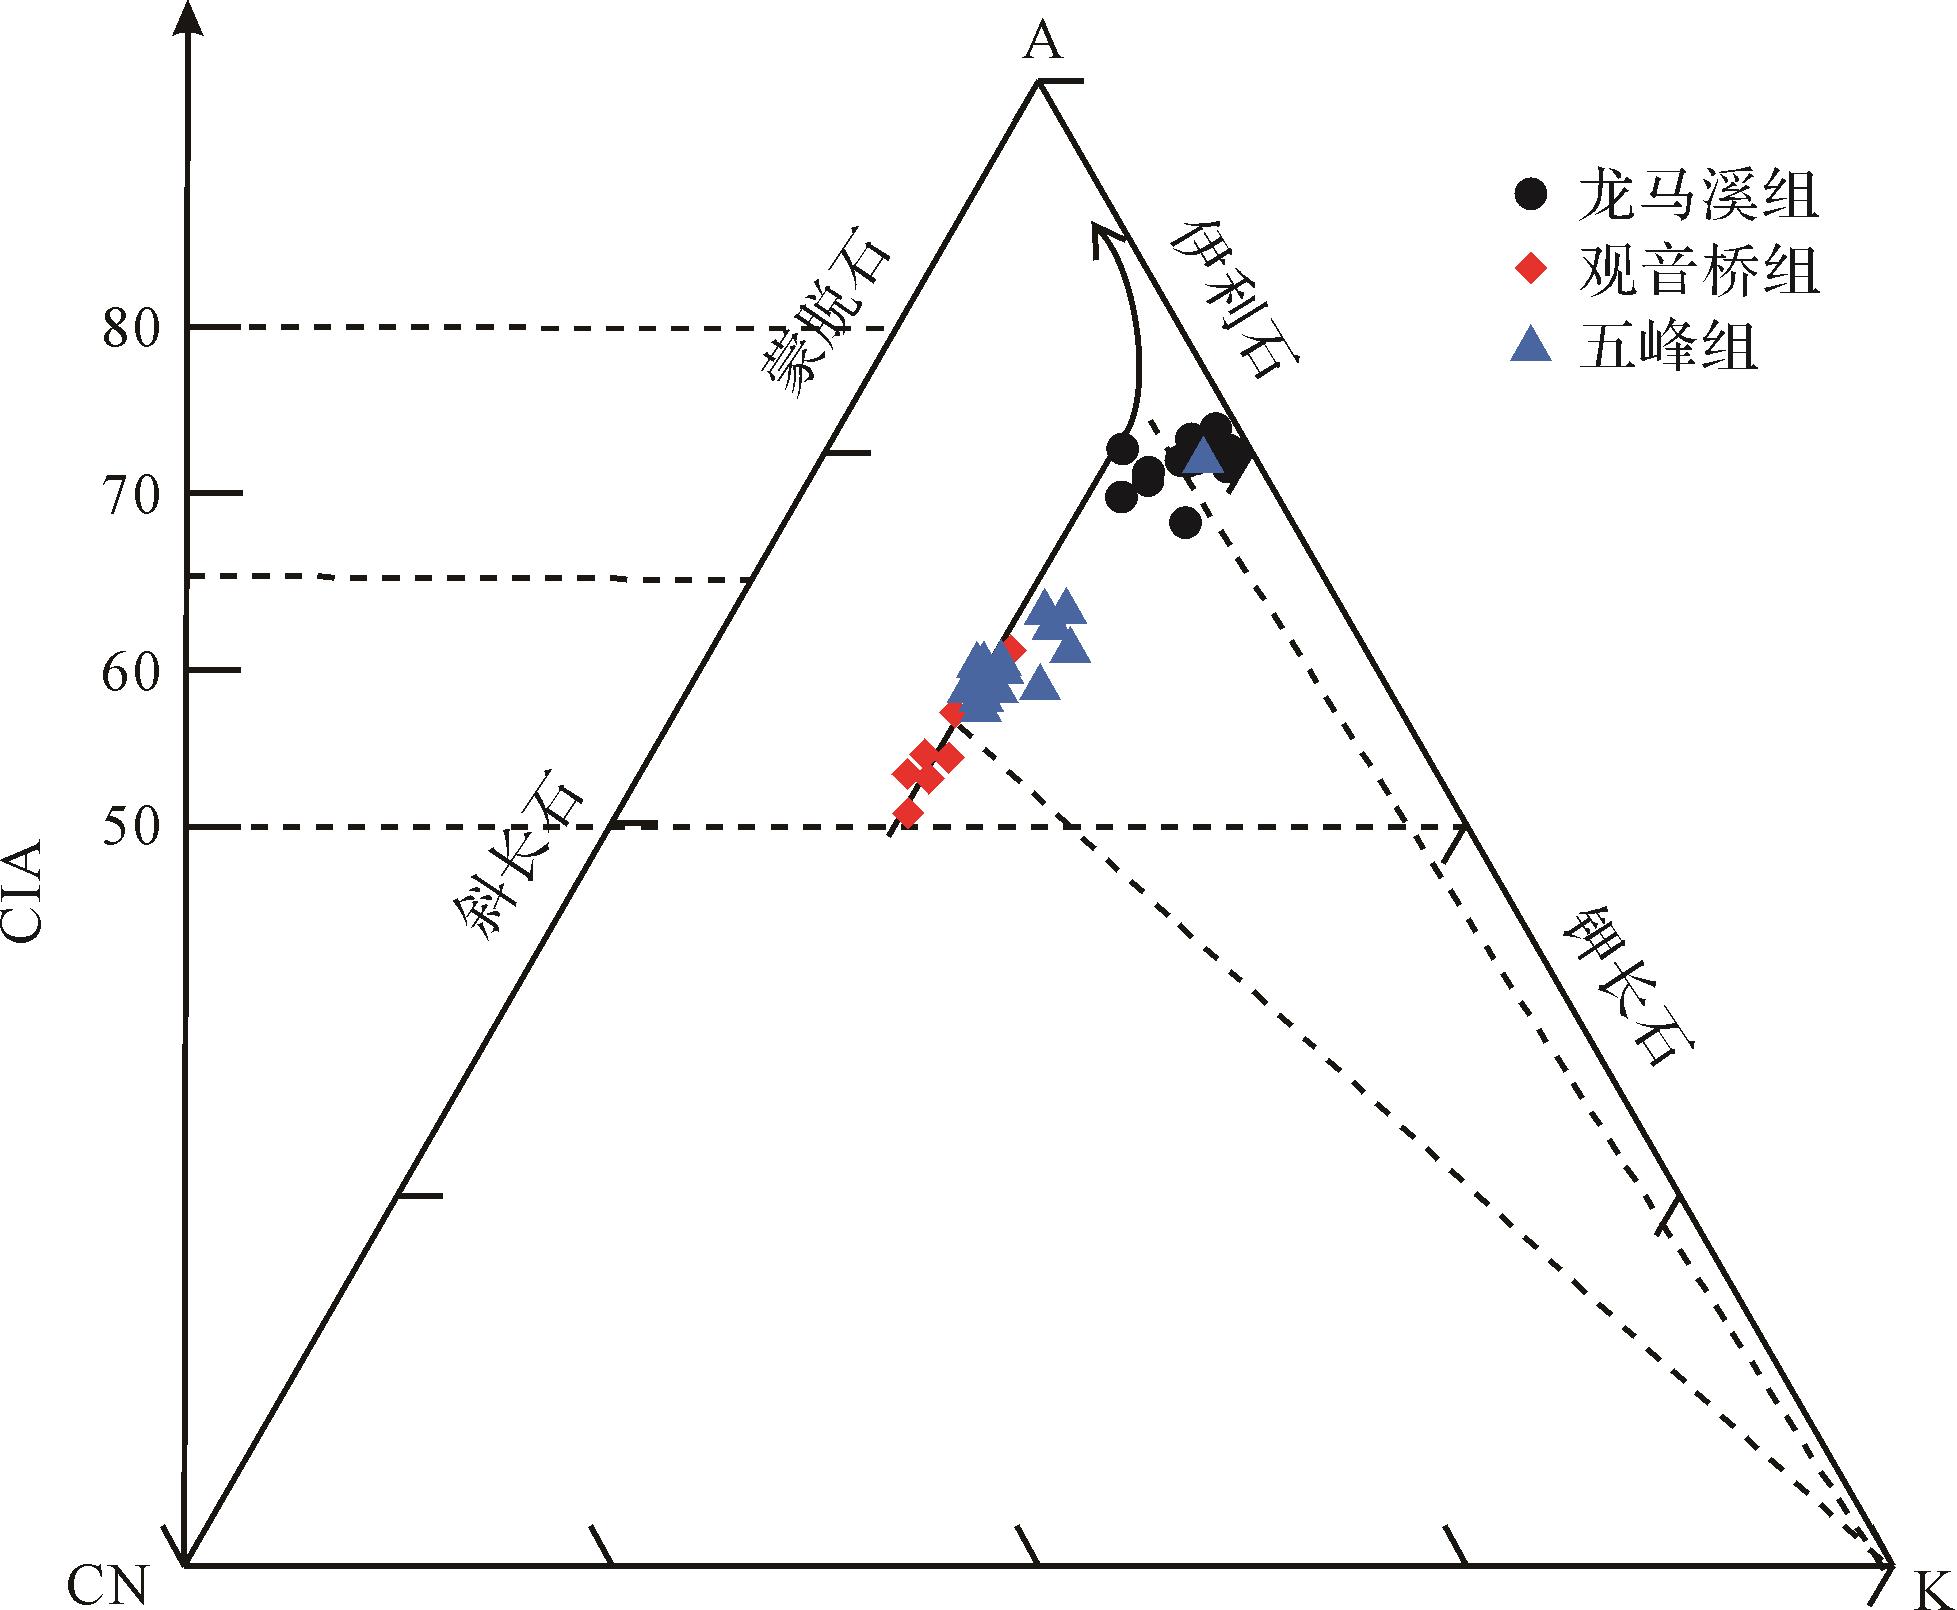
  • 风化作用的强弱严格的受温度和湿度控制,如在赤道地区的岩石受到化学风化较强,在极地地区岩石受控于物理风化作用[26,48]。通常情况下,炎热潮湿的气候化学风化程度高,化学风化指数(CIA)值在80以上。当化学风化指数(CIA)值介于70~80时,指示温暖湿润的气候,寒冷干旱气候的化学风化指数(CIA)值在50~70之间。在进行化学风化指数(CIA)计算时,由于在硅酸盐矿物风化时形成的黏土矿物时容易对K进行吸附,所以在计算时,也必须对外来代入的K进行校正[49],同样,在A-CN-K图解中,由于钾的交代作用影响,数据演化表现为偏离A-CN平行的趋势演化(图5)。经过校正后,计算结果表明,龙马溪组样品化学风化指数(CIA)为57.98~67.46,平均值为62.76,观音桥组样品化学风化指数(CIA)为50.86~57.46,平均值为54.86,五峰组样品化学风化指数(CIA)为58.81~74.90,平均值为60.87。化学风化指数(CIA)说明滇黔北地区气温在五峰组早期就开始缓慢下降,观音桥时期区域温度降至冰期,龙马溪组早期又渐渐恢复,从波动期情况来看,龙马溪组时期、观音桥时期组至五峰组时期气候处于极不稳定的状态。相比前人在扬子区域研究的成果而言[50-51],均较好的约束了五峰组—龙马溪组时期气候处于波动状态。

    Figure 5.  A⁃CN⁃K diagram of the Wufeng Formation⁃Longmaxi Formation in northern Yunan⁃Guizhou area

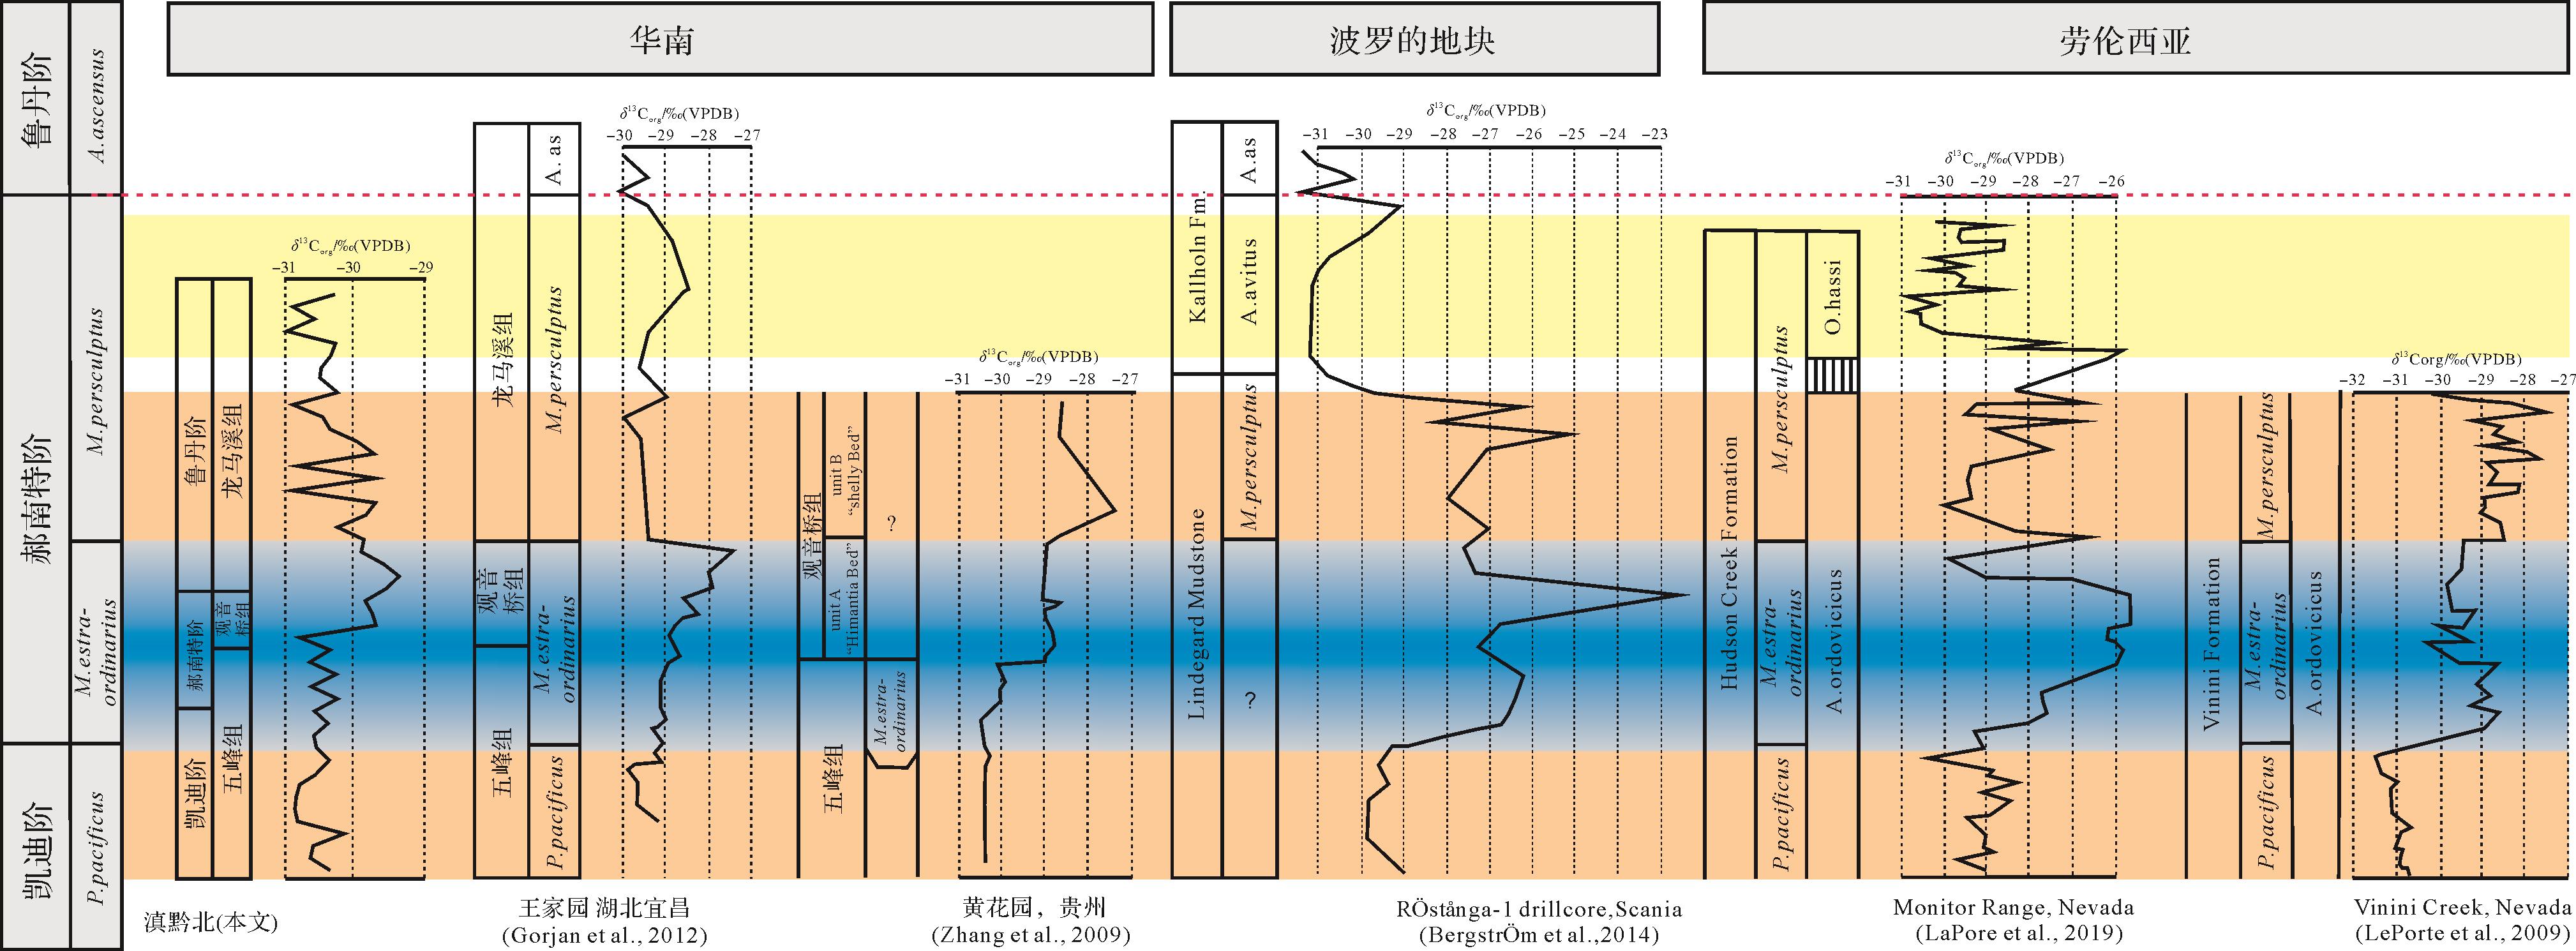
  • 已有研究表明,奥陶纪—志留纪的气候变化指示该时期的全球碳循环受到很大扰动,特别该时期的海相碳酸盐岩保存了全球碳循环扰动的记录,表现为13Ccarb13Corg的正向漂移[9,37,52-80],也称为HICE(郝南特阶碳同位素曲线漂移)事件。例如波罗的海地区,南非,华南,北美,西伯利亚等[55-60]。滇黔北地区有机碳同位素δ 13Corg曲线具有与全球奥陶纪末期其他地区相似的特征,具体表现为郝南特阶时期δ 13Corg的正漂,但是,不同地区碳同位素变化曲线的峰值并不等时,即表明在晚奥陶至志留纪时期生产力及有机碳埋藏在区域上有着很大的不同[55,63,79-80]图6),在该点上也与奥陶纪—志留纪时期的古生产力变化一致。在古生物方面,已有研究报道,奥陶纪大灭绝前的腕足动物大都栖息于温室效应的暖水环境中[60-63],而全球气候变冷后,暖水生物遭受重创而大量死亡,相反冷水的郝南特阶动物群[29,56]、正常的笔石动物群[57-58]和三叶虫组合[59-60]于大灭绝后在全球范围内大规模发育。在C同位素和S同位素关系上,δ 13Ccarbδ 13Corg同位素从凯迪阶时期最晚期或郝南特阶最早期开始均出现明显的正漂移,幅度分别达到~6‰和~3‰[61-62],相伴随的δ 34S同位素也存在明显的正漂移[59]。同样,在氧同位素上,牙形类化石氧同位素研究表明在凯迪阶的晚期到郝南特阶的早期海水表面温度有6 ℃~8 ℃的降低[64-65],除此外,在关于奥陶纪末期生物灭绝与洋流脉 冲事件方面,在高纬度地区,如中欧和非洲地区经历了两次寒流的脉冲事情和对应的两次腕足动物的灭绝,在赤道低纬度地区,如华南、北欧和阿瓦隆尼亚陆块只经历了郝南特阶时期寒流脉冲事件和生物灭绝事件[60]。到目前为止,国内外众多学者分别从气候变化、有机碳埋藏和碳酸盐岩风化三个角度对郝南特阶冰期成因提出假说[41,55,66-69]。但是越来越多的证据显示,三种假说的可靠性需要进一步的验证[8,11-12,55,60,62,70-76]

    Figure 6.  Comparison of Hirnantian in δ 13Ccrab from representative section in South China, Baltica and Laurentia(after LaPorte et al.[55]; Grojan et al.[63]; Zhang et al.[79]; Bergström et al.[80])

    五峰组沉积时期由于冈瓦纳大陆冰川的形成导致全球海平面广泛海退,在该时期华南地区域因加里东构造运动,盆地演化经历了被动大陆边缘到前陆盆构造旋回[17-24],滇黔北地区水体相对变浅,与大洋水体的交换受到阻碍,即五峰组时期滇黔北地区海水滞留程度较强。进入志留纪,由于古气候迅速转暖,位于冈瓦纳大陆的冰盖快速消融,冰川的大量融化造成大规模的海侵。这次海侵阶段华南地区与全球性志留纪初的海侵界限一致[20,43],即表明在奥陶纪—志留纪时期全球经历了海退—海进的演化序列。全球海退的原因除了有局部构造引起的抬升外,特别是奥陶纪时期南极地区冰川急剧发育而导致海退[67],冰期主控的全球海平面大幅度下降剥夺了原本生活在大陆架和浅海动物群的栖息地[68],同时由于南极冈瓦纳地区冰川的发育改变了全球大洋的洋流循环模式、强度和大洋水体理化性质[68],已有研究报道,郝南特阶时期内华达地区方解石氧同位素突变是由于区域内洋流循环模式的突变而改变[75],南极冰盖大规模发育时期即冰盛时期大洋深部水体被缺氧的硫化层所占据,导致水底栖息生物和自游等生物灭绝[70],同时在区域上升流以及大陆风化的共同作用下,大量磷的输入和区域磷的大量富集进一步使得该时期海底普遍缺氧和有机碳的大量保存[73]。在海侵阶段,由于冰川消融,海平面快速上升,洋流循环停滞,喜欢冷水的郝南特阶动物群消亡[76-84],即出现温室的状态,由于海平面的上升早期的滞留盆地变变为半滞留盆地,水体变深且缺氧,氧化敏感(U、Mo)元素大量富集,这也为海侵后大洋表层生物的繁盛提供物质来源。

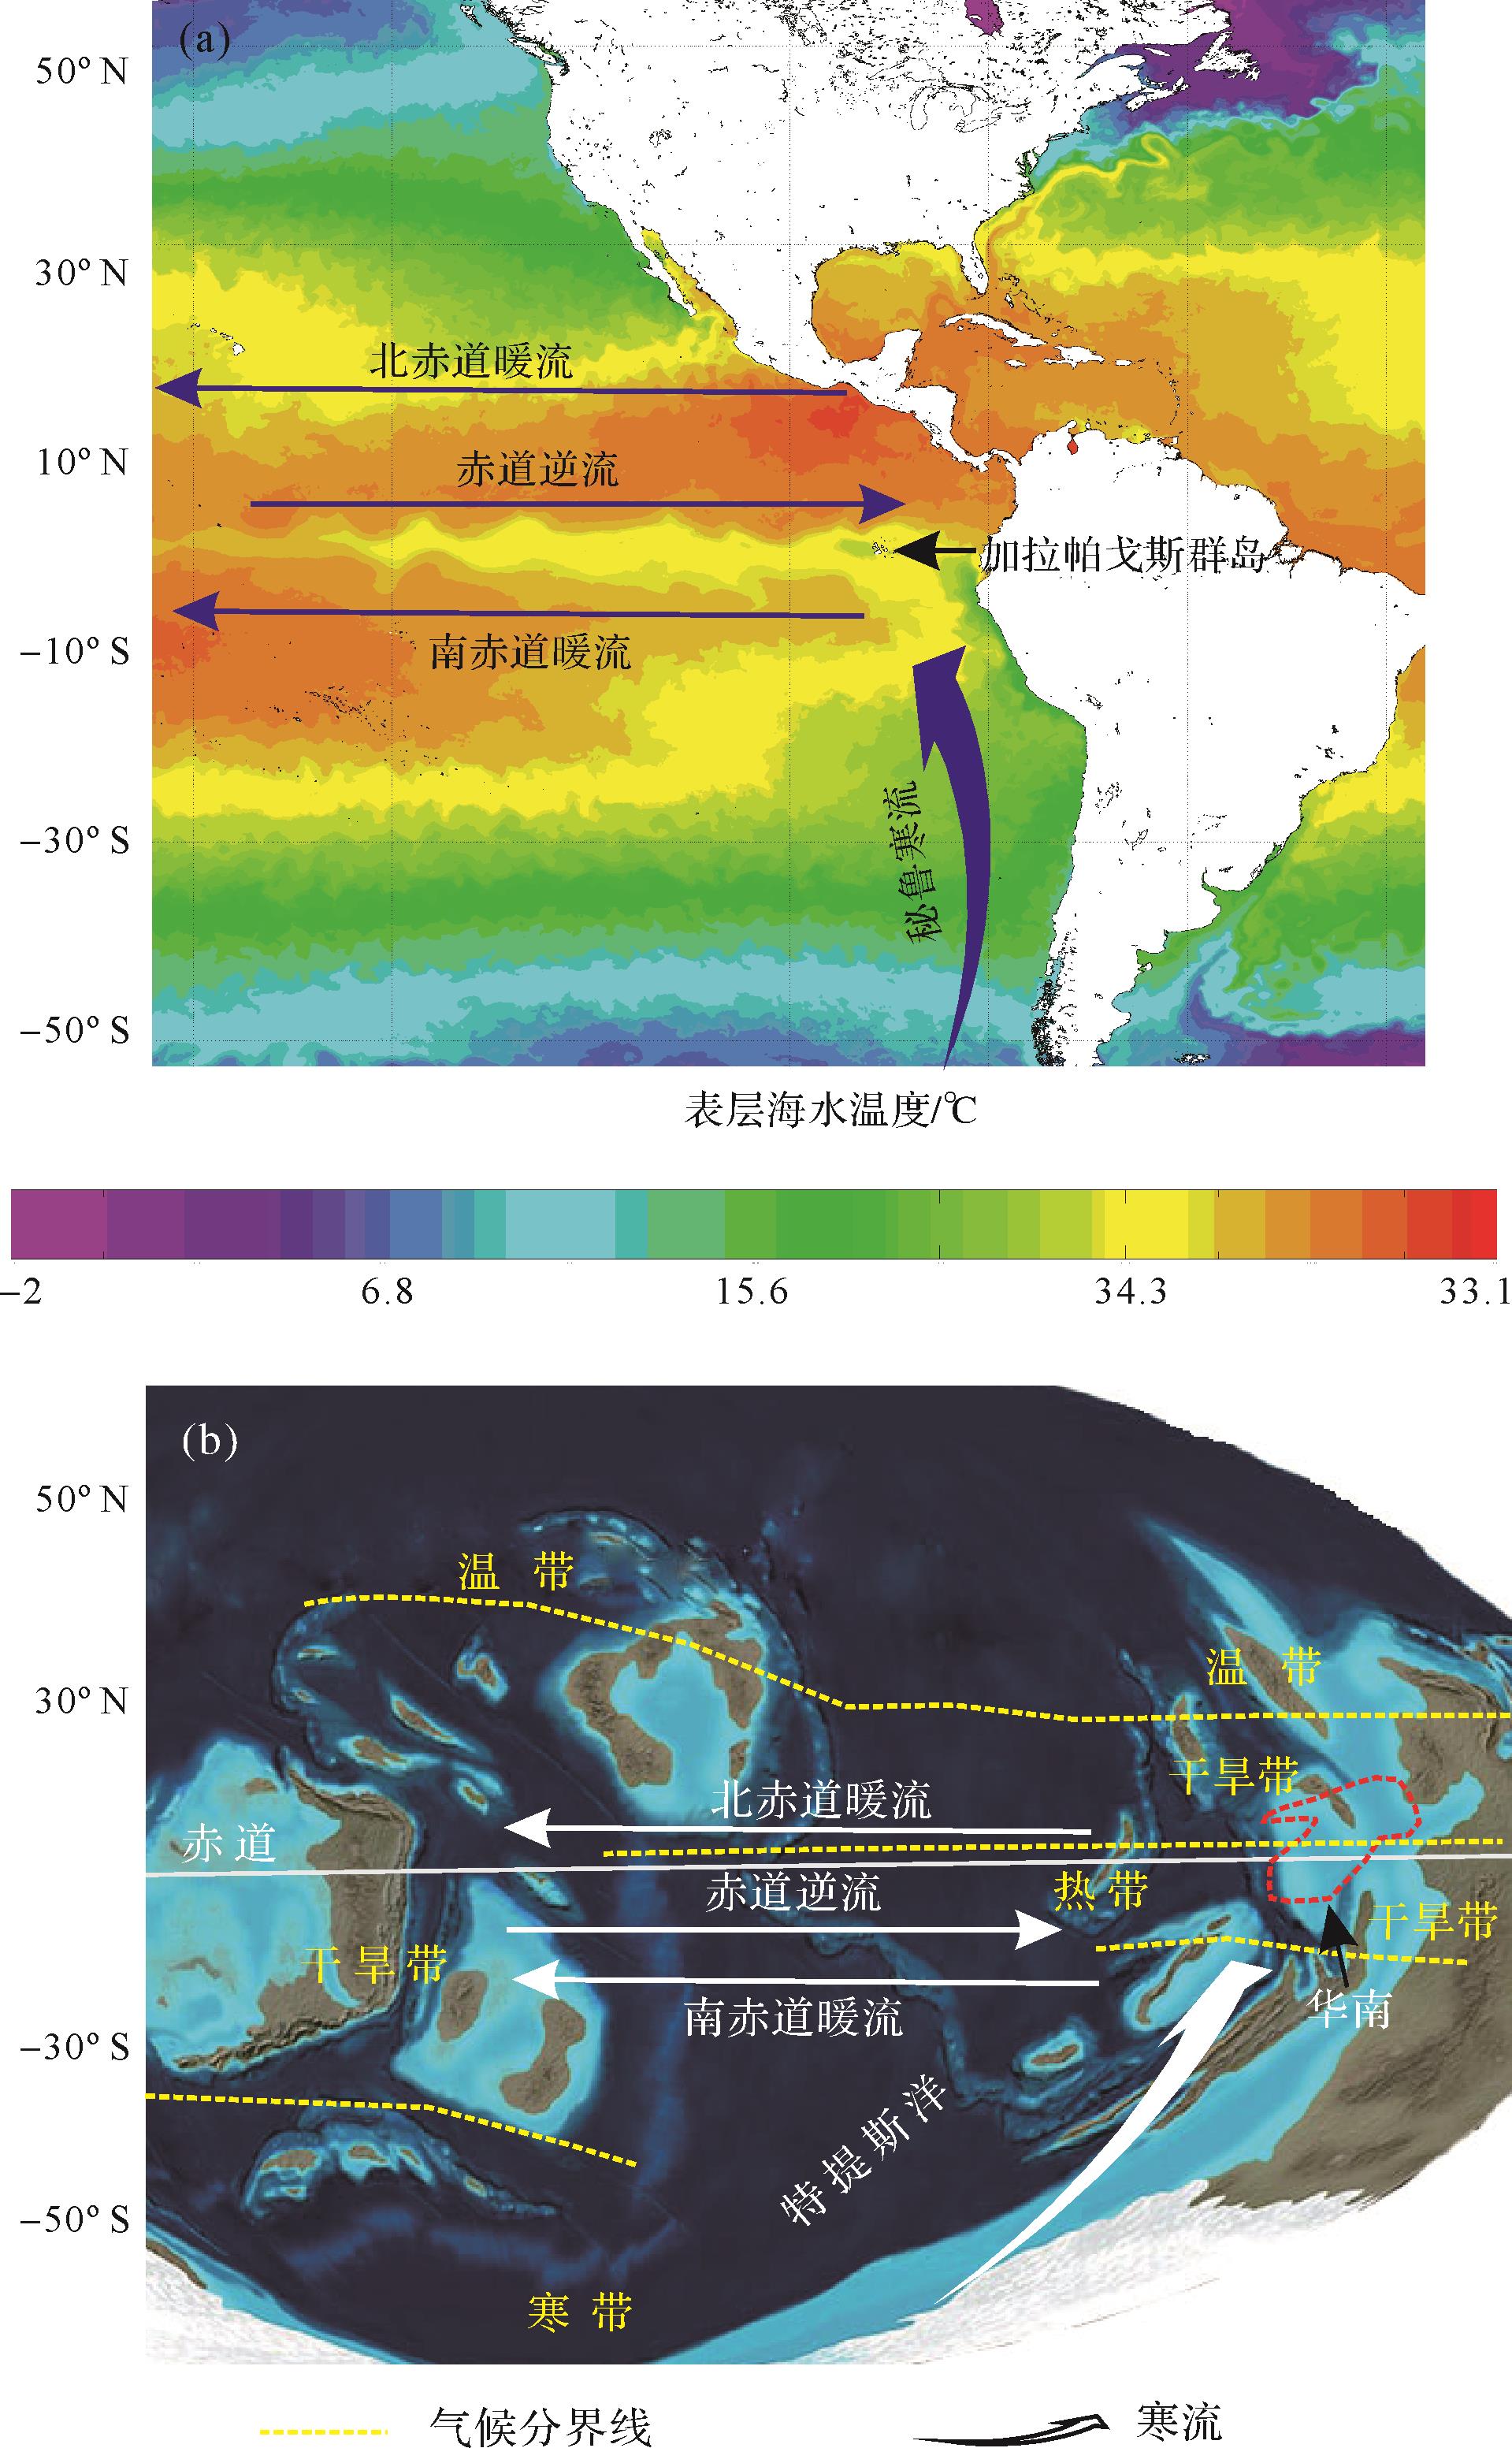
  • 已有研究表明,奥陶纪时期的古地理与其他地质时代有着显著不同[82]:陆地上基本没有植被,大气中的氧气含量高于现代水平(PAL)[83-86],全球发生大规模海侵[20,43,83-84],较高的pCO2(8~18PAL)水平维持了温室的气候条件[85-89]。在奥陶纪晚期,华南地区的气候类型仍属于典型的暖干的赤道类型[90-91]图7b),特别是在全球的气候模式上,同时由于该时期海陆破碎的分布模式使得季风气候十分发育[92]。已有的模型表明,重大的极端气候变化可能是由于大洋和大陆在时空上的重新分布造成的,特别是当板块构造重建时近赤道洋流存在时,温室出现很普遍[93]。通常,热带东太平洋表面赤道附近表层海水温度是以东冷西暖为特征(图7a),即在赤道东太平洋存在一个冷水区,该冷水区被称为“赤道东太平洋冷舌”,在现代海洋中,“赤道东太平洋附近冷舍”对全球CO2循环、全球气候的有规律的变化有重要影响。在古生物、沉积学和地球化学的证据表明,奥陶纪末期位于赤道附近的华南板块受到来自冈瓦纳大陆西岸寒流的影响[93]。在海陆分布与洋流分布模式方面,奥陶纪时期,冈瓦纳大陆主要集中在南极附近,向北延伸穿过赤道到达北半球中纬度地区,即奥陶纪时期冈瓦纳大陆在经度上有很大展布,这种海陆分布模式更加有利于高纬度极地地区冷的海水和冷的空气与低纬度赤道地区的高温海水与高温空气交换[94]。在海陆分布上,奥陶纪时期的华南地区位于冈瓦纳大陆西侧且位于来自与极地寒流的要冲位置,该种地理格局的分布同现代南美洲地区的加拉帕戈斯群岛和秘鲁寒流的关系类似[90-94],因此,本文认为奥陶纪末期生物大灭绝可能是在海陆分布格局下洋流作用导致。

    Figure 7.  Upper Ordovician paleogeography, showing similarity between equatorial positions of South China Plate and modern Galápagos Islands

  • (1) 滇黔北地区Ba/Al和Ni/Al值的变化表明,五峰组海洋生产力相对稳定,从五峰组开始逐渐增加,直到观音桥组达到顶峰随之然下降,在龙马溪组段又开始上升,随后逐渐减小并稳定下来,特别在赫尔南特阶时期的观音桥组,生产力出现了跳跃性的波动,即表明奥陶纪末期古海水性质存在重大转变。

    (2) 滇黔北的Vr/Cr比值和U/Th比值总体上显示出,五峰组表现为缺氧环境,观音桥组表现为厌氧环境,龙马溪组表现为缺氧环境,U-Mo协变模式表明滇黔北地区五峰组时期为强滞留海盆,龙马溪组时期属于半滞留海盆。化学风化值指数(CIA)表明滇黔北地区气温在五峰组早期就开始缓慢下降, 观音桥时期区域温度降至冰期,龙马溪组早期又渐渐恢复,但从龙马溪组到观音桥组至五峰组时期气候处于极不稳定的状态。

    (3) 奥陶纪末期生命大灭绝是在极地冰川发育条件的背景下,洋流模式、强度和海水的理化性质的改变导致,两者受海陆分布格局控制。

Reference (94)

Catalog

    /

    DownLoad:  Full-Size Img  PowerPoint
    Return
    Return