Advanced Search
Volume 41 Issue 6
Dec.  2023
Turn off MathJax
Article Contents

SONG ZeZhang, LÜ MingYang, ZHAO LiBin, ZHANG YueQiao, HE YuanYuan, JIANG FuJie, YANG ZhenZhong, CHEN WeiYe, HUO LiNa, WANG Rui, LIANG Xiao. Fractal-based Permeability Prediction Model for Tight Sandstone[J]. Acta Sedimentologica Sinica, 2023, 41(6): 1847-1858. doi: 10.14027/j.issn.1000-0550.2023.046
Citation: SONG ZeZhang, LÜ MingYang, ZHAO LiBin, ZHANG YueQiao, HE YuanYuan, JIANG FuJie, YANG ZhenZhong, CHEN WeiYe, HUO LiNa, WANG Rui, LIANG Xiao. Fractal-based Permeability Prediction Model for Tight Sandstone[J]. Acta Sedimentologica Sinica, 2023, 41(6): 1847-1858. doi: 10.14027/j.issn.1000-0550.2023.046

Fractal-based Permeability Prediction Model for Tight Sandstone

doi: 10.14027/j.issn.1000-0550.2023.046
Funds:

CNPC Science and Technology Innovation Fund 2021DQ02-0105

National Natural Science Foundation of China 41802148

Major Science and Technology Projects of Sichuan Kelite Oil and Gas Technology Service Co., Ltd SCKLT-JSZS-2022-0044

Major Science and Technology Projects of Tarim Oilfield Company, PetroChina TXN011020120001

  • Received Date: 2023-05-22
  • Accepted Date: 2023-07-18
  • Rev Recd Date: 2023-05-29
  • Available Online: 2023-07-18
  • Publish Date: 2023-12-10
  • Permeability is a key factor that determines the seepage capacity of tight sandstone reservoirs and ultimately determines productivity. Objective Owing to the complex pore structure and strong heterogeneity of tight sandstone reservoirs, the permeability exhibits significant variation and is difficult to predict. Thus, it is urgent to develop a permeability prediction model suitable for tight sandstones. Methods Taking the Cretaceous Bashijiqike tight sandstone in the Keshen2 gas reservoir of the Kuqa Depression of the Tarim Basin as the research object,, we qualitatively and quantitatively characterized the pore structure of tight sandstones by integrating routine physical analysis, microscopic observation based on thin section and scanning electron microscope, high-pressure mercury injection, nuclear magnetic resonance and fractal theory. Results Based on fractal theory and fully considering the influence of pore structure heterogeneity on permeability, two novel tight sandstone permeability prediction models based on fractal theory were proposed. Conclusion Compared with the rapex permeability prediction model, the permeability prediction accuracy of the r20 fractal model and the SDR(>40) fractal model increased by 42% and 20%, respectively.
  • [1] 吴晓智,柳庄小雪,王建,等. 我国油气资源潜力、分布及重点勘探领域[J]. 地学前缘,2022,29(6):146-155.

    Wu Xiaozhi, Xiaoxue Liuzhuang, Wang Jian, et al. Petroleum resource potential, distribution and key exploration fields in China[J]. Earth Science Frontiers, 2022, 29(6): 146-155.
    [2] Dai J X, Ni Y Y, Wu X Q. Tight gas in China and its significance in exploration and exploitation[J]. Petroleum Exploration and Development, 2012, 39(3): 277-284.
    [3] Rezaee R, Saeedi A, Clennell B. Tight gas sands permeability estimation from mercury injection capillary pressure and nuclear magnetic resonance data[J]. Journal of Petroleum Science and Engineering, 2012, 88-89: 92-99.
    [4] Yan W C, Sun J M, Dong H M, et al. Investigating NMR-based absolute and relative permeability models of sandstone using digital rock techniques[J]. Journal of Petroleum Science and Engineering, 2021, 207: 109105.
    [5] Wang F Y, Wang L. Pore structure analysis and permeability prediction of shale oil reservoirs with HPMI and NMR: A case study of the Permian Lucaogou Formation in the Jimsar Sag, Junggar Basin, NW China[J]. Journal of Petroleum Science and Engineering, 2022, 214: 110503.
    [6] Yin X D, Jiang S, Chen S Jet al. Impact of rock type on the pore structures and physical properties within a tight sandstone reservoir in the Ordos Basin, NW China [J]. Petroleum Science, 2020, 17(4): 896-911.
    [7] Timur A. An investigation of permeability, porosity, & residual water saturation relationships for sandstone reservoirs[J]. The Log Analyst, 1968, 9(4): 8.
    [8] Hassall J K, Ferraris P, Al-Raisi M, et al. Comparison of permeability predictors from NMR, formation image and other logs in a carbonate reservoir[C]//Proceedings of the Abu Dhabi international conference and exhibition. Abu Dhabi: SPE, 2004: 1-13.
    [9] Peng L, Zhang C, Ma H L, et al. Estimating irreducible water saturation and permeability of sandstones from nuclear magnetic resonance measurements by fractal analysis[J]. Marine and Petroleum Geology, 2019, 110: 565-574.
    [10] Purcell W R. Capillary pressures - their measurement using mercury and the calculation of permeability therefrom[J]. Journal of Petroleum Technology, 1949, 1(2): 39-48.
    [11] Kolodzie S. Analysis of pore throat size and use of the Waxman-Smits equation to determine ooip in spindle field, Colorado[C]//Proceedings of the SPE annual technical conference and exhibition. Dallas: SPE, 1980: 21-24.
    [12] Pittman E D. Relationship of porosity and permeability to various parameters derived from mercury injection-capillary pressure curves for sandstone[J]. AAPG Bulletin, 1992, 76(2): 191-198.
    [13] Rezaee M R, Jafari A, Kazemzadeh E. Relationships between permeability, porosity and pore throat size in carbonate rocks using regression analysis and neural networks[J]. Journal of Geophysics and Engineering, 2006, 3(4): 370-376.
    [14] Swanson B F. A simple correlation between permeabilities and mercury capillary pressures[J]. Journal of Petroleum Technology, 1981, 33(12): 2498-2504.
    [15] Coates G R, Marschall D, Mardon D, et al. A new characterization of bulk-volume irreducible using magnetic resonance[J]. The Log Analyst, 1997, 39(1): 51-63.
    [16] Kenyon W E, Day P I, Straley C, et al. A three-part study of NMR longitudinal relaxation properties of water-saturated sandstones[J]. SPE Formation Evaluation, 1988, 3(3): 622-636.
    [17] Chang D H, Vinegar H J, Morriss C, et al. Effective porosity, producible fluid, and permeability in carbonates from NMR logging[J]. The Log Analyst, 1997, 38(2): 60-72.
    [18] Wu F, Li Y, Burnham B, et al. Fractal-based NMR permeability estimation in tight sandstone: A case study of the Jurassic rocks in the Sichuan Basin, China[J]. Journal of Petroleum Science and Engineering, 2022, 218: 110940.
    [19] Song Z Z, Zhao J Y, Zhang Y Y, et al. Bi-fractal characterization of the pore network of tight sandstone[J]. Frontiers in Earth Science, 2021, 9: 751944.
    [20] Mandelbrot B B. The fractal geometry of nature[M]. New York: Freeman, 1982: 1-532.
    [21] Song Z Z, Liu G D, Yang W W, et al. Multi-fractal distribution analysis for pore structure characterization of tight sandstone: A case study of the Upper Paleozoic tight formations in the Longdong district, Ordos Basin[J]. Marine and Petroleum Geology, 2018, 92: 842-854.
    [22] Pape H, Clauser C, Iffland J. Permeability prediction based on fractal pore-space geometry[J]. Geophysics, 1999, 64(5): 1447-1460.
    [23] 曾联波,刘国平,朱如凯,等. 库车前陆盆地深层致密砂岩储层构造成岩强度的定量评价方法[J]. 石油学报,2020,41(12):1601-1609.

    Zeng Lianbo, Liu Guoping, Zhu Rukai, et al. A quantitative evaluation method of structural diagenetic strength of deep tight sandstone reservoirs in Kuqa Foreland Basin[J]. Acta Petrolei Sinica, 2020, 41(12): 1601-1609.
    [24] Su M M, Han D L, Zhang R H, et al. Tectonic factors restricting differences among layers in microstructure of ultradeep clastic rock reservoir: A case study on Cretaceous Bashijiqike Formation in Kuqa Depression[J]. Lithosphere, 2023, 2023(Suppl.13): 7638953.
    [25] Zhang S C, Zhang B, Zhu G Y, et al. Geochemical evidence for coal-derived hydrocarbons and their charge history in the Dabei gas field, Kuqa thrust belt, Tarim Basin, NW China[J]. Marine and Petroleum Geology, 2011, 28(7): 1364-1375.
    [26] 徐珂,张辉,鞠玮,等. 库车坳陷博孜X区块超深储层有效裂缝分布规律及对天然气产能的影响[J]. 地球科学, 2023,48(7): 2489-2505.

    Xu Ke, Zhang Hui, Ju Wei, et al. Effective fracture distribution and its influence on natural gas productivity of ultra-deep reservoir in Bozi-X block of Kuqa Depression[J]. Earth Science, 2023,48(7): 2489-2505.
    [27] Lai J, Wang G W, Cao J T, et al. Investigation of pore structure and petrophysical property in tight sandstones[J]. Marine and Petroleum Geology, 2018, 91: 179-189.
    [28] Shen Y Q, Lü X X, Guo S, et al. Effective evaluation of gas migration in deep and ultra-deep tight sandstone reservoirs of Keshen structural belt, Kuqa Depression[J]. Journal of Natural Gas Science and Engineering, 2017, 46: 119-131.
    [29] Coates G R, Xiao L Z, Prammer M G. NMR logging: Principles and applications[M]. Houston: Haliburton Energy Services Publication, 1999: 1-234.
    [30] Hou X W, Zhu Y M, Chen S B, et al. Investigation on pore structure and multifractal of tight sandstone reservoirs in coal bearing strata using LF-NMR measurements[J]. Journal of Petroleum Science and Engineering, 2020, 187: 106757.
    [31] Lai J, Wang G W. Fractal analysis of tight gas sandstones using high-pressure mercury intrusion techniques[J]. Journal of Natural Gas Science and Engineering, 2015, 24: 185-196.
    [32] Li C Z, Liu X B, You F L, et al. Pore size distribution characterization by joint interpretation of MICP and NMR: A case study of Chang 7 tight sandstone in the Ordos Basin[J]. Processes, 2022, 10(10): 1941.
    [33] Zhang K X, Lai J, Bai G P, et al. Comparison of fractal models using NMR and CT analysis in low permeability sandstones[J]. Marine and Petroleum Geology, 2020, 112: 104069.
    [34] Zhang J J, Hu Y B. Comparative evaluation of pore structure heterogeneity in low-permeability tight sandstones using different fractal models based on NMR technology: A case study of Benxi Formation in the central Ordos Basin[J]. Energy & Fuels, 2020, 34(11): 13924-13942.
    [35] Zhou T Q, Wu C D, Shi Z K, et al. Multi-scale quantitative characterization of pore distribution networks in tight sandstone by integrating FE-SEM, HPMI, and NMR with the constrained least squares algorithm[J]. Energies, 2019, 12(18): 3514.
    [36] Zang Q B, Liu C L, Awan R S, et al. Occurrence characteristics of the movable fluid in heterogeneous sandstone reservoir based on fractal analysis of NMR data: A case study of the Chang 7 member of Ansai block, Ordos Basin, China[J]. Journal of Petroleum Science and Engineering, 2022, 214: 110499.
  • 加载中
通讯作者: 陈斌, bchen63@163.com
  • 1. 

    沈阳化工大学材料科学与工程学院 沈阳 110142

  1. 本站搜索
  2. 百度学术搜索
  3. 万方数据库搜索
  4. CNKI搜索

Figures(11)

Article Metrics

Article views(89) PDF downloads(36) Cited by()

Proportional views
Related
Publishing history
  • Received:  2023-05-22
  • Revised:  2023-05-29
  • Accepted:  2023-07-18
  • Published:  2023-12-10

Fractal-based Permeability Prediction Model for Tight Sandstone

doi: 10.14027/j.issn.1000-0550.2023.046
Funds:

CNPC Science and Technology Innovation Fund 2021DQ02-0105

National Natural Science Foundation of China 41802148

Major Science and Technology Projects of Sichuan Kelite Oil and Gas Technology Service Co., Ltd SCKLT-JSZS-2022-0044

Major Science and Technology Projects of Tarim Oilfield Company, PetroChina TXN011020120001

Abstract: Permeability is a key factor that determines the seepage capacity of tight sandstone reservoirs and ultimately determines productivity. Objective Owing to the complex pore structure and strong heterogeneity of tight sandstone reservoirs, the permeability exhibits significant variation and is difficult to predict. Thus, it is urgent to develop a permeability prediction model suitable for tight sandstones. Methods Taking the Cretaceous Bashijiqike tight sandstone in the Keshen2 gas reservoir of the Kuqa Depression of the Tarim Basin as the research object,, we qualitatively and quantitatively characterized the pore structure of tight sandstones by integrating routine physical analysis, microscopic observation based on thin section and scanning electron microscope, high-pressure mercury injection, nuclear magnetic resonance and fractal theory. Results Based on fractal theory and fully considering the influence of pore structure heterogeneity on permeability, two novel tight sandstone permeability prediction models based on fractal theory were proposed. Conclusion Compared with the rapex permeability prediction model, the permeability prediction accuracy of the r20 fractal model and the SDR(>40) fractal model increased by 42% and 20%, respectively.

SONG ZeZhang, LÜ MingYang, ZHAO LiBin, ZHANG YueQiao, HE YuanYuan, JIANG FuJie, YANG ZhenZhong, CHEN WeiYe, HUO LiNa, WANG Rui, LIANG Xiao. Fractal-based Permeability Prediction Model for Tight Sandstone[J]. Acta Sedimentologica Sinica, 2023, 41(6): 1847-1858. doi: 10.14027/j.issn.1000-0550.2023.046
Citation: SONG ZeZhang, LÜ MingYang, ZHAO LiBin, ZHANG YueQiao, HE YuanYuan, JIANG FuJie, YANG ZhenZhong, CHEN WeiYe, HUO LiNa, WANG Rui, LIANG Xiao. Fractal-based Permeability Prediction Model for Tight Sandstone[J]. Acta Sedimentologica Sinica, 2023, 41(6): 1847-1858. doi: 10.14027/j.issn.1000-0550.2023.046
  • 2020年,中国的致密砂岩气总地质资源量为20.9×10¹² m3,是探明率(30.9%)最高的非常规天然气[1]。从技术可采储量、探明储量、产量等角度来看,致密砂岩气都是中国最现实、最应优先开采的非常规天然气[2]

    致密砂岩的渗流能力一直是储层质量评价及储层分级的关键;而渗透率是直观体现致密砂岩储层渗流能力[3]并最终决定产能的最关键因素。渗透率的决定因素较多,如孔隙结构[4]、孔隙度[5]、成岩作用[6]等。在过去几十年里,众多学者基于各种实验分析,建立了不同的模型来预测砂岩的渗透率[79];它们可大体分为三类:基于高压压汞技术的渗透率预测模型、基于核磁共振技术以及基于分形几何的渗透率预测模型。

    高压压汞技术(HPMI)能够直接提供众多的孔隙结构参数。早在20世纪40年代,Purcell[10]就将毛细管压力与气测渗透率进行关联。Winland结合孔隙度与r35(进汞饱和度35%对应的孔喉半径),建立了基于孔隙度与孔喉半径的渗透率预测模型[11]。之后不同学者对此模型进行了改进,但变化主要体现在最优孔喉半径的选取上,如rapex[12]r25[12]r50[13]r10[3]。值得注意的是,rapex模型没有直接采用某一个进汞饱和度对应的孔喉半径来做渗透率预测,而是基于Swanson因子[14],采用了孔喉连通性转变节点对应的孔喉半径。

    与高压压汞技术相比,核磁共振技术(NMR)能够定量评价自由流体和束缚流体,在表征流体渗流方面更有优势。Coates et al.[15]发现砂岩的渗透率受控于可动流体与束缚流体体积比(FFI/BVI),进而对Timur的渗透率预测模型[7]进行修正,提出了Timur-Coates模型;它与SDR模型[16]以及Prince-Rezaee模型[3]是截至目前应用最为广泛的、基于核磁共振技术的渗透率预测模型。其他NMR渗透率预测模型多是基于Coates模型或SDR[17]模型的改进模型。这些NMR渗透率模型在致密砂岩中的应用往往不如常规砂岩——它们采用的最优T2谱参数,如T2cutoff,T2gmT2peak,仅能反映与这些T2谱参数相近的连通孔隙的渗流信息[18];而致密砂岩孔隙结构复杂,非均质性强[19],孔径分布范围更为广泛。因此,亟需能够表征更加宽泛孔径范围的参数用于渗透率预测。无论是基于最优孔喉半径还是最优T2谱参数的渗透率模型,本质上均是仅选取了某一个特征孔喉半径,结合孔隙度来预测渗透率,忽略了孔隙结构的非均质性,导致其在致密砂岩中的应用受限。

    自20世纪末以来,Mandelbrot[20]提出的分形理论被广泛用于储层孔隙结构非均质性表征[21]。在一定的孔径范围内,致密砂岩的孔隙空间是自相似的,即存在“标度不变性”。借助分形维数可以表征更宽孔径范围的孔隙结构特征,这种自相似性可以通过分形维数来定量表征。Pape et al.[22]首先利用孔隙度和分形维数预测渗透率,而后研究人员[18]将该模型与Timur-Coates模型、SDR模型结合,建立了两个基于NMR分形维数的渗透率预测模型,本研究简称Wu’s Timur-Coates分形模型、Wu’s SDR分形模型。目前,还鲜见基于高压压汞技术,使用分形理论建立的渗透率预测模型。

    本研究优选塔里木盆地库车坳陷巴什基奇克组致密砂岩为研究对象,综合铸体薄片、扫描电镜、高压压汞技术、核磁共振技术和分形理论,定性、定量表征致密砂岩孔隙结构特征;在此基础上,综合对比经典渗透率预测模型与基于分形维数的渗透率预测模型对巴什基奇克组致密砂岩的适用性,以期确定最适用研究区的致密砂岩渗透率预测模型。

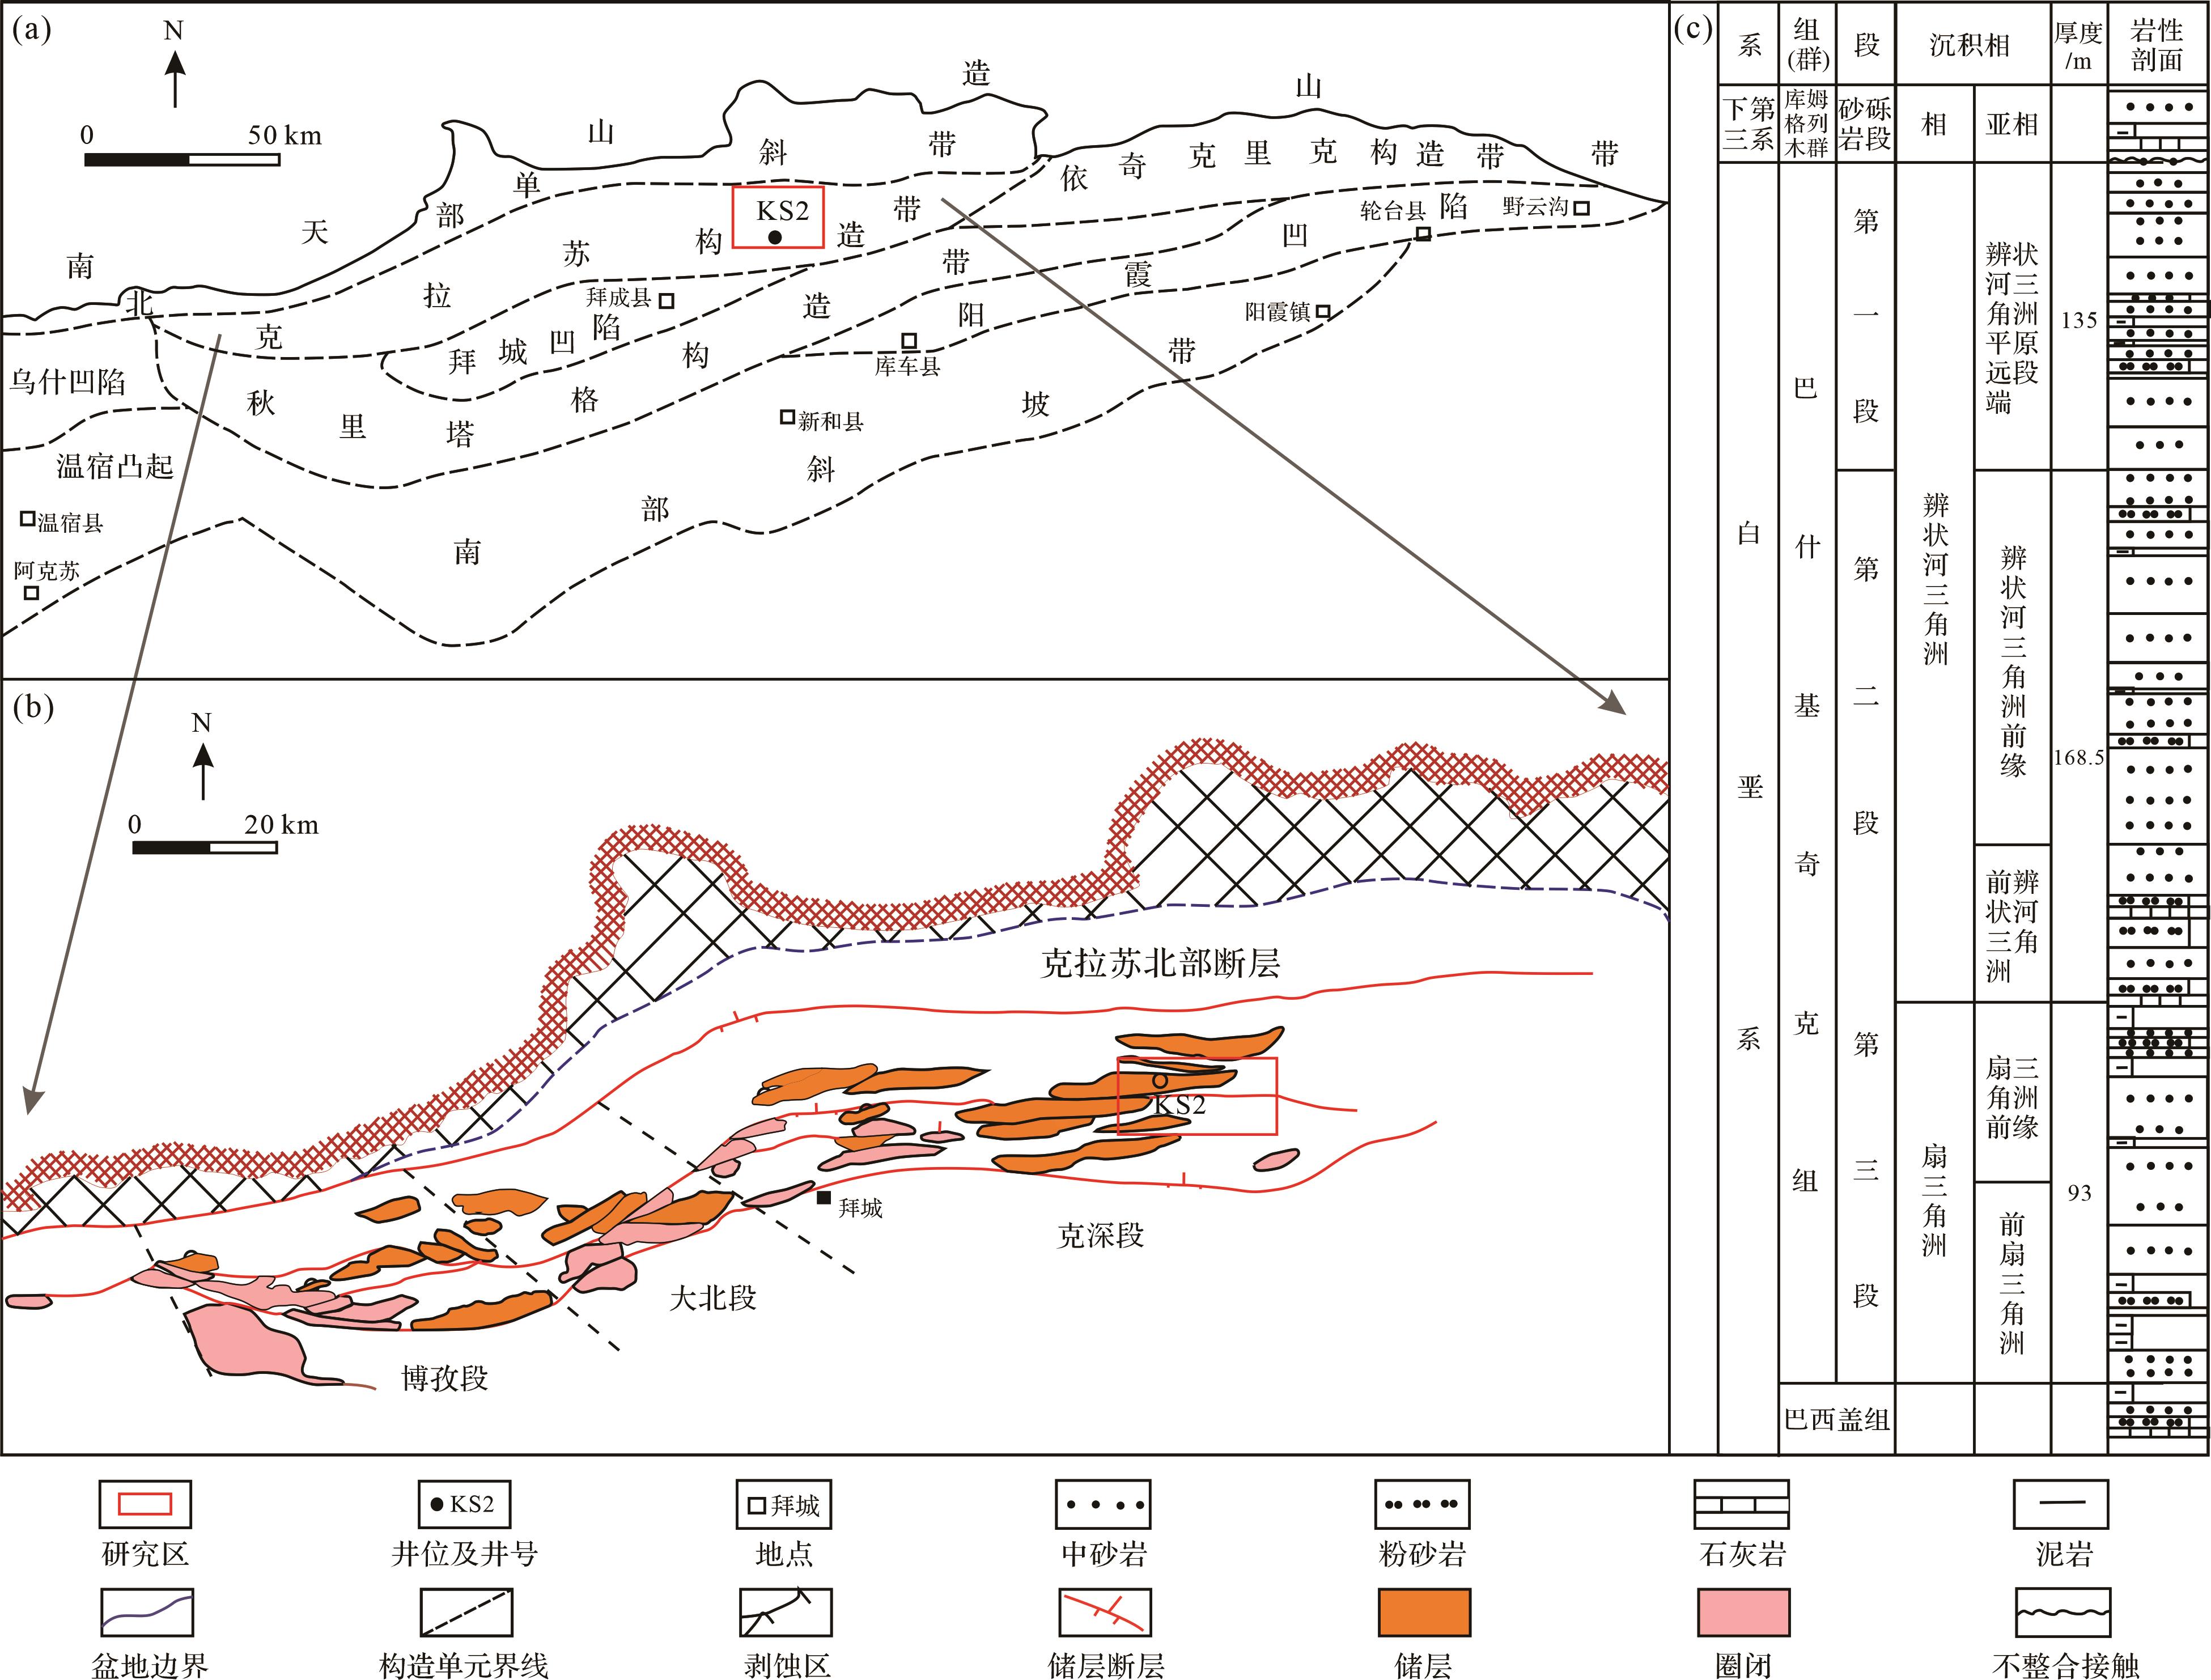
  • 库车坳陷位于塔里木盆地北部,其南北分别为塔北隆起和南天山造山带,构造呈北东东向展布,面积约3.7×10⁴ km2[23],包含八个次级构造——北部单斜带、克拉苏构造带、依奇克里克构造带、拜城凹陷、阳霞凹陷、乌什凹陷、秋里塔格构造带、南部斜坡带[24](图1a)。克深次级构造带位于克拉苏构造带中东部,整体呈近东西走向(东西向延伸约50 km)[25]。克深次级构造带主要受北部边界的克拉苏断裂与南部边界的拜城断裂控制[26],背斜和断层圈闭发育;本次研究区块为KS2气藏(图1b)。

    Figure 1.  Geologic background of the research area (modified from reference [24])

    KS2气藏自下到上依次发育白垩系巴什基奇克组(K1bs)、库姆格列木群(E1-2km)、古近系苏维依组(E2-3s)、吉迪克组(N1 j)、康村组(N1-2k)、康村组(N1-2k)以及第四系(Q)地层。研究目的层为白垩系巴什基克组;自下向上可划分为3段:巴三段(K1bs3)、巴二段(K1bs2)巴一段(K1bs1)[27];岩性以红色—棕色细—中等粒度砂岩为主,夹杂砾岩;砂体总厚度为210~350 m。巴三段(K1bs3)发育三角洲前缘沉积亚相,与下伏巴西盖组呈整合接触[28],发育中厚层细砂岩、薄层泥岩和粉砂质泥岩,厚度为70~83 m。巴二段(K1bs2)发育辫状河三角洲前缘沉积亚相,以深棕色厚至超厚泥岩、粉砂质泥岩和粉砂岩为主,厚度为93~196.5 m。巴一段(K1bs1)与上覆膏盐盖层库姆格列木群(E1-2km)呈不整合接触,发育辫状河三角洲前缘沉积亚相,由棕色至深棕色中巨厚砂岩组成,夹薄—中厚泥岩,厚度为47~70.5 m(图1c)。研究样品主要来自巴一段与巴二段。

  • 本次研究所用的30个致密砂岩样品均来自塔里木盆地库车坳陷巴什基奇克组1~2段,埋深6 600~6 900 m。所有实验均在塔里木油田分析测试中心完成。在分析测试前,先使用酒精与三氯甲烷配比抽提剂,提取样品中的残余油和盐约36 h;然后在120 ℃恒温箱中干燥24 h。孔隙度和渗透率采用美国CoreLab公司的CMS-300自动测试系统完成:孔隙度利用氦气膨胀法在常压下测量;渗透率使用压力转移法在约5.5 MPa围压下测量,并对渗透率测试结果进行克林肯伯格校正。高压压汞实验采用美国Micromeritics公司AutoporeⅣ 9510 全自动压汞仪完成。仪器最大工作压力414 MPa,可精确测量的孔喉半径范围为0.003~1 000 μm。基于Washburn方程,高压压汞实验可通过毛管压力曲线获得孔喉半径分布(公式1)。

    Pc=2σcosθr (1)

    式中:Pc为毛细管压力,MPa;σ为汞表面张力,空气/汞的表面张力为485 mN/m;θ为接触角,汞与各类物质间的接触角为135°至150°之间,通常θ取=140°;r为孔喉半径,nm。

    核磁共振实验采用英国Oxford Instruments公司Maran Ultra 型核磁共振分析仪完成,仪器主频强度为2 MHz,最小信噪比为100∶1,回波间隔为0.6 ms。干样品抽真空处理后,使用189 098 mg/L NaCl的模拟地层水进行加压饱和,测量T2谱;而后在最佳离心力(15 000转,8.53 MPa)下进行高速离心,再次测量T2谱。离心实验采用英国Oxford Instruments公司OD-16R型高速离心机进行;保持1 h恒速离心,以尽可能离心可动流体。

  • 应用最广泛的基于高压压汞技术的渗透率预测模型为Winland模型,Rezaee et al.[3]、Kolodzie[11]和Pittman[12]通过选取不同的特征孔喉半径作为渗透率评价参数,对该模型进行了改进,三者的改进模型均可用式(2)来表达:

    K=a1×Φb1×ric1 (2)

    式中:K为渗透率,×10-3 μm2Ф为孔隙度,%;ri为累计汞饱和度i%对应的孔喉半径,μm。Kolodzie、Pittman和Rezaee分别以累计进汞饱和度35%、25%、10%对应的孔喉半径作为最优孔喉半径参数,建立了r35r25r10渗透率预测模型。

    与这些模型相差较大的另一个典型模型是Swanson模型[14],该模型引入了Swanson因子(汞饱和度/毛管压力的最大值)来预测渗透率:

    K=m1×SHgPcn1 (3)

    式中:K为渗透率,×10-3μm2SHg为累计汞饱和度,%;Pc为毛管压力,MPa;m1、n2为系数。

    Pittman将Swanson模型与Winland模型结合,引入Swanson因子对应的孔喉半径rapex到Winland模型中,建立rapex模型[12]

    K=a2×Φb2×rapexc2 (4)

    式中:K为渗透率,×10-3μm2Ф为孔隙度,%;rapex为汞饱和度/毛管压力的最大值对应的孔喉半径,μm。

  • 应用最广泛的基于核磁共振技术的两个渗透率预测模型是Timur-Coates模型[29](公式5)和SDR模型[16](公式6):

    K=a3×Φb3×FFIBVIc3 (5)

    式中:K为渗透率,×10-3μm2Ф为孔隙度,%;FFI为自由流体体积,cm3BVI为不可动流体体积,cm3

    K=a4×Φb4×T2gmc4 (6)

    式中:K为渗透率,×10-3μm2Ф为孔隙度,%;T2gm为横向弛豫时间的几何均值,ms。

    另一个经典模型是Prince-Rezaee模型[3],即式(7)

    K=-a5-b5×Φ-c5×T2v (7)

    式中:K为渗透率,×10-3μm2Ф为孔隙度,%;T2v为横向弛豫时间的峰值,ms。

  • 基于核磁共振技术,使用分形理论对Timur-Coates模型与SDR模型的改进[18]如公式(8)和(9)所示:

     K=a5×Φb5+m2D×FFIBVIc5 (8)
     K=a6×Φb6+m3D×T2gmc6 (9)
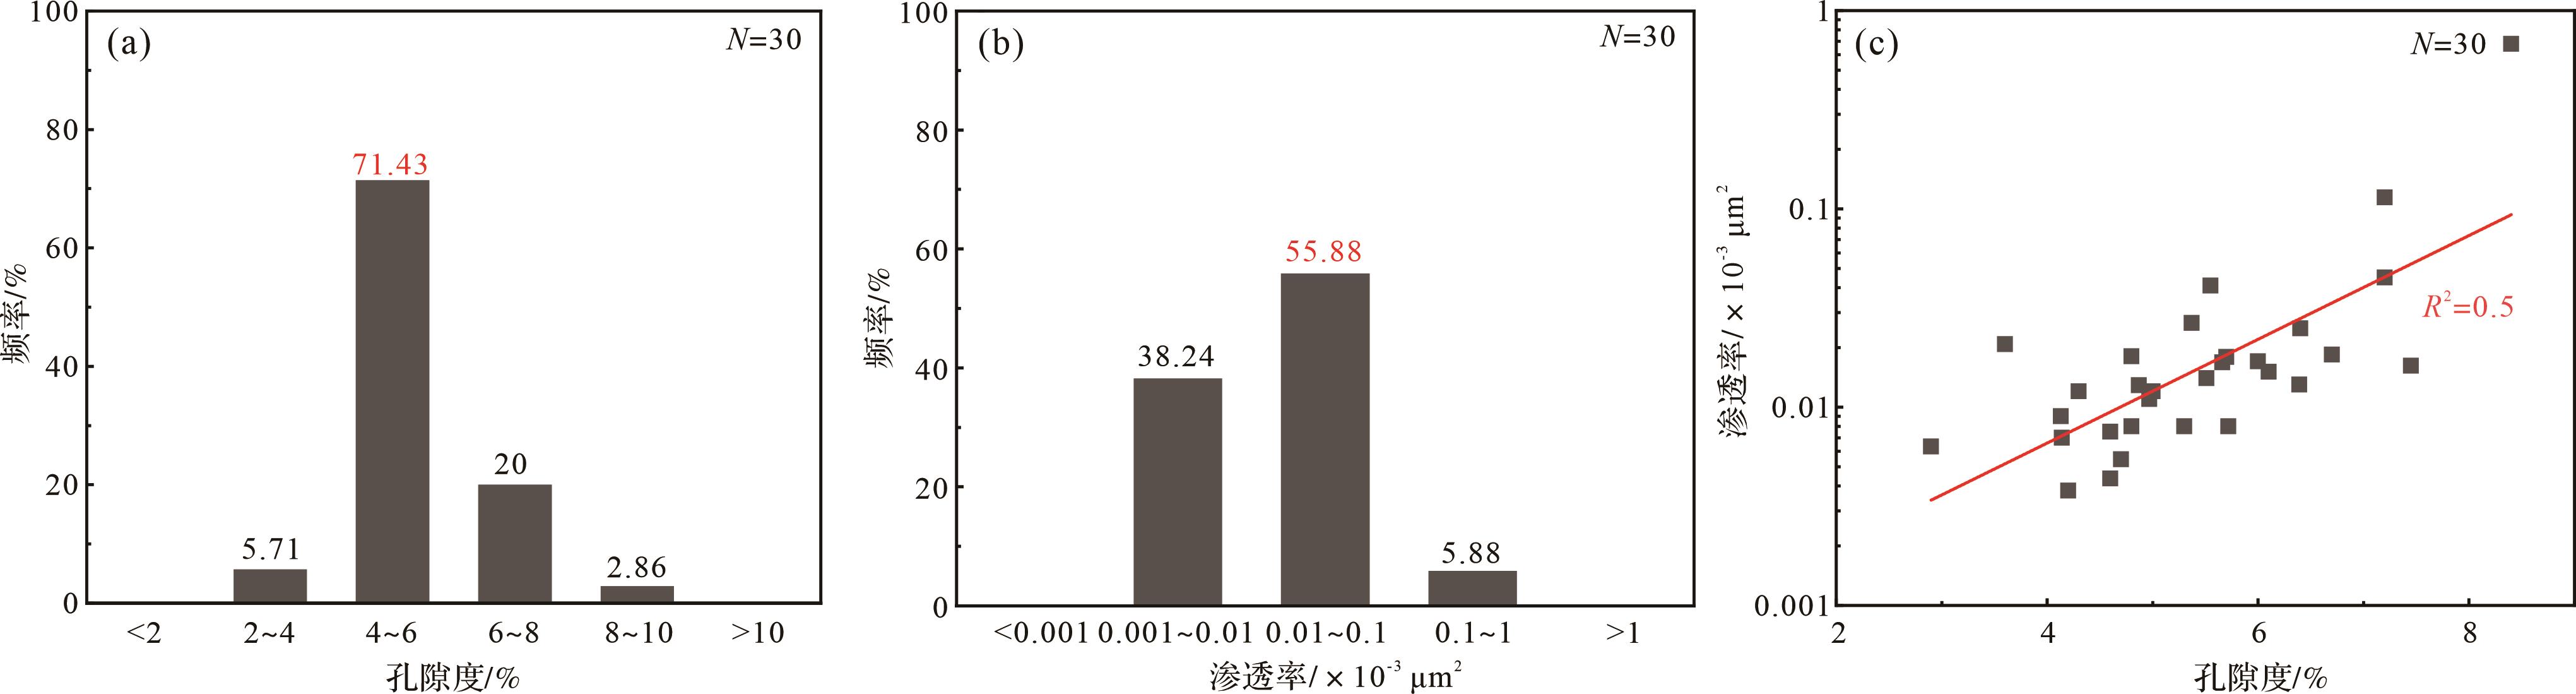
  • 研究区30个巴什基奇克组致密砂岩样品气测孔隙度(氦气)介于2.9%~8.4%,平均值和中值分别为5.29%和4.97%;克氏渗透率变化很大,相差多个数量级(0.003~0.678×10⁻³ μm2),平均为0.036×10⁻³ μm2,中值为0.013×10⁻³μm2;属典型的特低孔、超低渗致密砂岩储层(图2a,b)。孔隙度与渗透率的对数之间线性相关关系较差(R2=0.5),指示孔隙结构的非均质性较强(图2c)。

    Figure 2.  Physical characteristics of the Bashijiqike tight sandstone from the KS2 gas reservoir

  • KS2气藏巴什基奇克组致密砂岩以细—中砂岩为主,分选中等;碎屑颗粒呈次圆—次棱角状,以线接触和凹凸接触为主(图3a)、镶嵌胶结,结构成熟度较低。孔隙空间以粒间孔、溶蚀孔与晶间孔为主;整体上微裂缝不太发育,镜下仅在局部区域出现(图3a),且多因胶结而封闭。残余粒间孔和溶蚀孔是研究区巴什基奇克组储层最主要的孔隙类型:残余粒间孔是原生孔隙经强烈的压实作用而形成,多被自生石英、自生长石、白云石及自生/碎屑黏土填充(图3b),以微米级孔隙为主;溶蚀孔多是骨架颗粒中的不稳定矿物受到不同程度溶蚀,在粒内或粒间形成大小不等、圆形和港湾状,多为纳米—微米级孔隙(图3c)。晶间孔多由黏土矿物提供:自生黏土矿物(自生伊利石、自生伊利石/蒙脱石混合层)以搭桥式在颗粒孔隙间垂直生长,形成黏土矿物渡桥,其间发育晶间孔,呈不规则状,主要为纳米级孔隙(图3d)。

    Figure 3.  Microscopic characteristics of the Bashijiqike tight sandstone from the KS2 gas reservoir

  • 研究区18个巴什基奇克组致密砂岩样品的高压压汞结果表现出良好的相似性:(1)最大进汞饱和度值很高(图4a),为98.55%~100%,平均为99.61%;(2)进汞段曲线具有较为明显的“平台段”,表明孔径分布具有明显的主峰(图4b)且主峰多落于纳米级孔径区间;(3)储层主要流动孔隙半径(累计渗透率贡献值达95%的孔隙半径均值)为0.14~3.19 μm(平均为0.53 μm);(4)不同样品的排驱压力差异大,从0.2 MPa至3.51 MPa不等,平均为2.24 MPa,以高排替压力样品为主,反映储层的致密特性。

    Figure 4.  Pore structure characterization using a high⁃pressure mercury intrusion experiment for the Bashijiqike tight sandstone from the KS2 gas reservoir

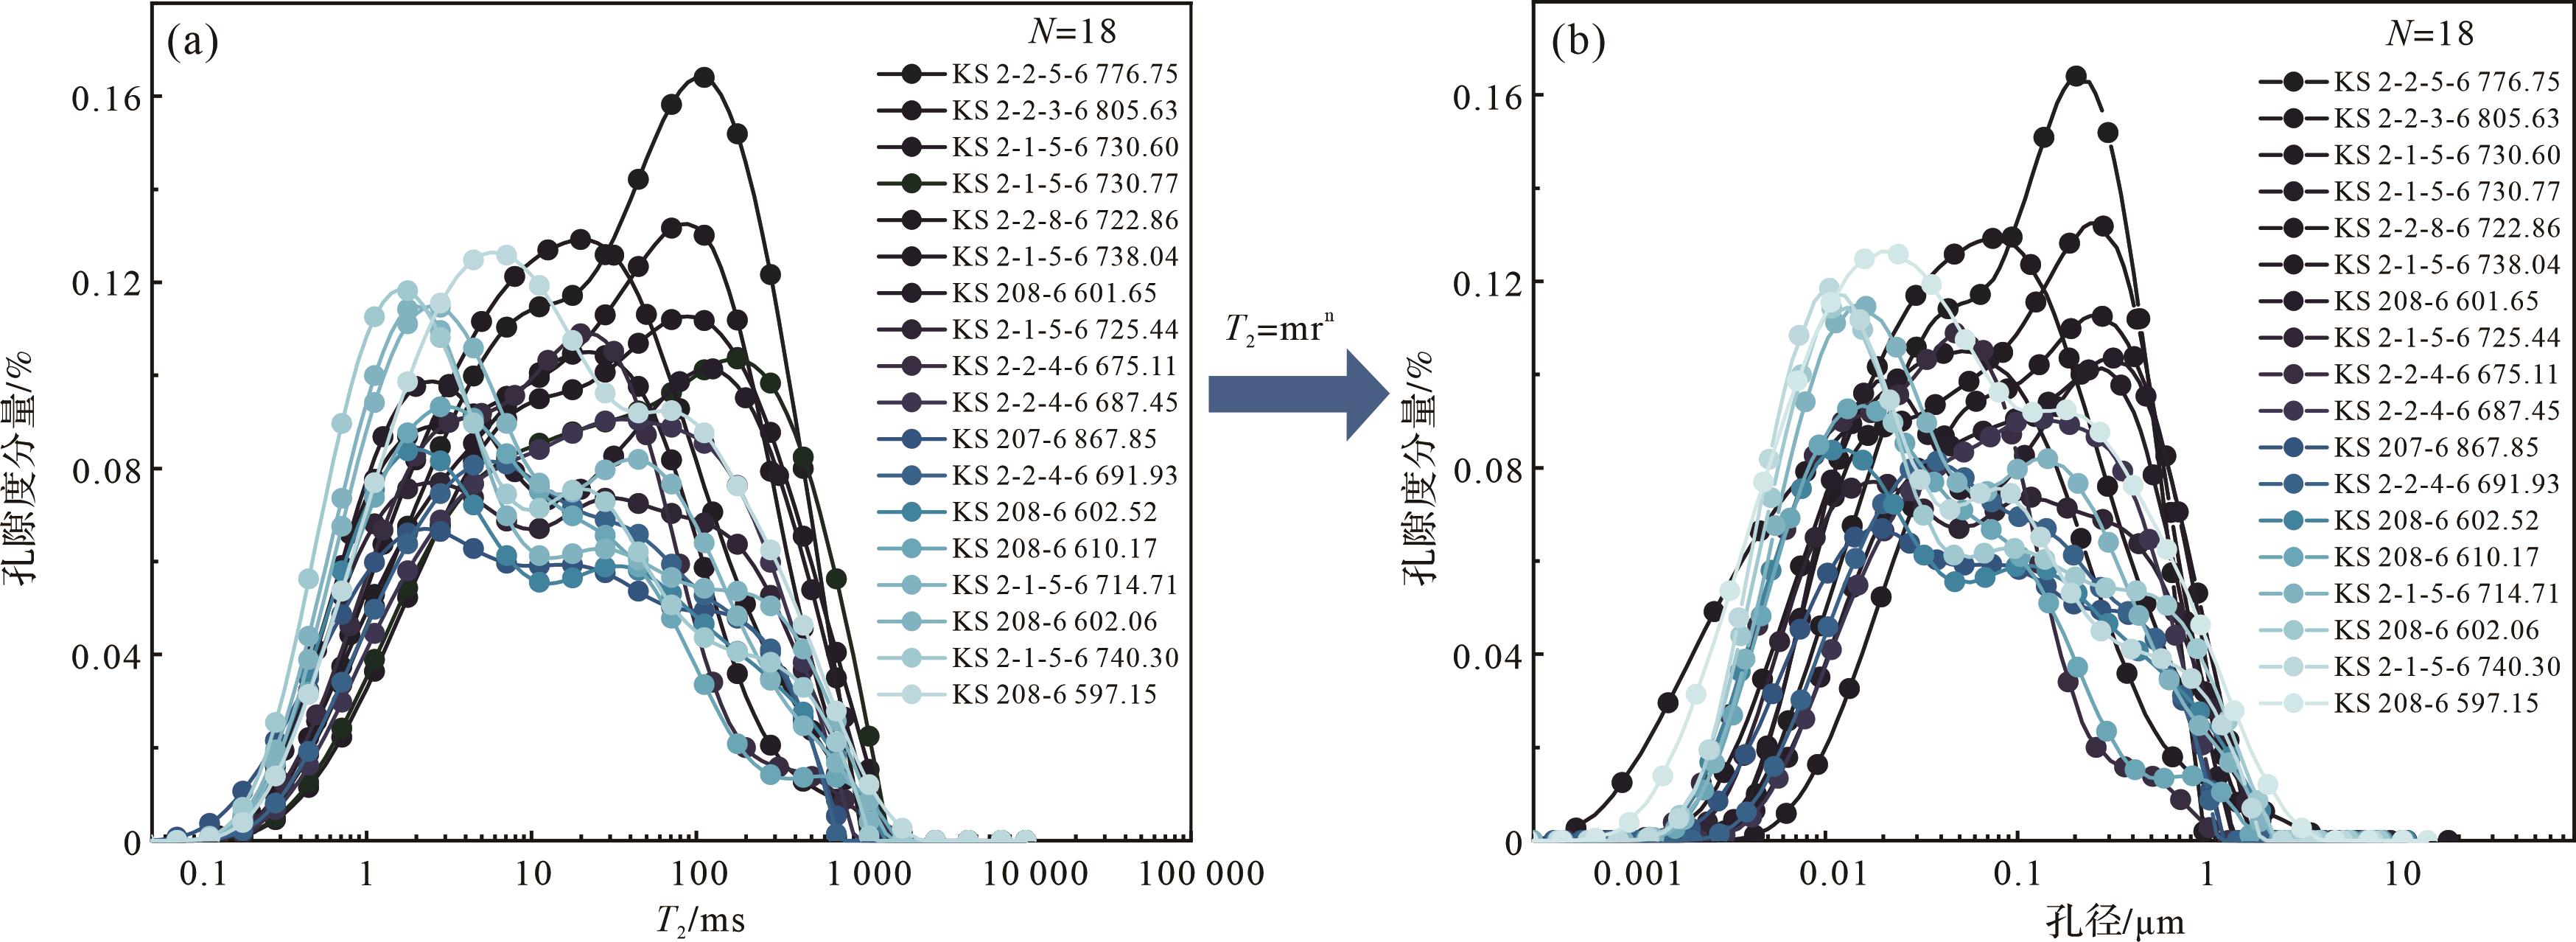
    核磁共振结果显示,核磁共振T2 谱(图5a)形态各异:单峰、双峰、三峰均存在,反映致密砂岩孔隙结构非均质性强;核磁共振孔径分布曲线(图5b)跨度大——从小于一纳米至数微米,但以纳米级孔隙为主。

    Figure 5.  NMR analysis of the pore structure of the Bashijiqike tight sandstone from the KS2 gas reservoir

  • 基于高压压汞[19]与核磁共振数据对巴什基奇克组致密砂岩的孔隙结构分别进行分形分析(图6):在双对数坐标轴上,高压压汞与核磁共振的数据点均呈分段线性分布,指示在不同的孔径范围内,致密砂岩孔隙结构存在不同的分形特征,需对其进行分段分形分析。

    Figure 6.  Fractal analysis of the pore structure of the Bashijiqike tight sandstone from the KS2 gas reservoir

    前人基于核磁共振数据进行分段分形分析时,常采用T2cutoff值对应的孔隙半径(rcutoff)的对数作为不同分形段的分界点[30]。孔径大于rcutoff的孔隙为大孔(对应的分形维数用Dm表示),是可动流体的主要储集空间;孔径小于rcutoff的为小孔(对应的分形维数用Db 表示),是束缚流体的主要储集空间。以KS215井6 730.60 m样品为例(图6),各分形段线性拟合系数均很高(R2>0.80),指示分形模型的有效性;Db均小于2,表明小孔不具备分形特征;基于高压压汞和核磁共振得到的大孔Dm变化范围分别为2.41~2.80和2.41~2.74,指示孔隙结构具有较强的非均质性。

  • 常用的用于评价预测模型准确性的指标有:MSE(均方误差)、RMSE(均方根误差)、MAPE(平均绝对百分比误差)、MAE(平均绝对误差);其中,RMSE和MAPE应用最为广泛。RMSE体现了预测值与实际值之间的偏差;而MAPE表示平均绝对百分比误差。由于渗透率变化范围大(跨数量级),为了更好地评价渗透率预测模型的准确性,既要考虑均方根误差(绝对值),也要考虑平均绝对百分比误差(相对值)。为此,本研究对RMSE和MAPE进行归一化,引入精度指数(ACI:Accuracy Index)[5]

    ACI=12i=12Eri-Er miniEr maxi-Er mini (10)
    Er=1MAPE;1RMSE (11)

    式中:Er为渗透率预测模型的误差合集;Er min 为误差合集中每一项的最小值;Er max 为误差合集中每一项的最大值。

    为验证渗透率模型的有效性,将18个样品数据随机地分为两组:测试集(6个样品)和验证集(12个样品);以测试集的数据进行多元线性拟合,求取渗透率模型中的系数(a,b,c),确定渗透率模型;用剩余的12个样品数据对模型的有效性进行验证。
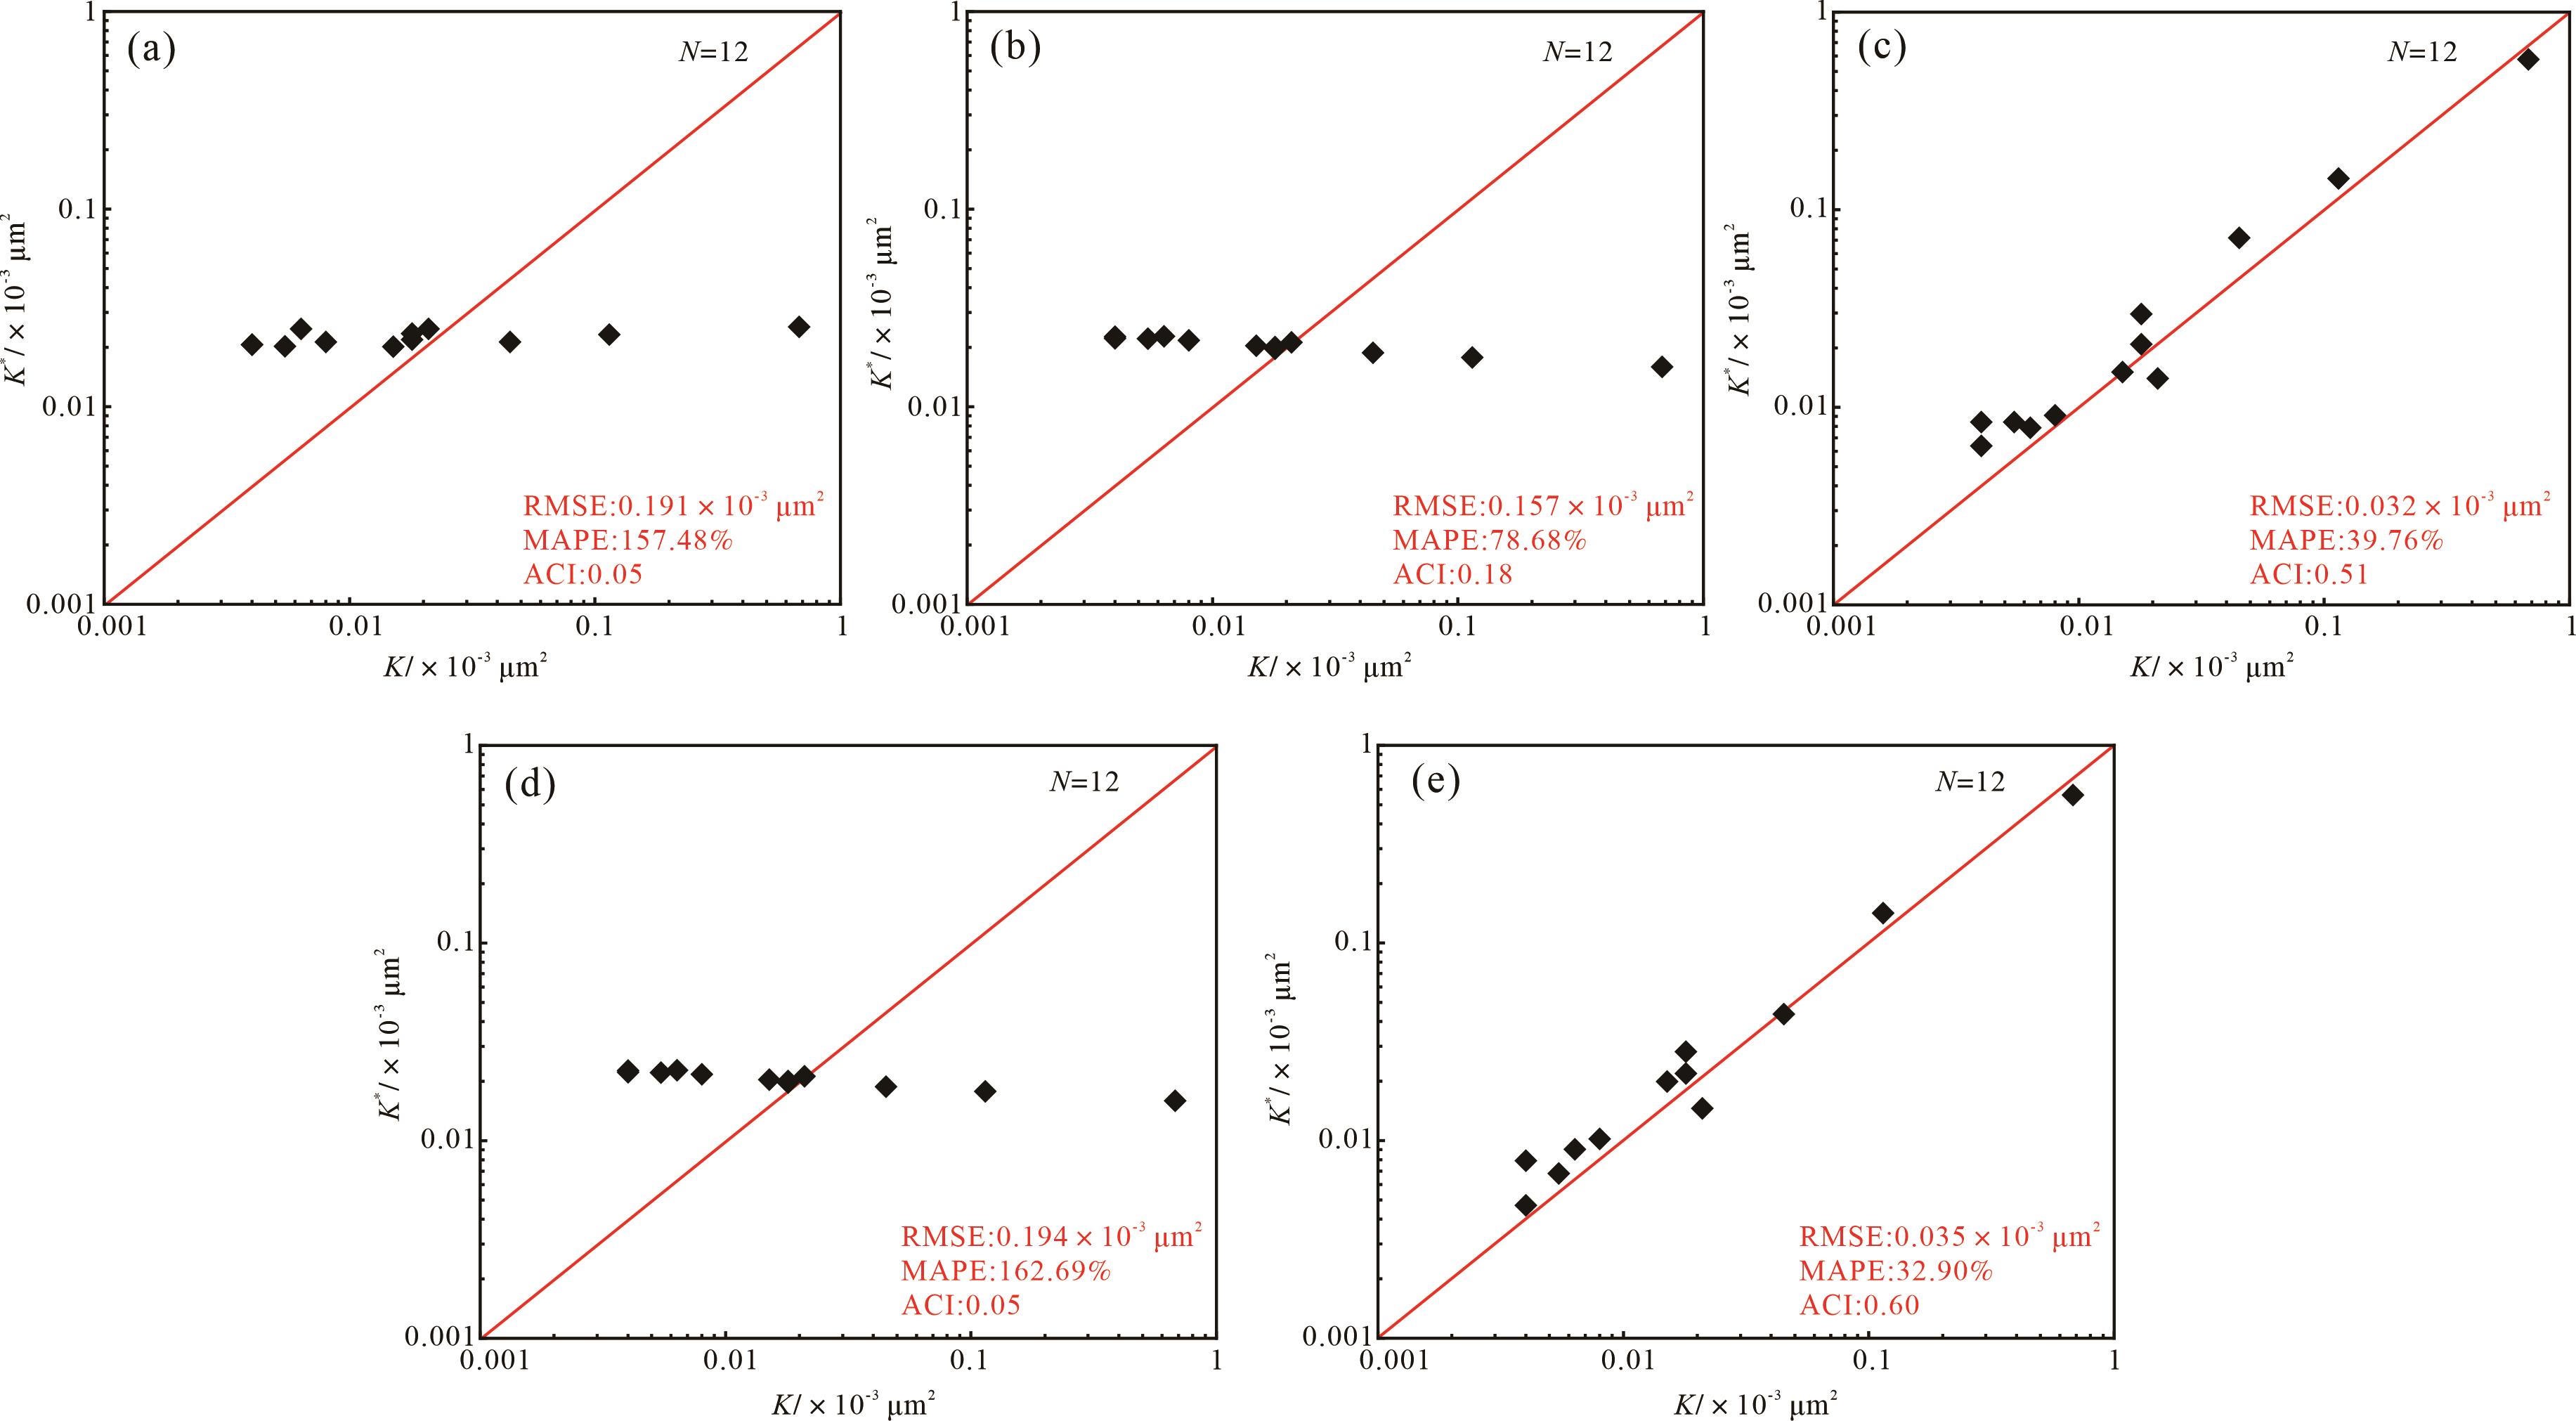
  • r35r25r10rapex和Swanson五个基于高压压汞技术的渗透率预测模型对比结果(图7)显示:预测精度最高的是rapex模型(ACI为0.60),最低的是r35和Swanson模型(ACI为0.05)。值得注意的是,r35r25r10三个模型预测精度逐渐变高;它们之间的差异仅体现在最优孔径ri值的选取上——随着ri 值的增大,预测效果显著增强。以KS228井6 723.86 m样品为例,其r35r25r10对应的毛细管半径分别为0.63 μm、0.81 μm、1.14 μm,而该样品的主要流动孔隙半径为1.08 μm,与r10最为接近——ri越接近主要流动孔隙半径,则ri模型的预测精度越高。然而,r10模型的预测效果依然不如rapex模型,这可能是由于rapex为孔隙连通性较差的小孔向连通性较好的大孔转变的节点[31],是更能体现储层流动特征的参数。因此,使用rapex能够进一步提高渗透率预测模型的精度。

    Figure 7.  Accuracy analysis of the permeability prediction models based on high⁃pressure mercury injection (HPMI) data

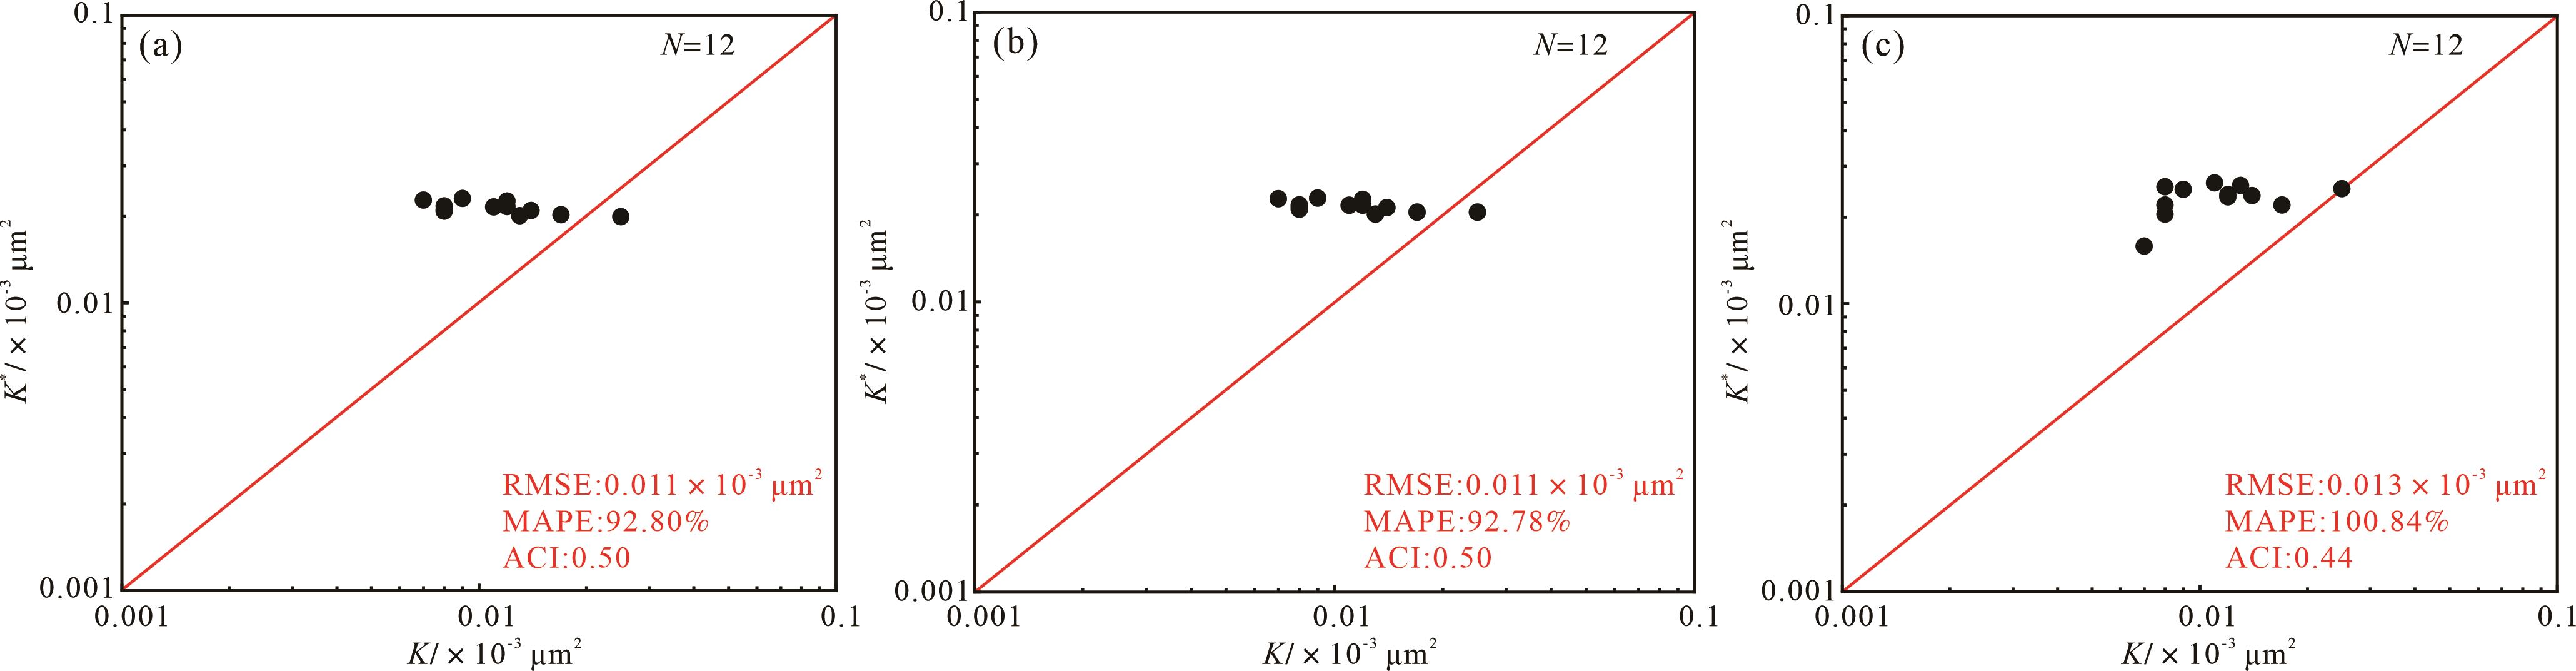
  • Timur-Coates、SDR和Prince-Rezaee模型(图8)预测效果均不理想。三个模型中,预测精度相对较高的是Timur-Coates模型和SDR模型(ACI仅为0.50),最低的是Prince-Rezaee模型(ACI为0.44)。一般来说,基于核磁共振的渗透率预测模型多用于评价分选良好、孔隙发育的疏松砂岩[18],往往要求渗透率和孔隙度之间存在较为紧密的相关关系;而巴什基奇克组致密砂岩不仅低孔、超低渗,孔隙结构还十分复杂、非均质性强,孔隙度和渗透率对数之间的相关关系较差(R2=0.5,图2c),影响了模型的精度。

    Figure 8.  Accuracy analysis of the permeability prediction models based on NMR data

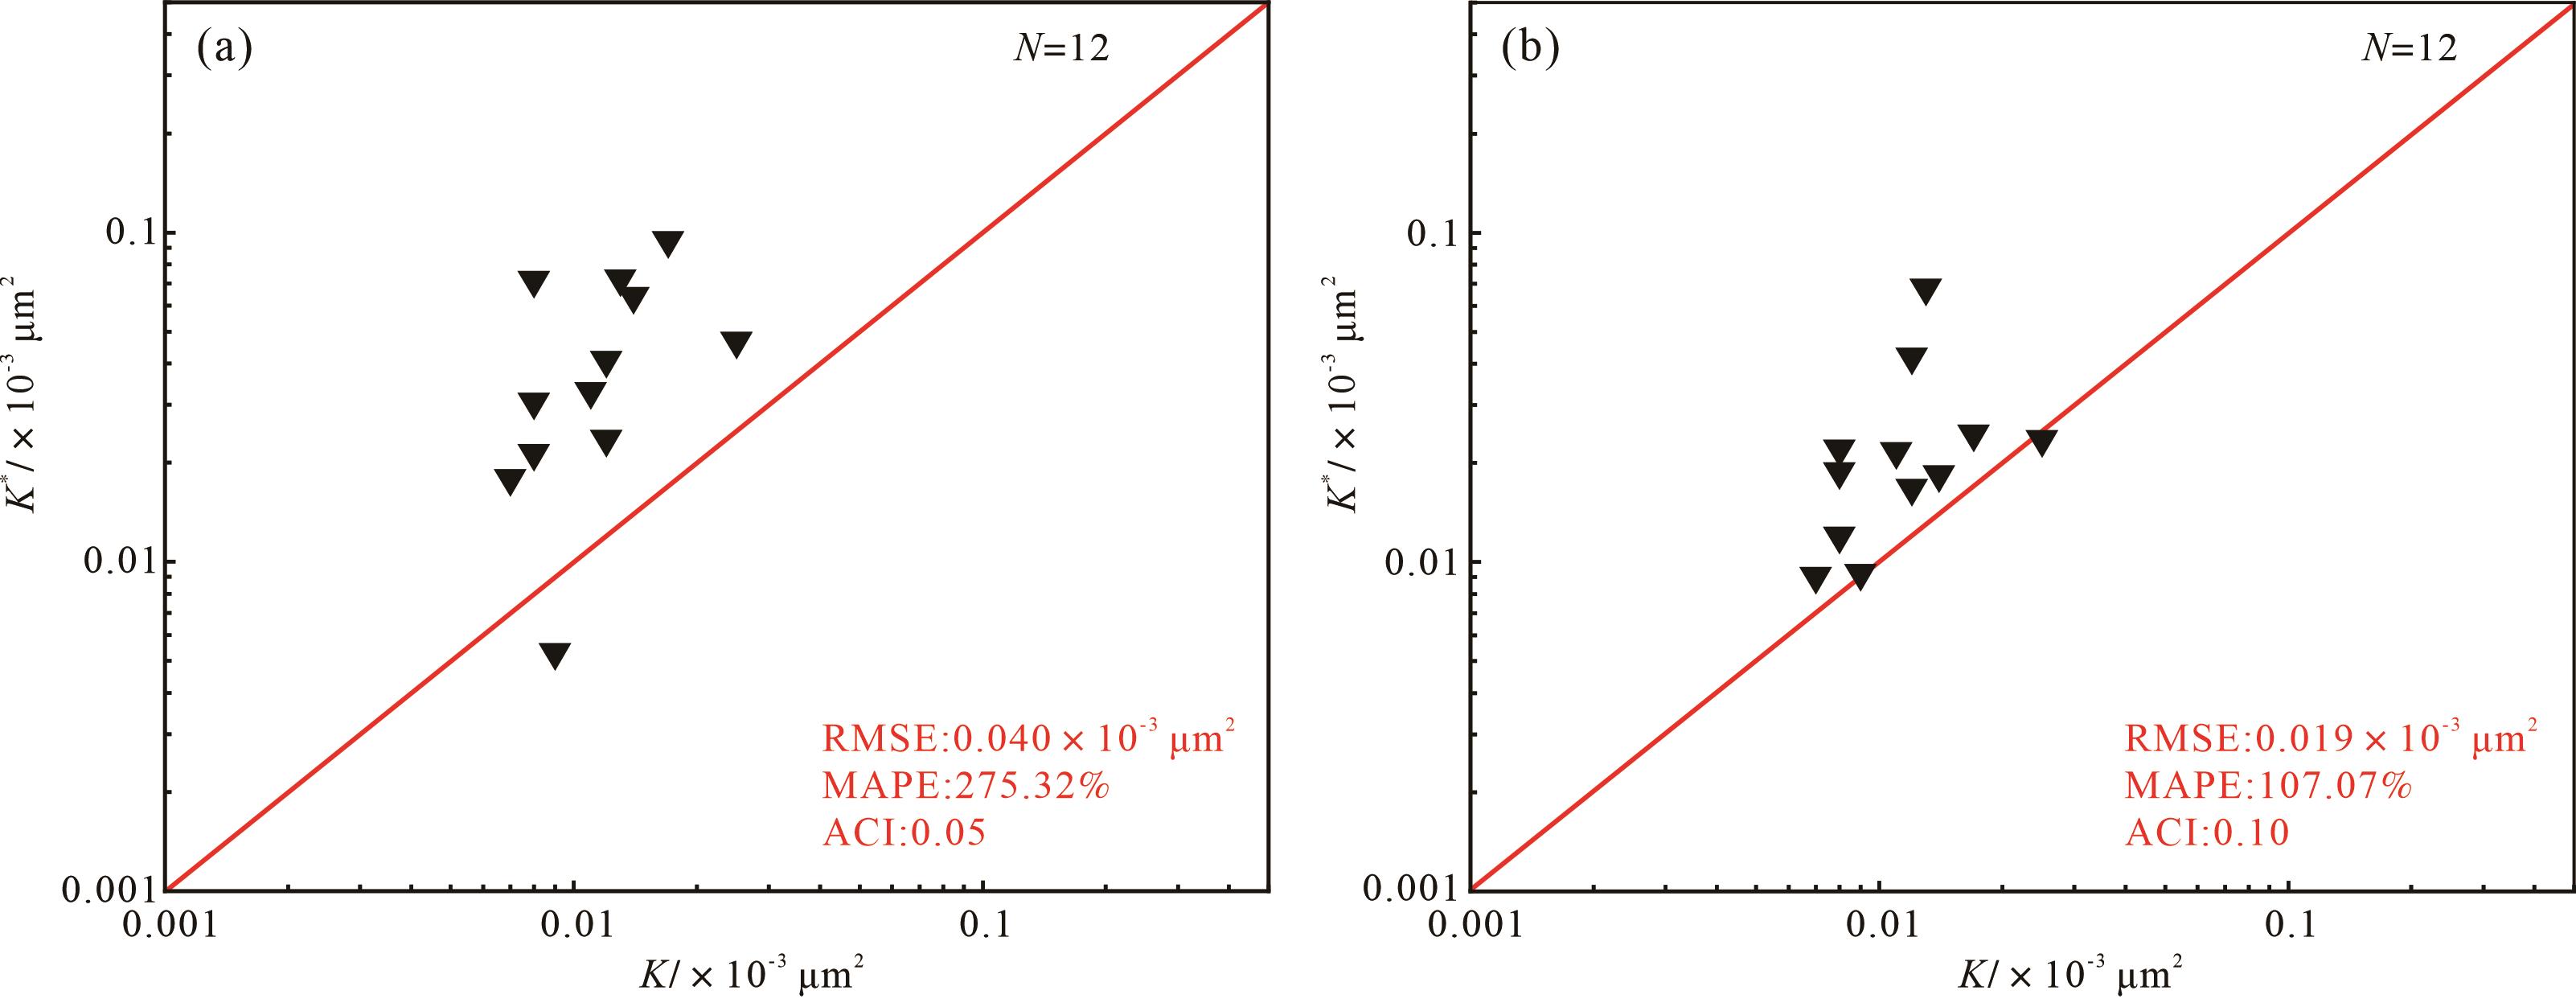
  • 与核磁共振渗透率预测模型结果相似,Timur-Coates分形模型和SDR分形模型[18]在巴什基奇克组致密砂岩中的应用效果均不理想(ACI分别为0.05与0.10,图9)。

    Figure 9.  Accuracy analysis of the fractal permeability prediction models based on NMR data

    值得注意是,分形模型中的D是以核磁共振的rcutoff为分界点进行分段分形分析求取的[18]。同样,以KS215井6 730.60 m样品为例,该样品T2cutoff值对应的孔隙半径为33 nm;而离心实验采用的离心力为8.53 MPa,结合Washburn方程,同样大小的毛细管力对应的孔隙半径为17.05 nm(可动流体下限)。需要注意的是,离心前后的流体分布(图10a)显示:与33 nm相比,17.05 nm线可以更好地表征可动流体下限——右侧的可动流体更多(达到96%)。与之相比,T2cutoff值忽视了部分小孔隙对渗流的贡献(图10b),这可能对渗透率模型的精度产生一定影响。值得注意的是,可动流体下限(17.05 nm)右侧的大孔内仍存在大量束缚水,这是由于“墨水瓶孔”或颈喉存在导致的[32]。此外,前人基于分形理论的模型虽然考虑了孔隙结构非均质性对渗透率的影响,但本质上仍是以孔隙度预测渗透率,这可能也是模型预测精度较低的原因之一。

    Figure 10.  Characteristics of movable fluid accumulation and seepage of sandstone reservoirs from the Bashijiqike Formation

    综上,对前人的分形渗透率模型进行改进:以最大离心力对应的毛细管半径(17.05 nm)的对数作为分段分形分析的分界点,而后选取Dm进行渗透率预测模型建模;在此基础上,从孔隙结构的角度出发,以分形维数为基础,重构致密砂岩渗透率模型。

    大量研究表明,渗透率与分形维数的幂数呈较好的相关关系(R2>0.6)[3335]

    KDn (12)

    式中:K为渗透率,×10-3μm2D为分形维数。

    与公式(12)相似,Winland模型与SDR模型中渗透率与孔隙度的幂数也存在相关关系,因此将式(12)分别与式(2)、式(6)结合,用Dm替代孔隙度,建立两种针对高压压汞数据与核磁共振数据的、基于分形理论的渗透率预测模型(式13,14):

    K=a7×Dmb7×ric7 (13)
    K=a8×Dmb8×T2gmc8 (14)

    为选取最优的riT2gm,使用累计汞饱和度10%~60%(间隔5%)对应的孔隙半径和T2>1 ms、>5 ms、>10 ms、>20 m~>100 ms(间隔20 ms)的几何均值进行对比;对KDm与不同ri 、(T2gm)>i做多元线性回归分析,建立渗透率预测模型。误差分析对比结果显示:当rir20(式15)、T2gmT2gm(>40)(式16)时,渗透率预测模型的精度最高:

    r20分形模型:K=a7×Dmb7×r20c7 (15)
    SDR(>40)分形模型:K=a8×Dmb8×T2gm>40c8 (16)

    式中:K为渗透率,×10-3μm2Dm为可动流体储集及渗流空间的分形维数;r20为累计进汞饱和度20%所对应的孔隙半径,μm;(T2gm)>40T2>40 ms范围内的几何均值,ms。

    与前人的渗透率预测模型(图7~9)相比,本研究改进的渗透率预测模型精度更高:r20分形模型的ACI为0.85(图11a),为所有预测模型中预测精度最高的(与rapex模型ACI值相比,改进模型的ACI提升了42%);SDR(>40)分形模型(ACI为0.72)预测精度(图11b)仅次于r20分形模型(与rapex模型ACI值相比,改进模型的ACI提升了20%)。

    r20分形模型ACI提升程度:r20分形模型ACI-rapex模型ACIrapex模型ACI×100%=0.85-0.60.6×100%=42% (17)
    SDR分形模型ACI提升程度:SDR分形模型ACI-rapex模型ACIrapex模型ACI×100%=0.72-0.60.6×100%=20% (18)

    Figure 11.  Accuracy analysis of the modified fractal permeability prediction models based on HPMI (a) and NMR (b) data

    本研究提出的改进的分形渗透率预测模型的精度较之前的模型有所提升的原因,可能有以下几个方面:(1)渗透率预测模型是基于分形维数建立的;分形维数具有“跨尺度”表征孔隙结构非均质性的特征[36]且分段分形中的Dm能够较好地体现对渗透率有贡献的孔隙结构信息;(2)选取了更合适的分段分形分析节点,计算得到的Dm更能表征可动流体储集空间的非均质性,因而精度更高。此外,SDR(>40)分形模型的预测精度低于r20分形模型的原因可能与“墨水瓶孔”或颈喉的存在有关,其大孔的分形段还包含了部分不可动流体所在孔隙(图10a中)的信息,进而影响渗透率预测的精度。

  • (1) 与rapex模型相比,基于分形理论建立的r20分形渗透率预测模型、SDR(>40)分形渗透率预测模型的预测精度分别提升了42%与20%。

    (2) 离心力对应的孔隙半径(rcen)比核磁共振T2 截止值对应的孔隙半径(rcutoff)更适合作为分段分形分析的分界点,计算得到的Dm更能反映可动流体储集空间的非均质性,更适于渗透率建模。

Reference (36)

Catalog

    /

    DownLoad:  Full-Size Img  PowerPoint
    Return
    Return