




-
沉积物物源研究作为连接沉积盆地与造山带的纽带,是重建盆地沉积过程、恢复盆地岩相古地理以及再现盆—山耦合关系的重要内容(杨仁超等,2013;吴颖等,2023)。碎屑岩的元素地球化学特征虽然受到源岩性质、风化再循环、搬运、沉积以及后期成岩和变质作用等一系列因素的控制,但仍能从一定程度上反映物质来源、源区构造和沉积环境,对盆地“源—汇”系统的建立有良好的指导意义(McLennan et al.,1983;Bhatia and Crook,1986;McLennan,1993;Garzanti et al.,2015;李乐等,2015;彭治超等,2018;屈李华等,2018),被国内外学者广泛运用(Pearce et al.,1984;Roser and Korsch,1988;刘春来等,2021;蒋赟等,2022;李俊等,2024)。
柴达木盆地具有特殊的盆—山构造格局,新生代是盆地演化的重要阶段,这一时期的沉积物为源区属性和源区构造演化过程的研究提供了最直接的证据(付玲等,2012)。近年来,前人利用矿物岩石学、古地磁学、元素地球化学和地球物理勘探等多学科、多方法对新生代柴达木盆地内多个地区进行了物源体系、沉积演化和古气候环境等方面的综合研究(叶爱娟和朱扬明,2006;惠博等,2011;李凤杰等,2014;李林林等,2015;孙国强等,2015;李高杰等,2017;刘康等,2020;路晶芳等,2020;马万里等,2021;魏岩岩等,2021;蔡火灿等,2022;段磊等,2022;冯怀伟等,2022;栗兵帅等,2022;田继先等,2022;桑胜萍等,2024)。研究分析表明,柴达木盆地新生界的物源具有旋回造山带的构造属性,在新生代构造演化过程中,源区性质随时间并没有发生明显改变(关平和简星,2013),古近纪以来,盆地周围山脉快速抬升,源自阿尔金山、东昆仑山、祁连山被侵蚀的碎屑物质被河流系统搬运至柴达木盆地,盆地范围于早中新世达到鼎盛(Métivier et al.,1998),受喜马拉雅运动的持续影响,沉积中心自西向东迁移(楼谦谦等,2016;冯德浩等,2021),在盆地东部发生拗陷、持续稳定沉降,形成了近源的、活动构造背景下的第四系泥岩沉积(关平和简星,2013;司马立强等,2023)。目前对沉积物源的研究往往依赖于某一种或几种方法,如通过分析现今水系分布、储层岩性、矿物组合、重矿物等特征来判断物源。然而,每种方法均有其局限性和不确定性。例如,重矿物的分布可能受到后期地质作用的影响而发生改变,导致其指示的物源信息不准确;水系分布可能会因后期的构造运动或气候变化而发生改变,不能完全反映第四纪时期的物源情况。虽然多方法的综合运用可一定程度提高物源分析的准确性,但目前在多方法综合分析方面还不够充分,不同方法之间的相互印证和结合也不够紧密,缺乏系统性的综合研究,使得物源的分析仍存在一定的不确定性。
三湖坳陷涩北地区第四系泥岩型生物气藏,是油气勘探发现的新型气藏(司马立强等,2023)。目前,对该地区第四系的研究主要集中于自生自储生物气的形成机理和控制因素(芮华松和关平,2012;王万春等,2016a,2016b;单俊峰等,2019),而沉积物源区属性方面缺少相关的证据,这极大地限制了对该区有效储层分布情况的整体认识和预测。因此,本文在前人研究的基础上,对柴达木盆地三湖坳陷涩北地区涩探1井、涩探2井第四系岩心样品进行主、微量元素和稀土元素测试分析,结合潜在源区地质背景、沉积盆地格局,探讨样品的源岩类型和源区构造环境,对盆—山耦合关系、大地构造背景和第四系生物气藏的油气勘探有重要的地质意义。
-
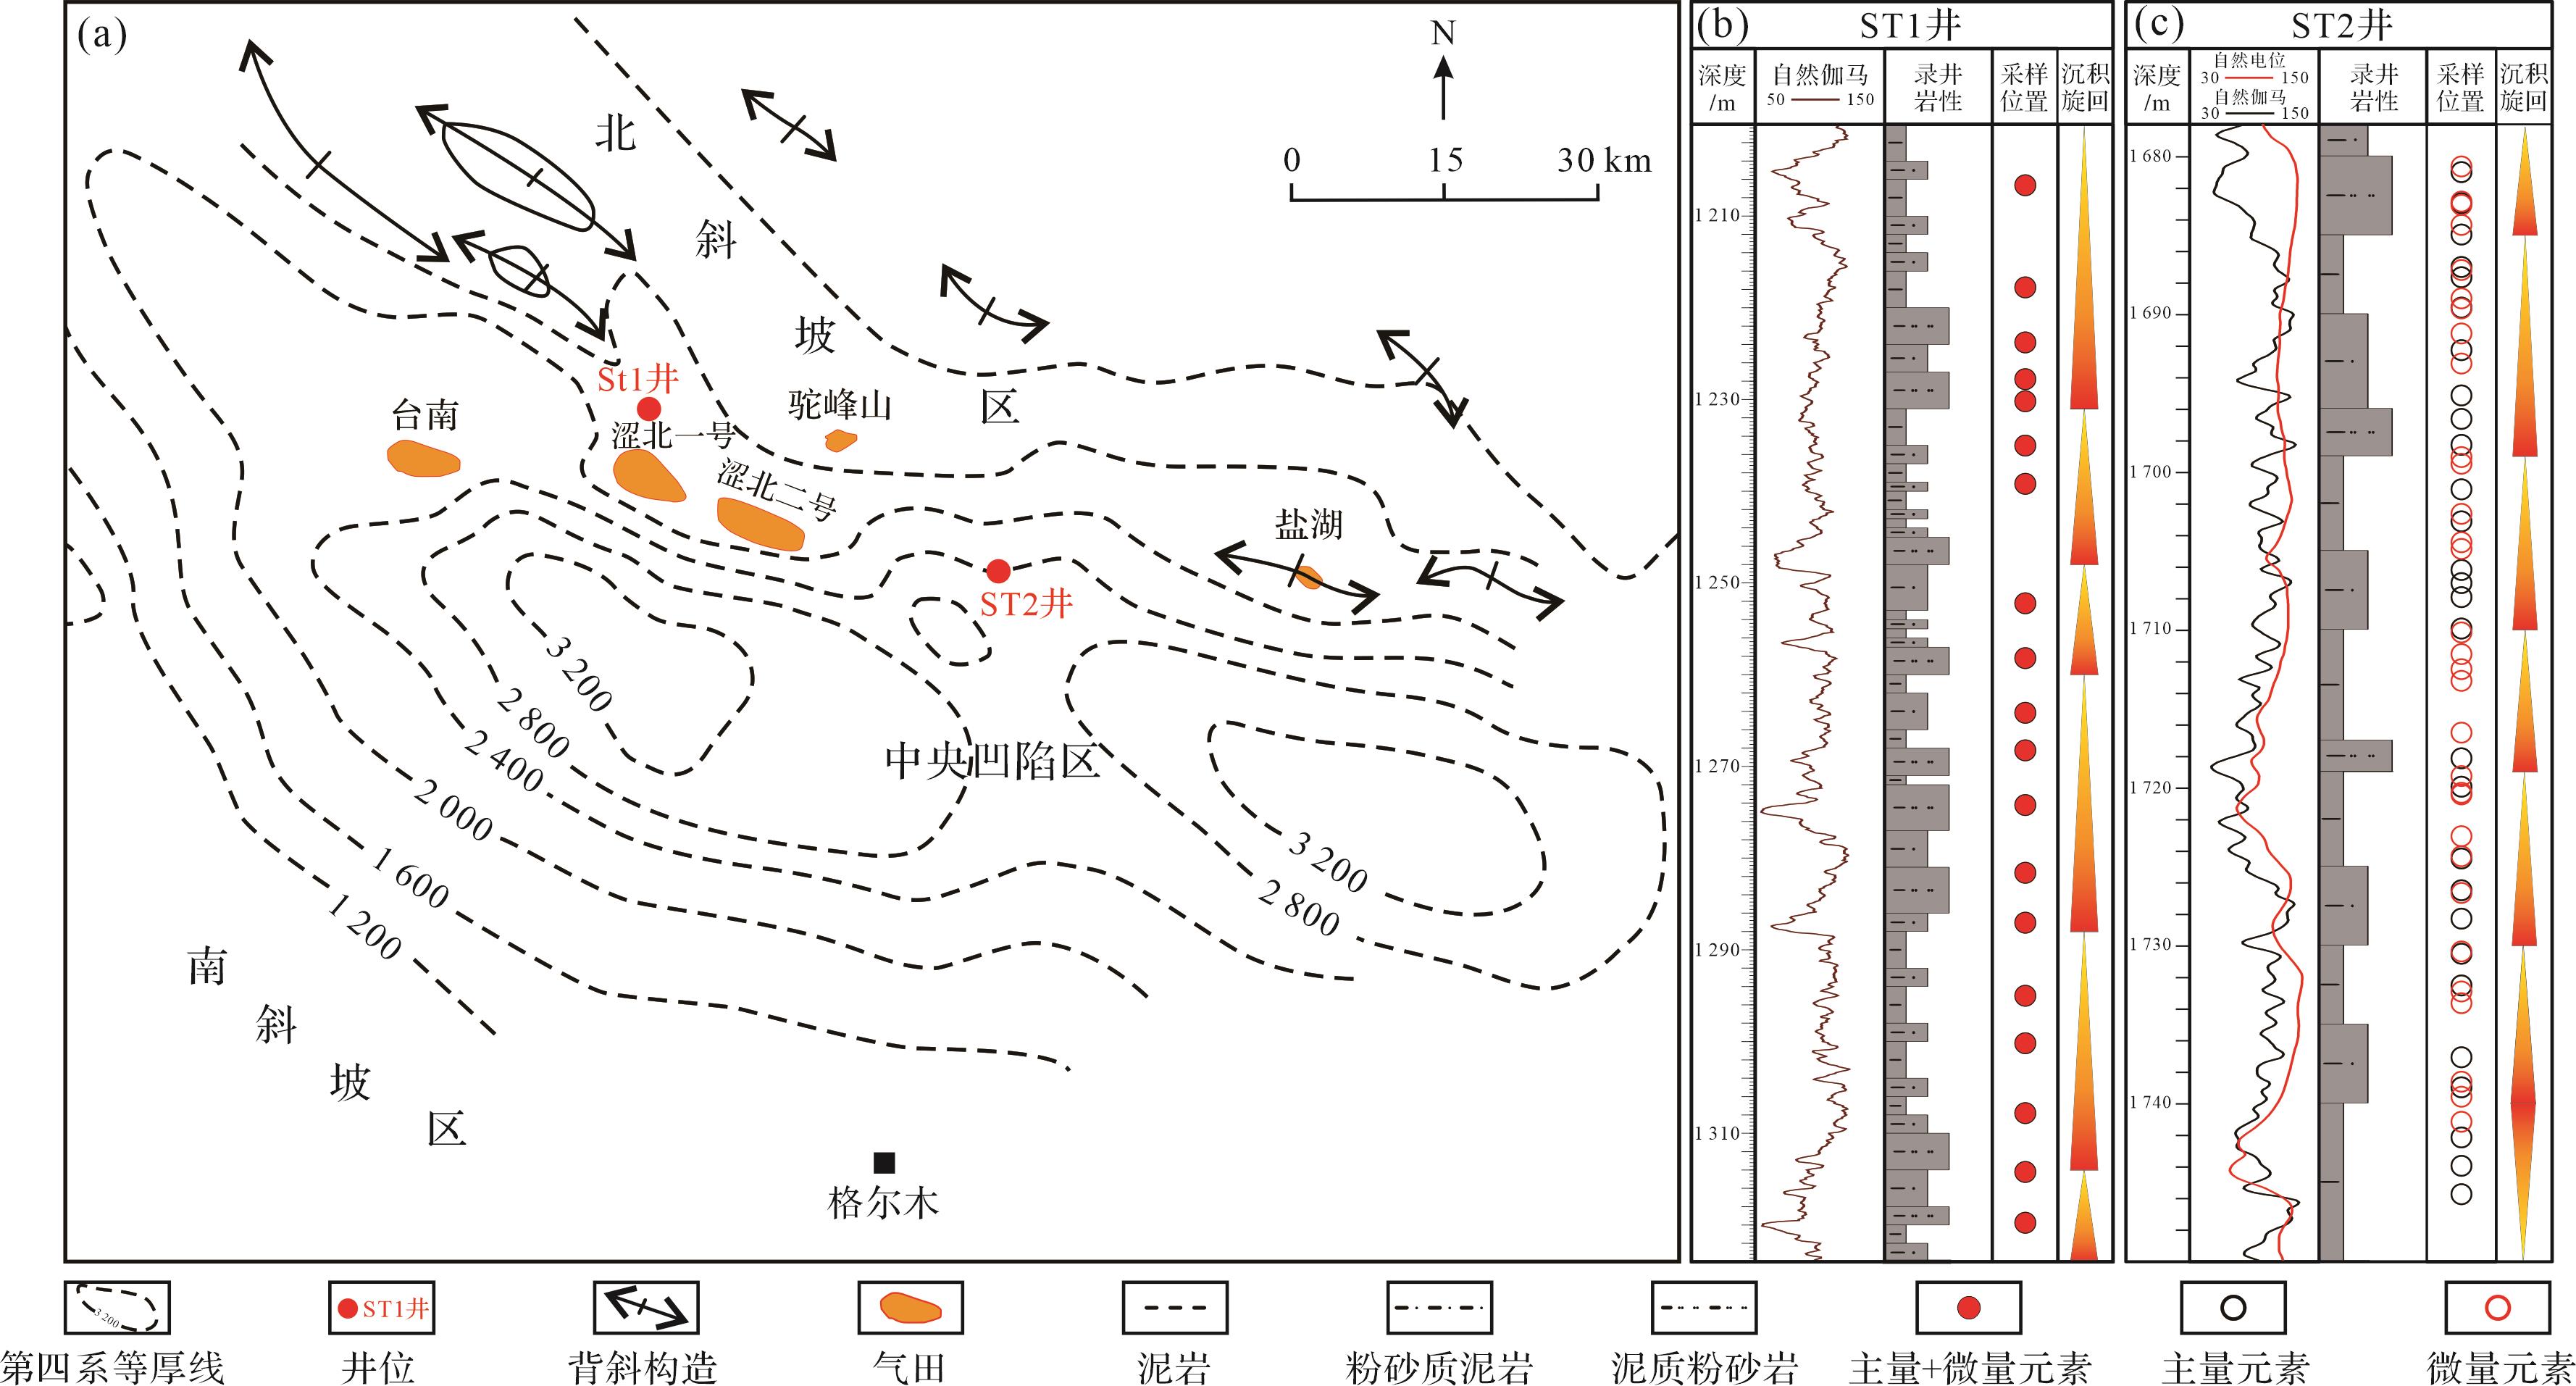
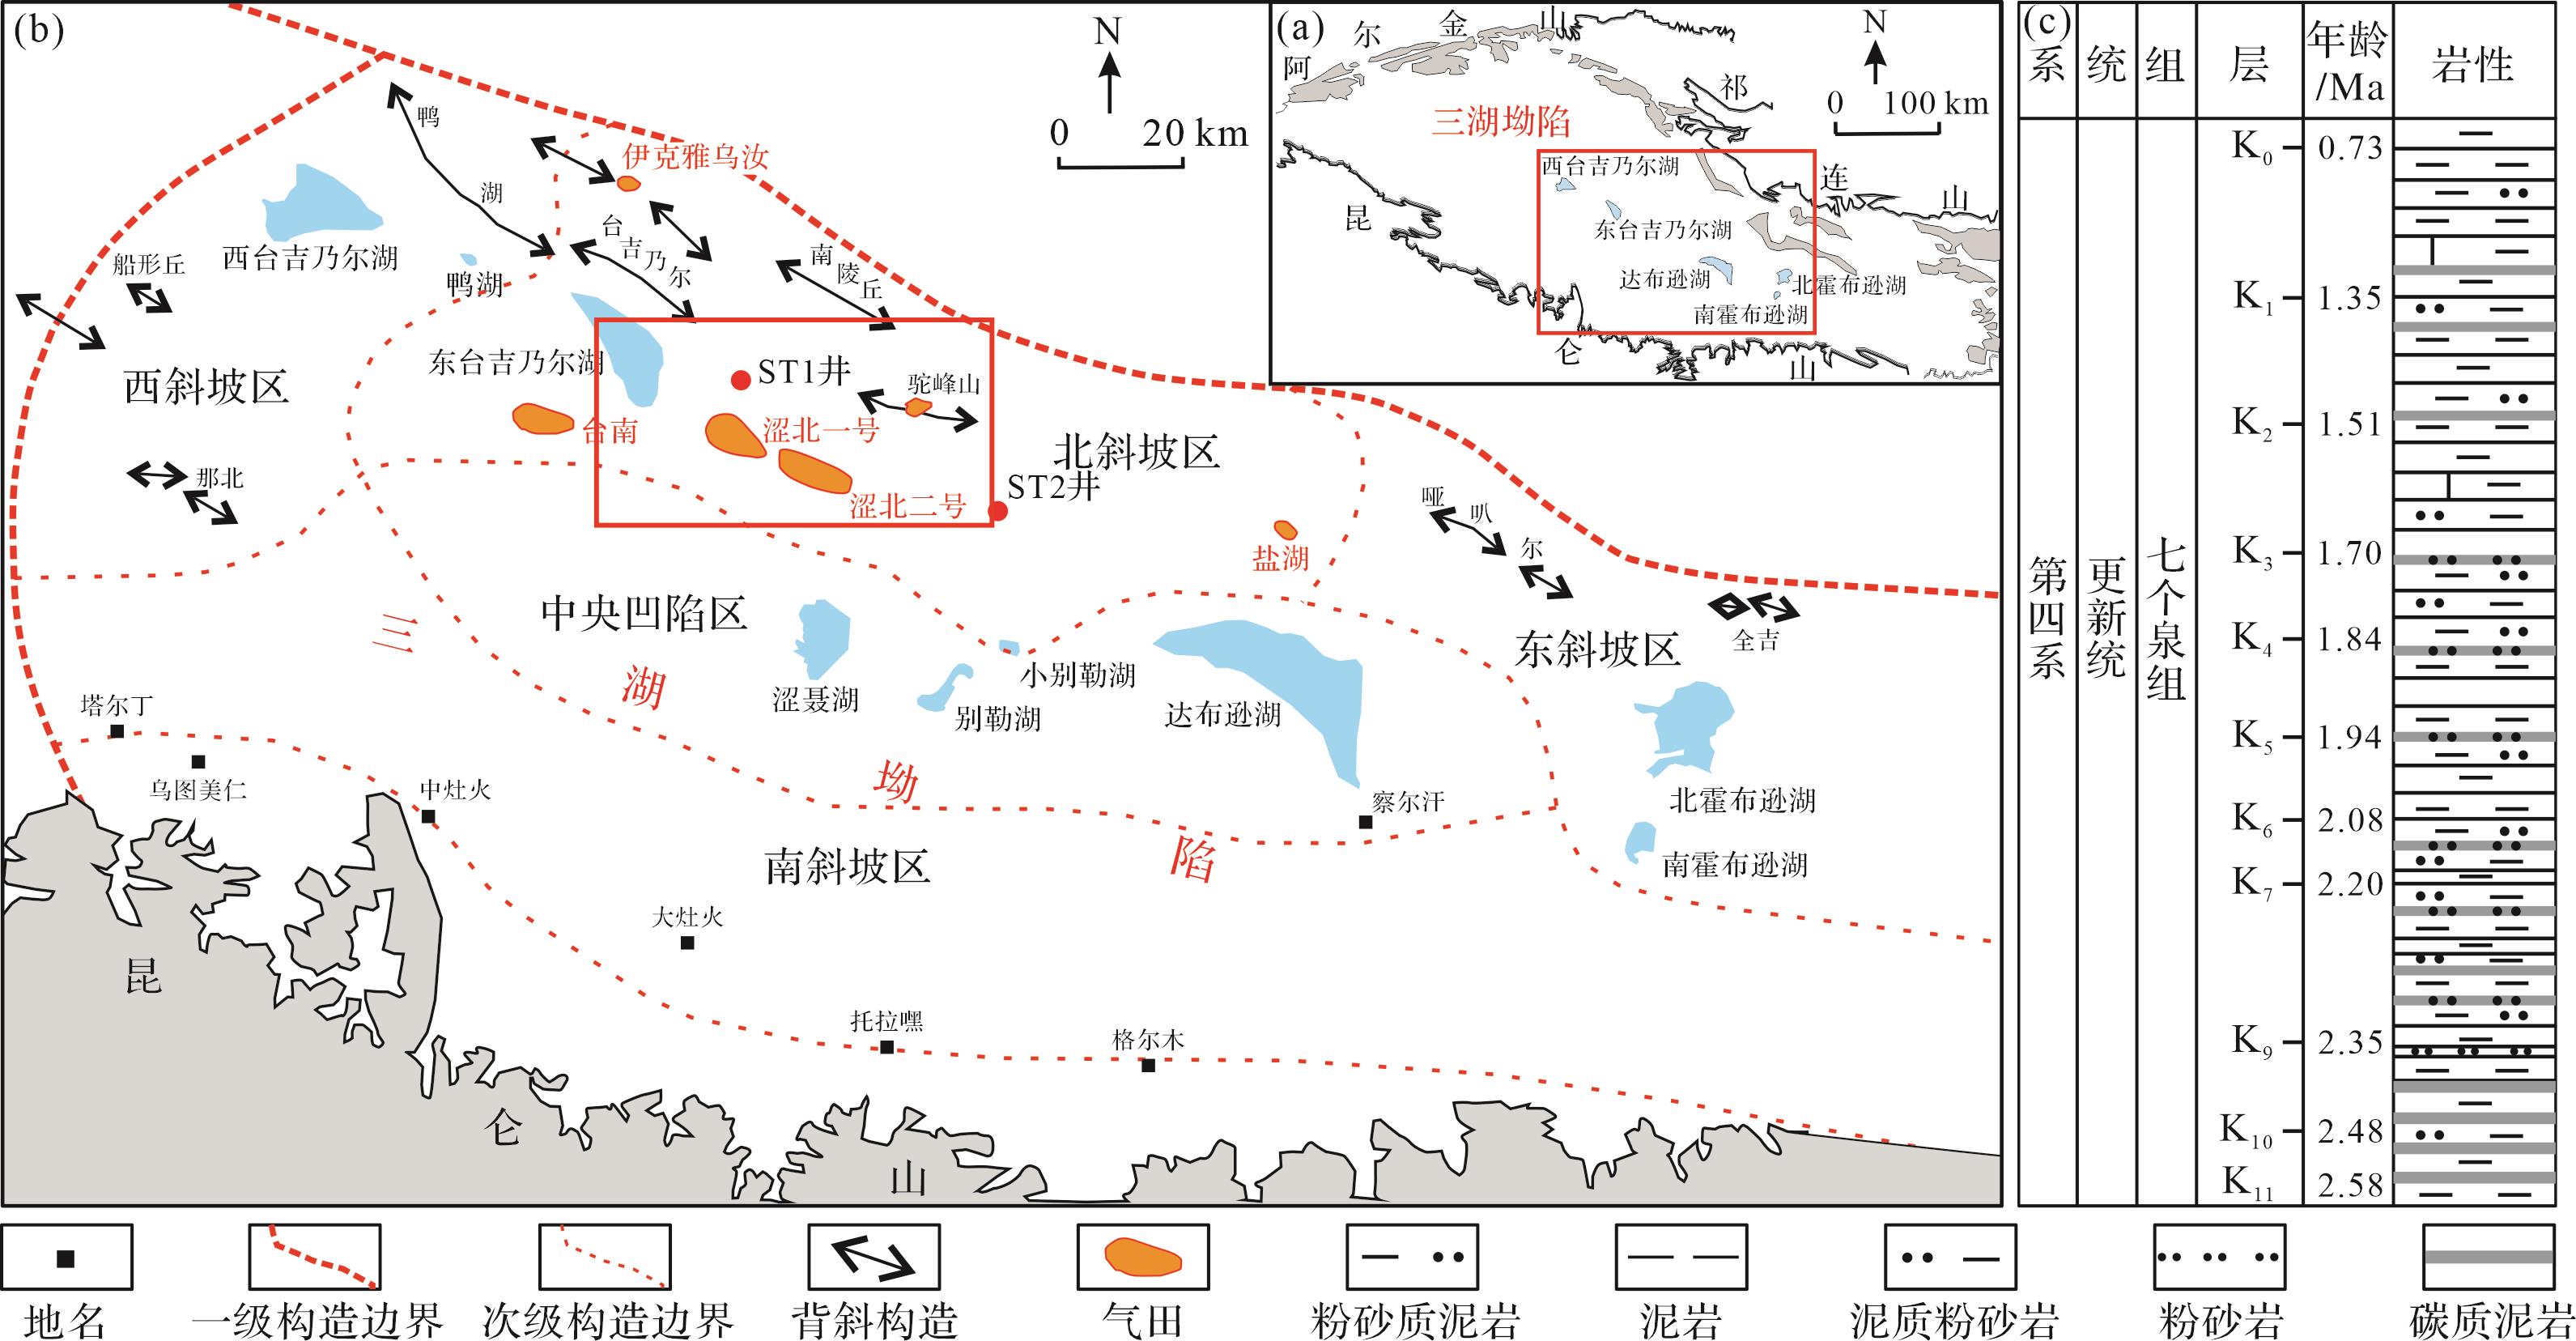
柴达木盆地位于青藏高原东北缘,是印支运动之后发展起来的中、新生代大型山间含油气盆地,经历了多期构造运动(张景廉等,2008;孙国强等,2010),平面形态似三角形,西北为阿尔金山、东北为祁连山、南侧为东昆仑山(杨永恒等,2019;蒋赟等,2020)(图1a)。三湖坳陷位于盆地东南部,西起船形丘构造、东止南北霍布逊湖、北接一里坪坳陷和柴北缘隆起、南至昆仑山山前边界断裂,是盆地第四系的沉积中心,面积约为30 000 km2(郭泽清等,2011;周铁锁等,2020)(图1b)。坳陷基底稳定、褶皱和断层均不发育,可划分为中央凹陷区和四个斜坡区(孙平等,2013;单俊峰等,2019)。涩北地区位于东台吉乃尔湖与涩聂湖之间,是中央凹陷区和北斜坡区的过渡地带。该区被第四系大面积覆盖,从下到上发育涩北组、察尔汗组、达布逊组和盐桥组,不同区域保存的层段和厚度有所差异,岩性组合以泥岩、粉砂质泥岩、泥质粉砂岩、碳质泥岩以及顶部的盐岩交互沉积为特征,沉积相以滨浅湖为主(朱筱敏等,2002;杨辉等,2012;孙平等,2013)(图1c)。涩北组和察尔汗组为本文重点研究层位,沉积厚度大,可统称为七个泉组,是一套稳定、连续的湖相沉积,主要为灰黑色泥岩(Yin et al.,2021;王波等,2025)。

图 1 (a,b)柴达木盆地三湖坳陷构造简图(据朱筱敏等,2002;杨辉等,2012;孙平等,2013修改)及(c)第四系地层柱状图(据王波等,2025修改)
Figure 1. (a, b) Tectonic map (modified from Zhu et al., 2002; Yang et al., 2012; Sun et al., 2013) and (c) stratigraphic histogram (modified from Wang et al., 2025) of the Quaternary Formation in the Sanhu Depression, Qaidam Basin
-
分别从柴达木盆地三湖坳陷涩北地区的涩探1井(ST1井)、涩探2井(ST2井)第四系钻孔岩心采集了78件新鲜、受成岩作用影响较弱的含粉砂泥岩、粉砂质泥岩或泥岩样品,其中,ST1井的19个样品连续取自1 208.03~1 319.88 m深度范围,ST2井的59个样品连续取自1 680.83~1 745.88 m深度范围(图2)。

图 2 (a)研究区第四系等厚图(Yin et al.,2021)及(b,c)采样井岩性柱状图
Figure 2. (a) Isopach map of the Quaternary in the study area and (b, c) lithologic column of sampling wells
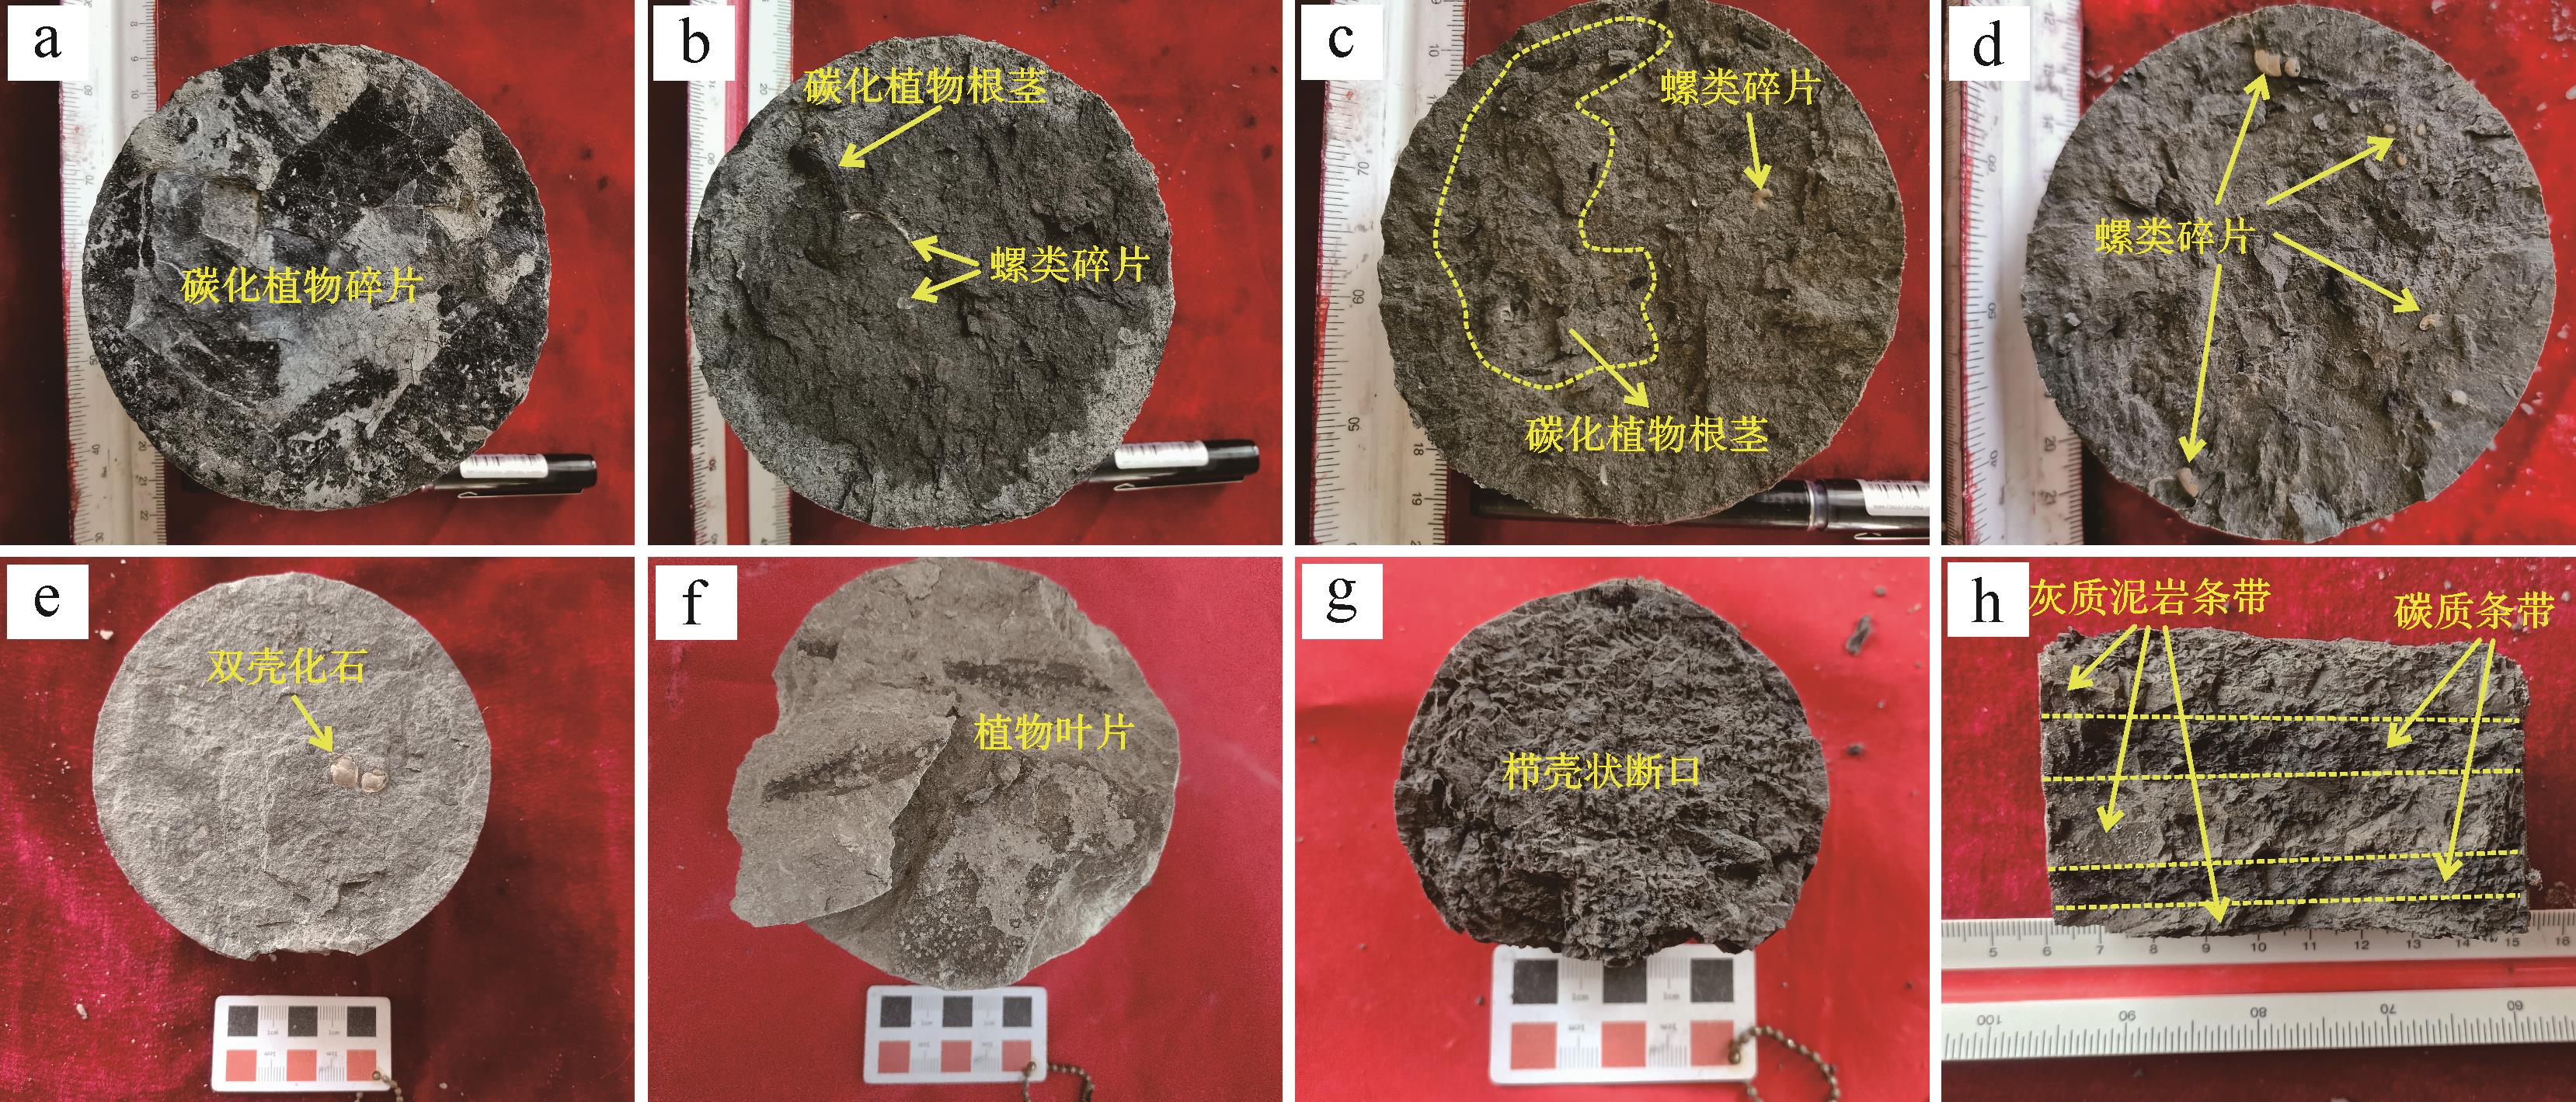
研究样品主要为灰色泥岩和灰色、灰绿色粉砂岩,少量碳酸盐岩,其中泥岩包括含粉砂泥岩、粉砂质泥岩和含灰粉砂质泥岩,粉砂岩包括泥质粉砂岩和云质粉砂岩,发育部分白云岩,发育块状、条带状、纹层状构造,常见粉砂岩条带、碳质条带、灰质泥岩条带互层(图3)。

图 3 研究区第四系典型砂泥岩岩心照片
Figure 3. Typical Quaternary sand and mudstone cores from the study area
用锉刀处理样品,去除表面灰尘和风化部分,将样品用钢研钵研磨破碎后,用标准分样筛过筛保留小于200目的部分,准备好要称量的样品放在105 ℃烘箱中烘干4 h,随后保存于干燥器中冷却,在显微镜下观察样品的组成和结构以确保用于分析测试的两口井的所有样品没有经历蚀变、矿化或二次风化之后,进行主量元素分析、无机元素微量分析和稀土元素分析,主量元素使用扫描型波长色散X射线荧光光谱仪(XRF,Thermo Arl Advant XP+)进行测试,微量和稀土元素使用激光耦合等离子体质谱仪(ICP-MS)进行测试。检测均在温度为25 ℃、湿度为40%的条件下进行,检测设备为AXIOS mAX X射线荧光光谱仪。全岩主微量元素地球化学测试均委托深地科技(北京)有限公司地质实验室完成。
-
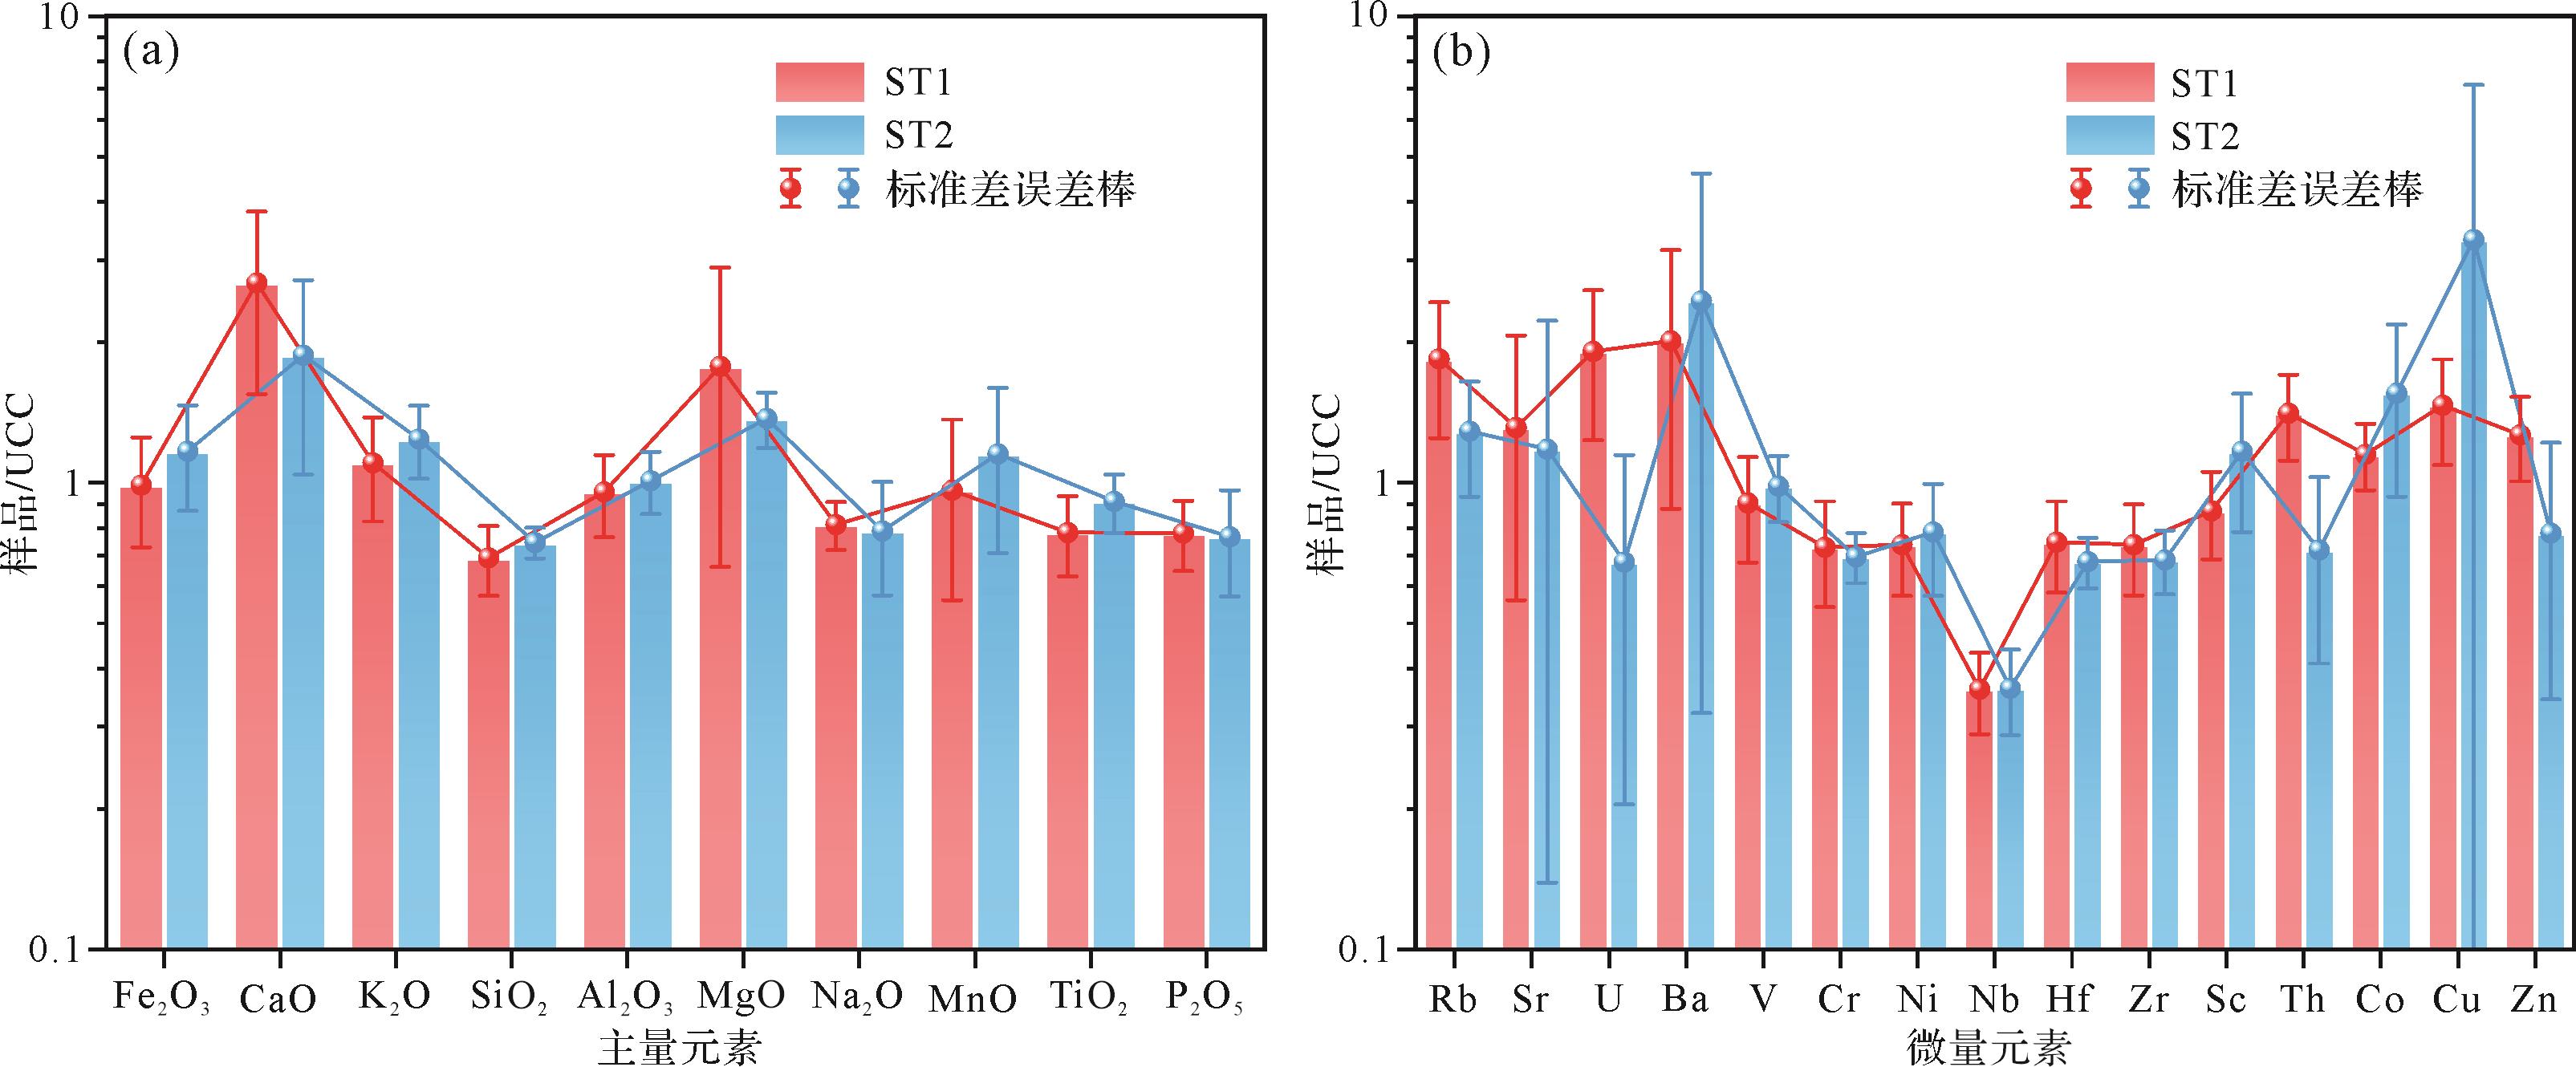
研究区样品主量元素测试结果见表1所示,SiO2含量介于21.08%~54.62%,平均为47.83%,低于后太古宙澳大利亚平均页岩值(PAAS,SiO2=62.80%)(Taylor and McLennan,1985),SiO2、Al2O3和Na2O的平均值均略低于上大陆地壳值(Upper Continental Crust,UCC),CaO、Fe2O3、MgO和K2O的平均值均略高于上大陆地壳值(Taylor and McLennan,1985)。样品具有低硅(SiO2=48.17%)、高铝(Al2O3=15.23%,铝指数A/NK=2.54,铝饱和指数A/CNK=1.59)、富镁钙(MgO=3.81%,CaO=7.91%)、较富铁(Fe2O3=4.99)、较低的全碱含量(K2O+Na2O=5.94%)的特征。根据大陆上地壳平均含量将样品主量元素标准化,从UCC标准化蛛网图(图4a)中可以发现ST1井、ST2井的主量元素整体相似性较好,SiO2含量相对UCC表现为亏损,Al2O3、Fe2O3、K2O、Na2O、MnO、TiO2、P2O5含量与UCC含量相当,CaO、MgO含量相对UCC表现为较明显的富集。
表 1 ST1井、ST2井样品主量元素含量(%)及相关参数
Table 1. Main element contents in samples from well ST1 and well ST2
样品 ST1 ST1平均值 ST2 ST2平均值 ST1+ST2平均值 UCC平均值 SiO2 21.08~52.54 46.00 38.76~54.62 49.65 48.17 66.60 Al2O3 7.56~18.10 14.73 8.41~18.34 15.57 15.23 15.40 Fe2O3 3.24~9.21 4.99 3.74~10.93 5.89 5.52 5.04 CaO 4.01~19.12 9.62 1.23~15.85 6.75 7.91 3.59 MgO 3.05~13.83 4.41 2.52~4.60 3.41 3.81 2.48 K2O 1.42~4.06 3.09 1.65~4.21 3.48 3.32 2.80 Na2O 1.65~3.10 2.66 1.79~4.75 3.41 2.61 3.27 MnO 0.07~0.21 0.10 0.04~0.25 0.12 0.11 0.10 TiO2 0.27~0.63 0.50 0.32~0.73 0.58 0.55 0.64 P2O5 0.09~0.15 0.12 0.09~0.22 0.12 0.12 0.15 Al2O3/TiO2 22.33~37.74 29.61 16.41~33.93 26.89 27.99 24.06 SiO2/Al2O3 2.73~3.97 3.15 2.63~4.65 3.25 3.21 4.32 Na2O/K2O 0.59~1.45 0.92 0.52~1.14 0.75 0.82 1.17 Fe2O3/K2O 1.24~3.14 1.66 1.26~2.85 1.73 1.70 1.80 A/CNK 0.34~1.64 1.03 0.49~1.93 1.27 1.18 1.59 A/NK 2.23~2.84 2.54 2.06~2.82 2.59 2.57 2.54 CIA 47.49~57.66 52.75 46.19~58.06 54.32 53.69 CIW 54.39~69.98 62.26 53.99~71.47 62.23 64.03 WIP 65.83~86.46 76.35 50.24~96.37 75.45 75.82 ICV 1.42~6.10 2.08 1.46~2.69 1.73 1.87 注: UCC为上大陆地壳,数据引自Taylor and McLennan(1985);铝饱和指数A/CNK=Al2O3/(CaO+Na2O+K2O);铝指数A/NK=Al2O3/(Na2O+K2O);化学蚀变指数CIA=n(Al2O3)/[n(Al2O3)+n(CaO*)+n(Na2O)+n(K2O)]×100,CaO*指的是仅存于硅酸盐中CaO的数量,不包括碳酸盐和磷酸盐矿物,计算方法:CaO剩余=CaO-P2O5×10/3,若CaO剩余<Na2O,令CaO*=CaO剩余,若CaO剩余>Na2O,令CaO*=Na2O,n指摩尔量;CIW=100×[Al2O3/(Al2O3+CaO*+Na2O)];ICV=[n(Fe2O3)+n(K2O)+n(Na2O)+n(CaO*)+n(MgO)+n(MnO)+n(TiO2)]/n(Al2O3);WIP=[(2Na2O/0.35+MgO/0.9+2K2O/0.25+CaO*/0.7)]×100。
图 4 样品主、微量元素/UCC均一化蛛网图
Figure 4. Main and trace elements /UCC homogenization spider diagram of the sample
-
研究区微量元素测试结果如表2所示,其中含量最高的是Ba、Sr和Zr,与UCC各元素含量相比,Ba和Cu含量明显更高,Ba的平均含量为1 418.68 μg/g,远高于UCC平均值(628 μg/g),Cu的平均含量为69.86 μg/g,远高于UCC平均值(28 μg/g)。Nb元素含量明显偏低,平均为9.62 μg/g,远低于UCC平均值(27 μg/g),其余微量元素含量均与UCC相当,具有Ba和Cu富集,Nb亏损的特征。
-
研究区稀土元素整体含量介于55.96~223.97 μg/g,平均为162.22 μg/g,变化范围较大,低于北美页岩平均值173.21 μg/g,高于上大陆地壳平均值(128.44 μg/g,Taylor and McLennan,1985),轻稀土元素/重稀土元素(LREE/HREE)介于4.92~12.96,平均为9.82,高于北美页岩(7.5),(La/Yb)N含量介于0.84~1.73,平均为1.35,低于UCC平均值(1.50),反映稀土元素分馏程度不高,Sm/Nd介于0.17~0.23,平均为0.21,略高于大陆上地壳平均值(0.17)。δEu含量介于0.67~1.23,平均为0.95,δCe含量介于0.77~0.99,平均为0.85,Ceanom介于-0.086 8~0.018 0,平均为-0.059,δEu、δCe和Ceanom均低于大陆上地壳平均值,呈弱负异常。
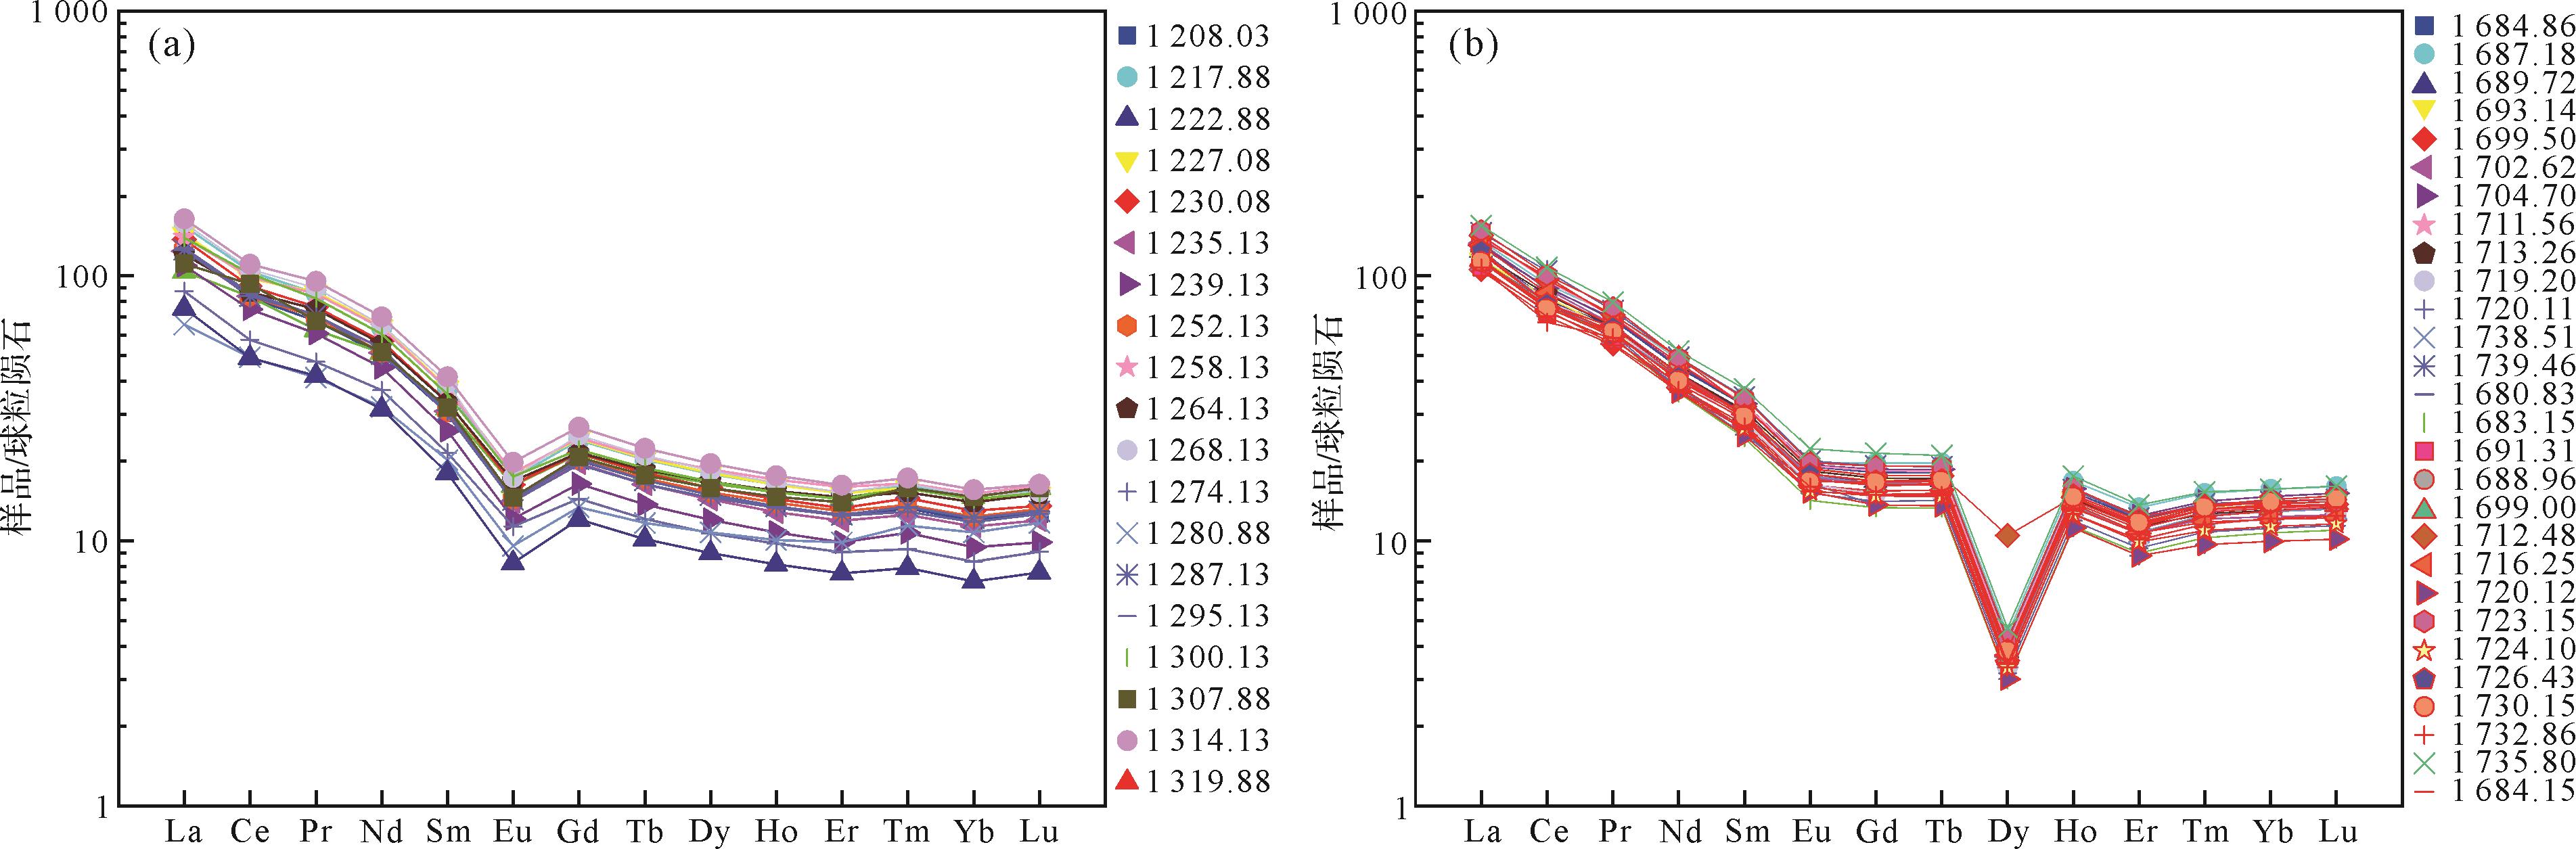
两口井的稀土元素北美页岩标准化曲线(图5)整体上均表现出轻稀土相对富集、曲线陡峭,重稀土相对亏损、曲线平缓的右倾趋势,显示源岩成分与上地壳的长英质成分相似,ST1井样品表现出Eu强烈亏损(图5a),ST2井样品表现出Eu轻微亏损、Dy强烈亏损(图5b)。两口井样品具有不一致的稀土元素配分曲线,表明研究区第四系沉积物可能具有不同的物源。

图 5 稀土元素北美页岩标准化配分模式图
Figure 5. Standardized distribution pattern of rare earth elements in North American shale
-
沉积岩的地球化学成分在受源区特征控制的基础上,也会受到风化、再旋回作用以及成岩作用的影响,改变沉积岩化学成分,导致运用地球化学特征判断源区不准确,所以需要对干扰因素进行讨论(李俊等,2024)。
-
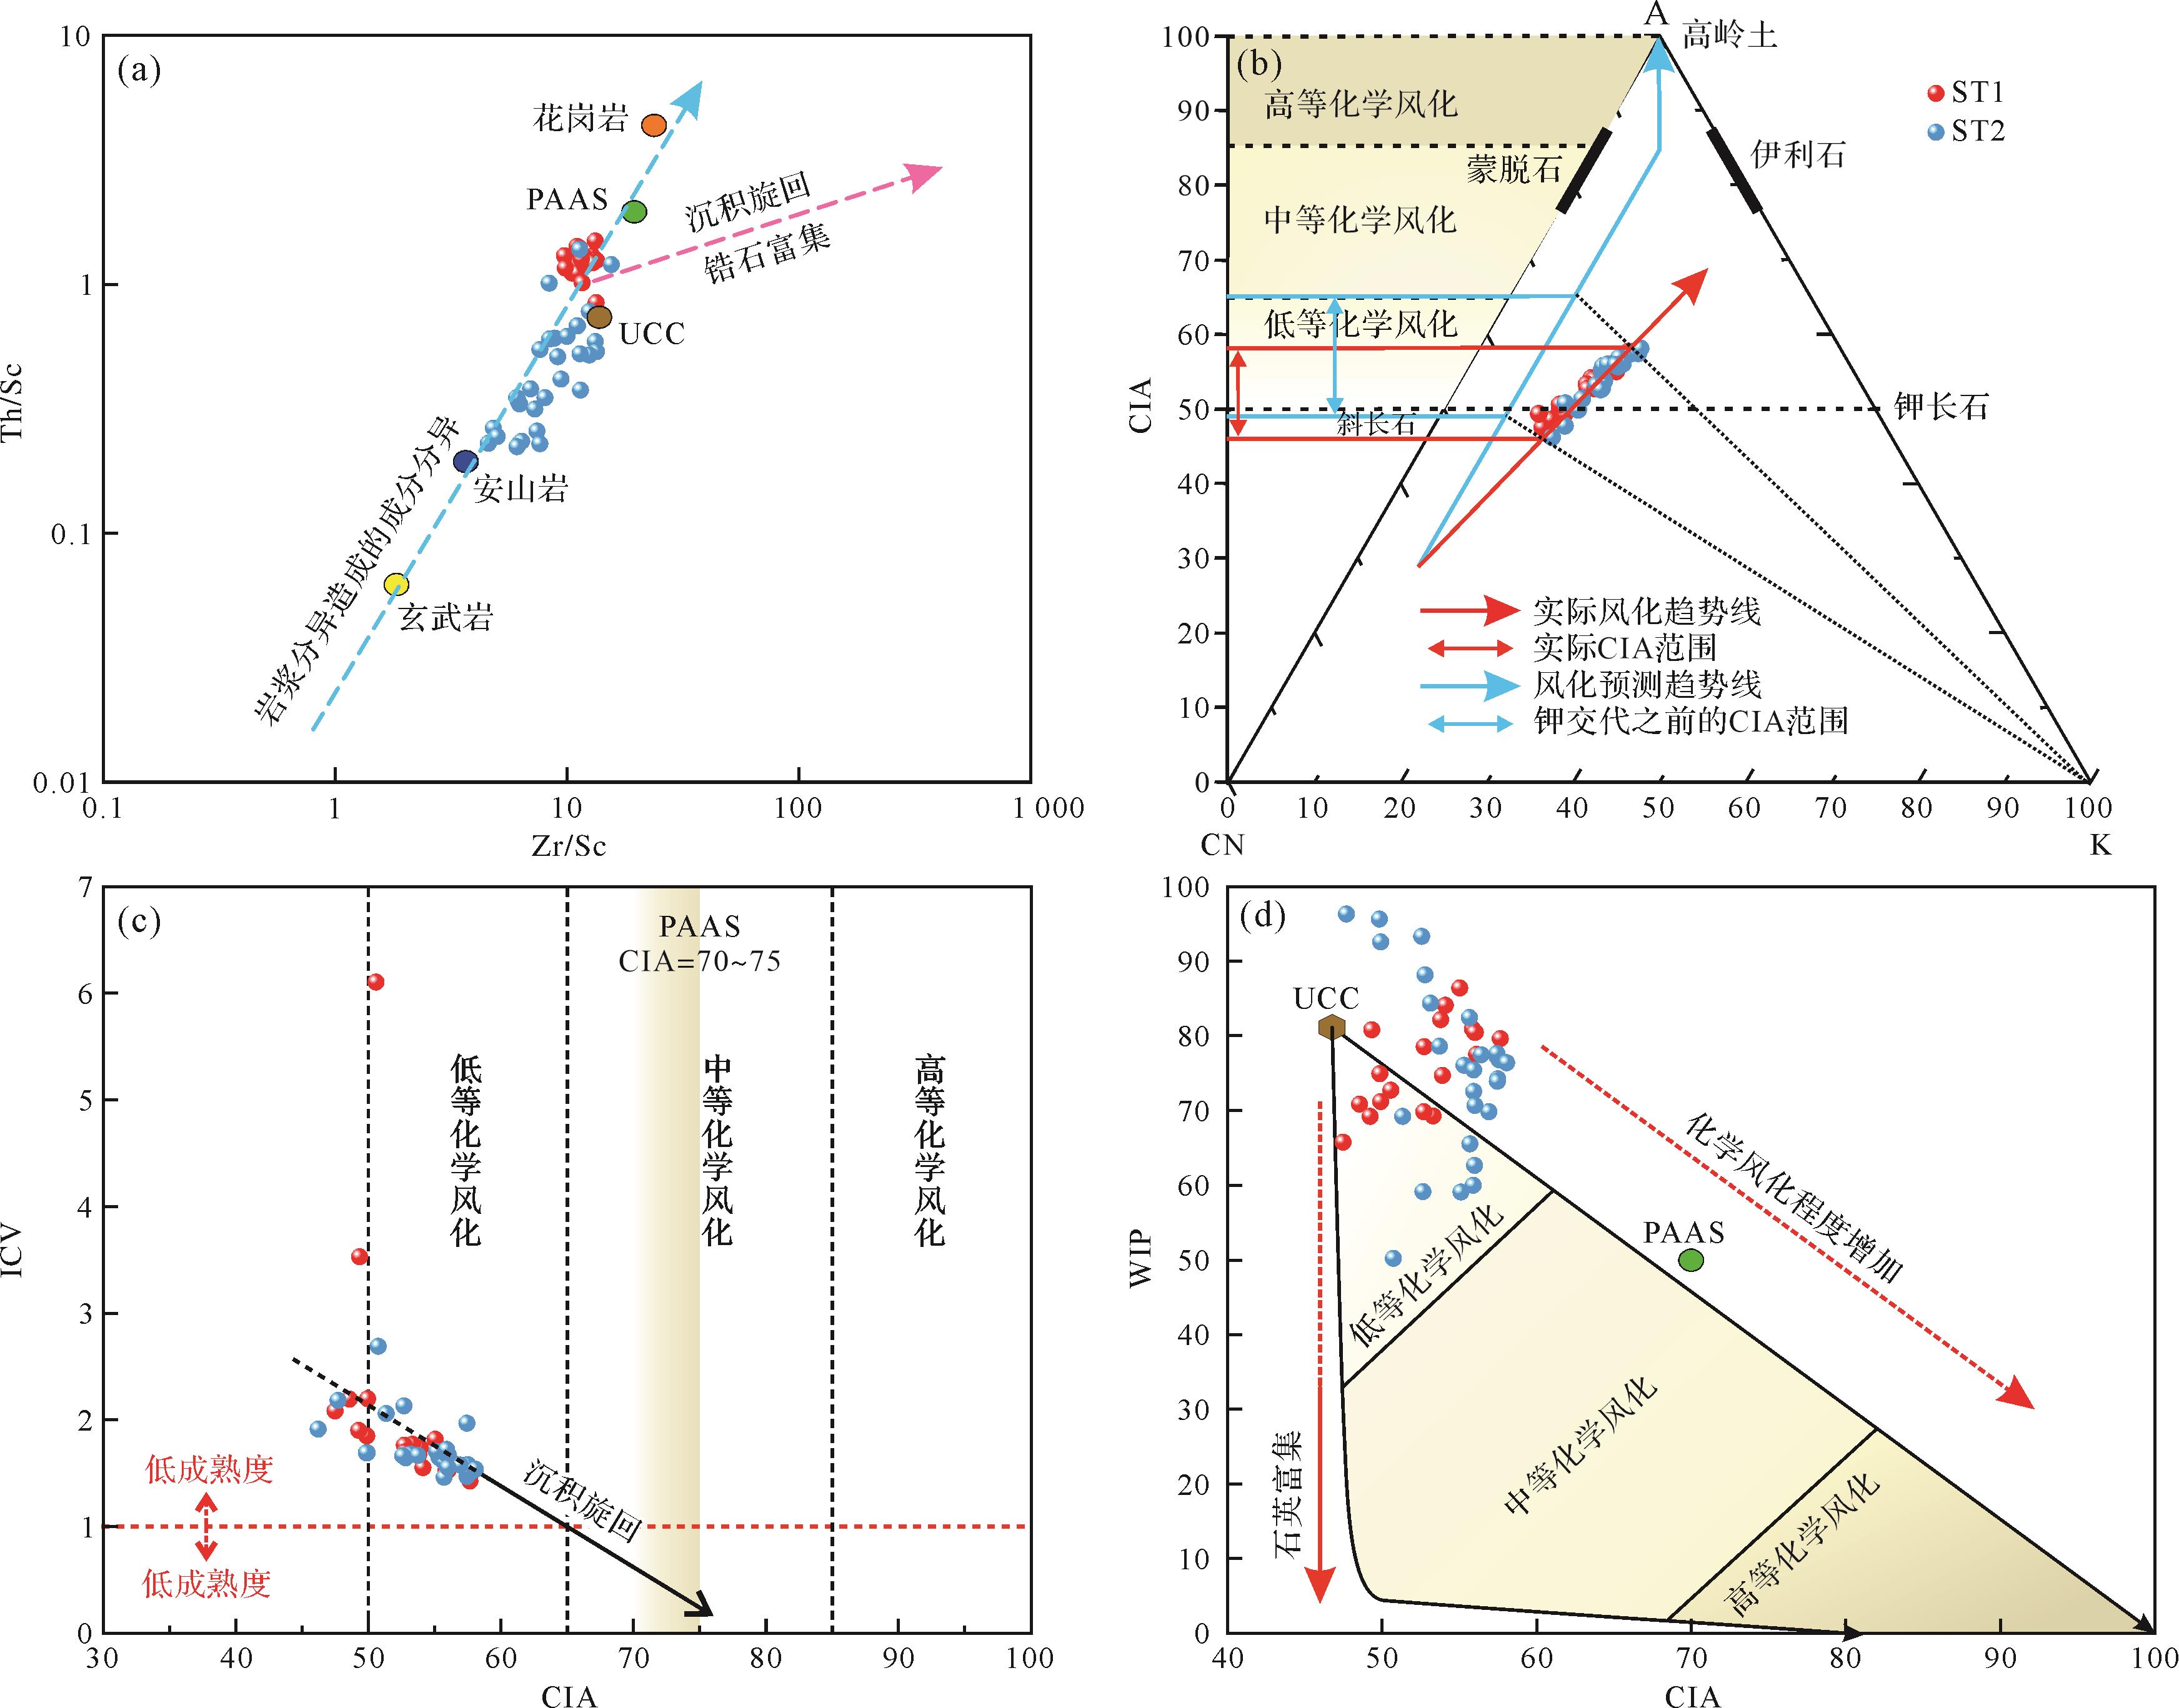
黏土及粉砂级全岩样品可以减少搬运过程中分选作用对物源区成分的影响,本文所采用的样品均为成岩作用弱的泥岩或粉砂质泥岩,其地球化学特征可以基本反映沉积物物源区的物质组成特征(张茜等,2020)。Th/Sc-Zr/Sc交会图能够反映沉积物是否受到分选以及再循环作用的影响(McLennan,1993)。沉积再循环会轻微提高沉积岩的Th/Sc值,而大幅度提高Zr/Sc值。在Th/Sc-Zr/Sc判别图中,Th/Sc和Zr/Sc值变化趋势与成分分异演化线正相关性较强,ST1、ST2几乎所有点均沿着玄武岩—安山岩—英安岩—UCC—花岗岩成分演化线分布,且主要在上地壳长英质附近(图6a),这表明沉积物没有受到沉积分选和再循环作用的影响或只经历了微弱的沉积再循环。在[Al2O3-(CaO*+Na2O)-K2O](A-CN-K)三角图中(图6b),样点呈线性关系,近似平行于预测化学风化趋势线,说明钾的交代作用对样品影响较小。

图 6 样品Th/Sc⁃Zr/Sc判别图(McLennan,1993)、A⁃CN⁃K三角图(Fedo et al.,1995)、ICV⁃CIA(Deng et al.,2019)、WIP⁃CIA(Garzanti et al.,2013)交会图
Figure 6. Sample Th/Sc⁃Zr/Sc discrimination diagram, A⁃CN⁃K triangulation, ICV⁃CIA, and WIP⁃CIA rendezvous diagrams
-
在风化过程中,斜长石比钾长石更容易分解蚀变,矿物中的Na+比K+更容易析出,导致长石类矿物发生黏土化、碱金属离子流失,以致矿物中K2O/Na2O值异常的高(屈李华等,2018),样品K2O/Na2O值平均为1.22,略高于上地壳的0.85,指示母岩经历较弱程度风化。碎屑沉积岩SiO2主要来自石英碎屑,Al2O3主要来自黏土矿物和长石,因此,SiO2/Al2O3可以用来反映沉积物的成熟度,随着石英含量增多,长石和基性矿物减少,SiO2/Al2O3值增大,沉积物成熟度升高(张茜等,2020)。本文样品SiO2/Al2O3值介于2.63~4.65,平均为3.21,具有成熟度低、硅质富集、近物源特征,表明其未经历强烈蚀变作用。
前人研究提出,CIA=50~60,反映弱的风化程度;CIA=60~80,反映中等风化程度;CIA=80~100,反映强烈风化程度(Deng et al.,2019)。ST1井样品的CIA值介于47.49~57.66,平均为52.75,ST2井样品的CIA值介于46.19~58.06,平均为54.32,两口井的平均值为53.69,反映源区遭受弱的风化作用(图6b,c)。CIW值越高,代表的物源区风化程度越强,样品的CIW平均值为64.03,同样显示源岩未经历强烈风化作用。
碎屑岩的ICV>1,指示未风化、低成分成熟度和构造活动带的首次沉积;ICV<1,指示可能经历了强烈的风化作用。研究区第四系样品的ICV值介于1.42~6.10,平均值为1.87(>1),说明样品成分成熟度低、未经历强烈风化作用(图6c)。此外,更低的WIP值通常指示更强的风化作用(Garzanti et al.,2013),样品的WIP值介于50.24~96.37,平均为75.82,CIA-WIP图中,样点均落入低等化学风化区域附近(图6d)。
-
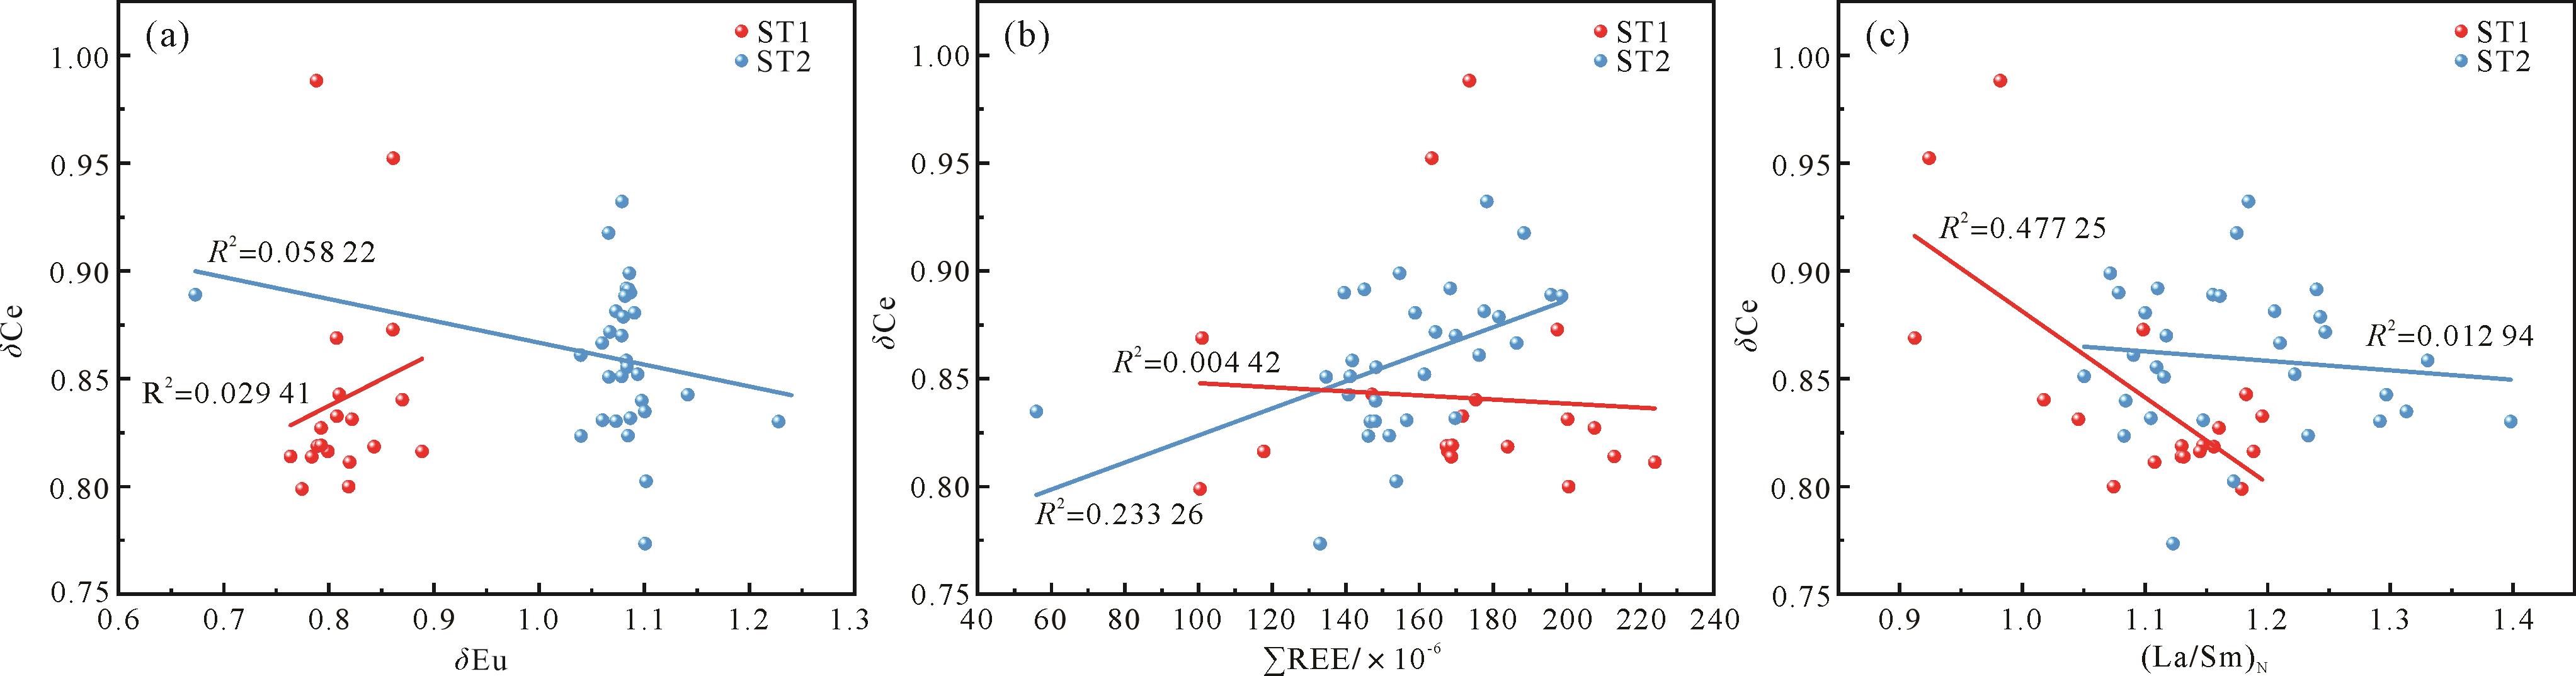
稀土元素的分配模式会受成岩作用影响而发生变化,受成岩作用影响越强,Ce越富集、Eu越亏损,δCe与∑REE、δCe与(La/Sm)N则呈现良好的正相关性,反之亦然(苑广尧和李凤杰,2023)。ST1井样品的δCe与δEu、δCe与∑REE、δCe与∑REE相关系数分别为R2=0.029 41、R2=0.004 42、R2=0.477 25,ST2井样品的δCe与δEu、δCe与∑REE、δCe与(La/Sm)N相关系数分别为R2=0.058 22、R2=0.233 26、R2=0.012 94。两口井样品的δCe与δEu、∑REE和(La/Sm)N的相关性均极低(图7),反映了成岩作用对该组样品的稀土元素分配模式影响较小。

图 7 样品的δCe⁃δEu、δCe⁃ΣREE、δCe⁃(La/Sm)N相关性图解
Figure 7. Correlation diagrams of δCe⁃δEu, δCe⁃ΣREE, and δCe⁃(La/Sm)N of the samples
通过上述综合判断,研究区样品受到的风化、再旋回和成岩作用较弱,地球化学组分从源区到沉积区变化较小,能够有效地反映源区特征,可以用来指示物源和源区属性。
-
利用前人总结的判别参数对本次样品进行分析,认为涩北地区ST1井、ST2井第四系泥岩源区为上地壳长英质岩,可能为古老的地质体、克拉通或是再旋回造山带(张茜等,2020)。依据如下:
(1) 沉积岩的Al2O3/TiO2值一般与其母岩保持一致,当Al2O3/TiO2值介于19~28时,沉积物的母岩可能来源于长英质岩石,当Al2O3/TiO2值小于14时,沉积物的母岩可能来源于镁铁质岩石(张云望等,2023)。两口井样品的Al2O3/TiO2平均值为27.99,反映母岩可能来自长英质岩石。长英质的物源一般具有较低的TiO2/Zr值(<55),中等的TiO2/Zr值(55~200)指示中性的物源,而高的TiO2/Zr值(>200)则指示铁镁质的物源(Hayashi et al.,1997)。两口井样品的TiO2/Zr平均值均低于55,指示长英质火成物源区。代表超铁镁—铁镁质组分的铬铁矿、橄榄石和辉石等矿物趋于富集Cr元素,而代表长英质组分的锆石中富集Zr元素(屈李华等,2018)。ST1井样品Cr/Zr值为0.47,ST2井样品Cr/Zr值为0.49,明显低于1,反映源岩为长英质。La/Sc、Th/Sc、Cr/Th和Co/Th大体上均指示长英质源区(表3)。
表 3 样品与不同源岩相关参数对比表
Table 3. Correlation parameters between samples and different source rocks
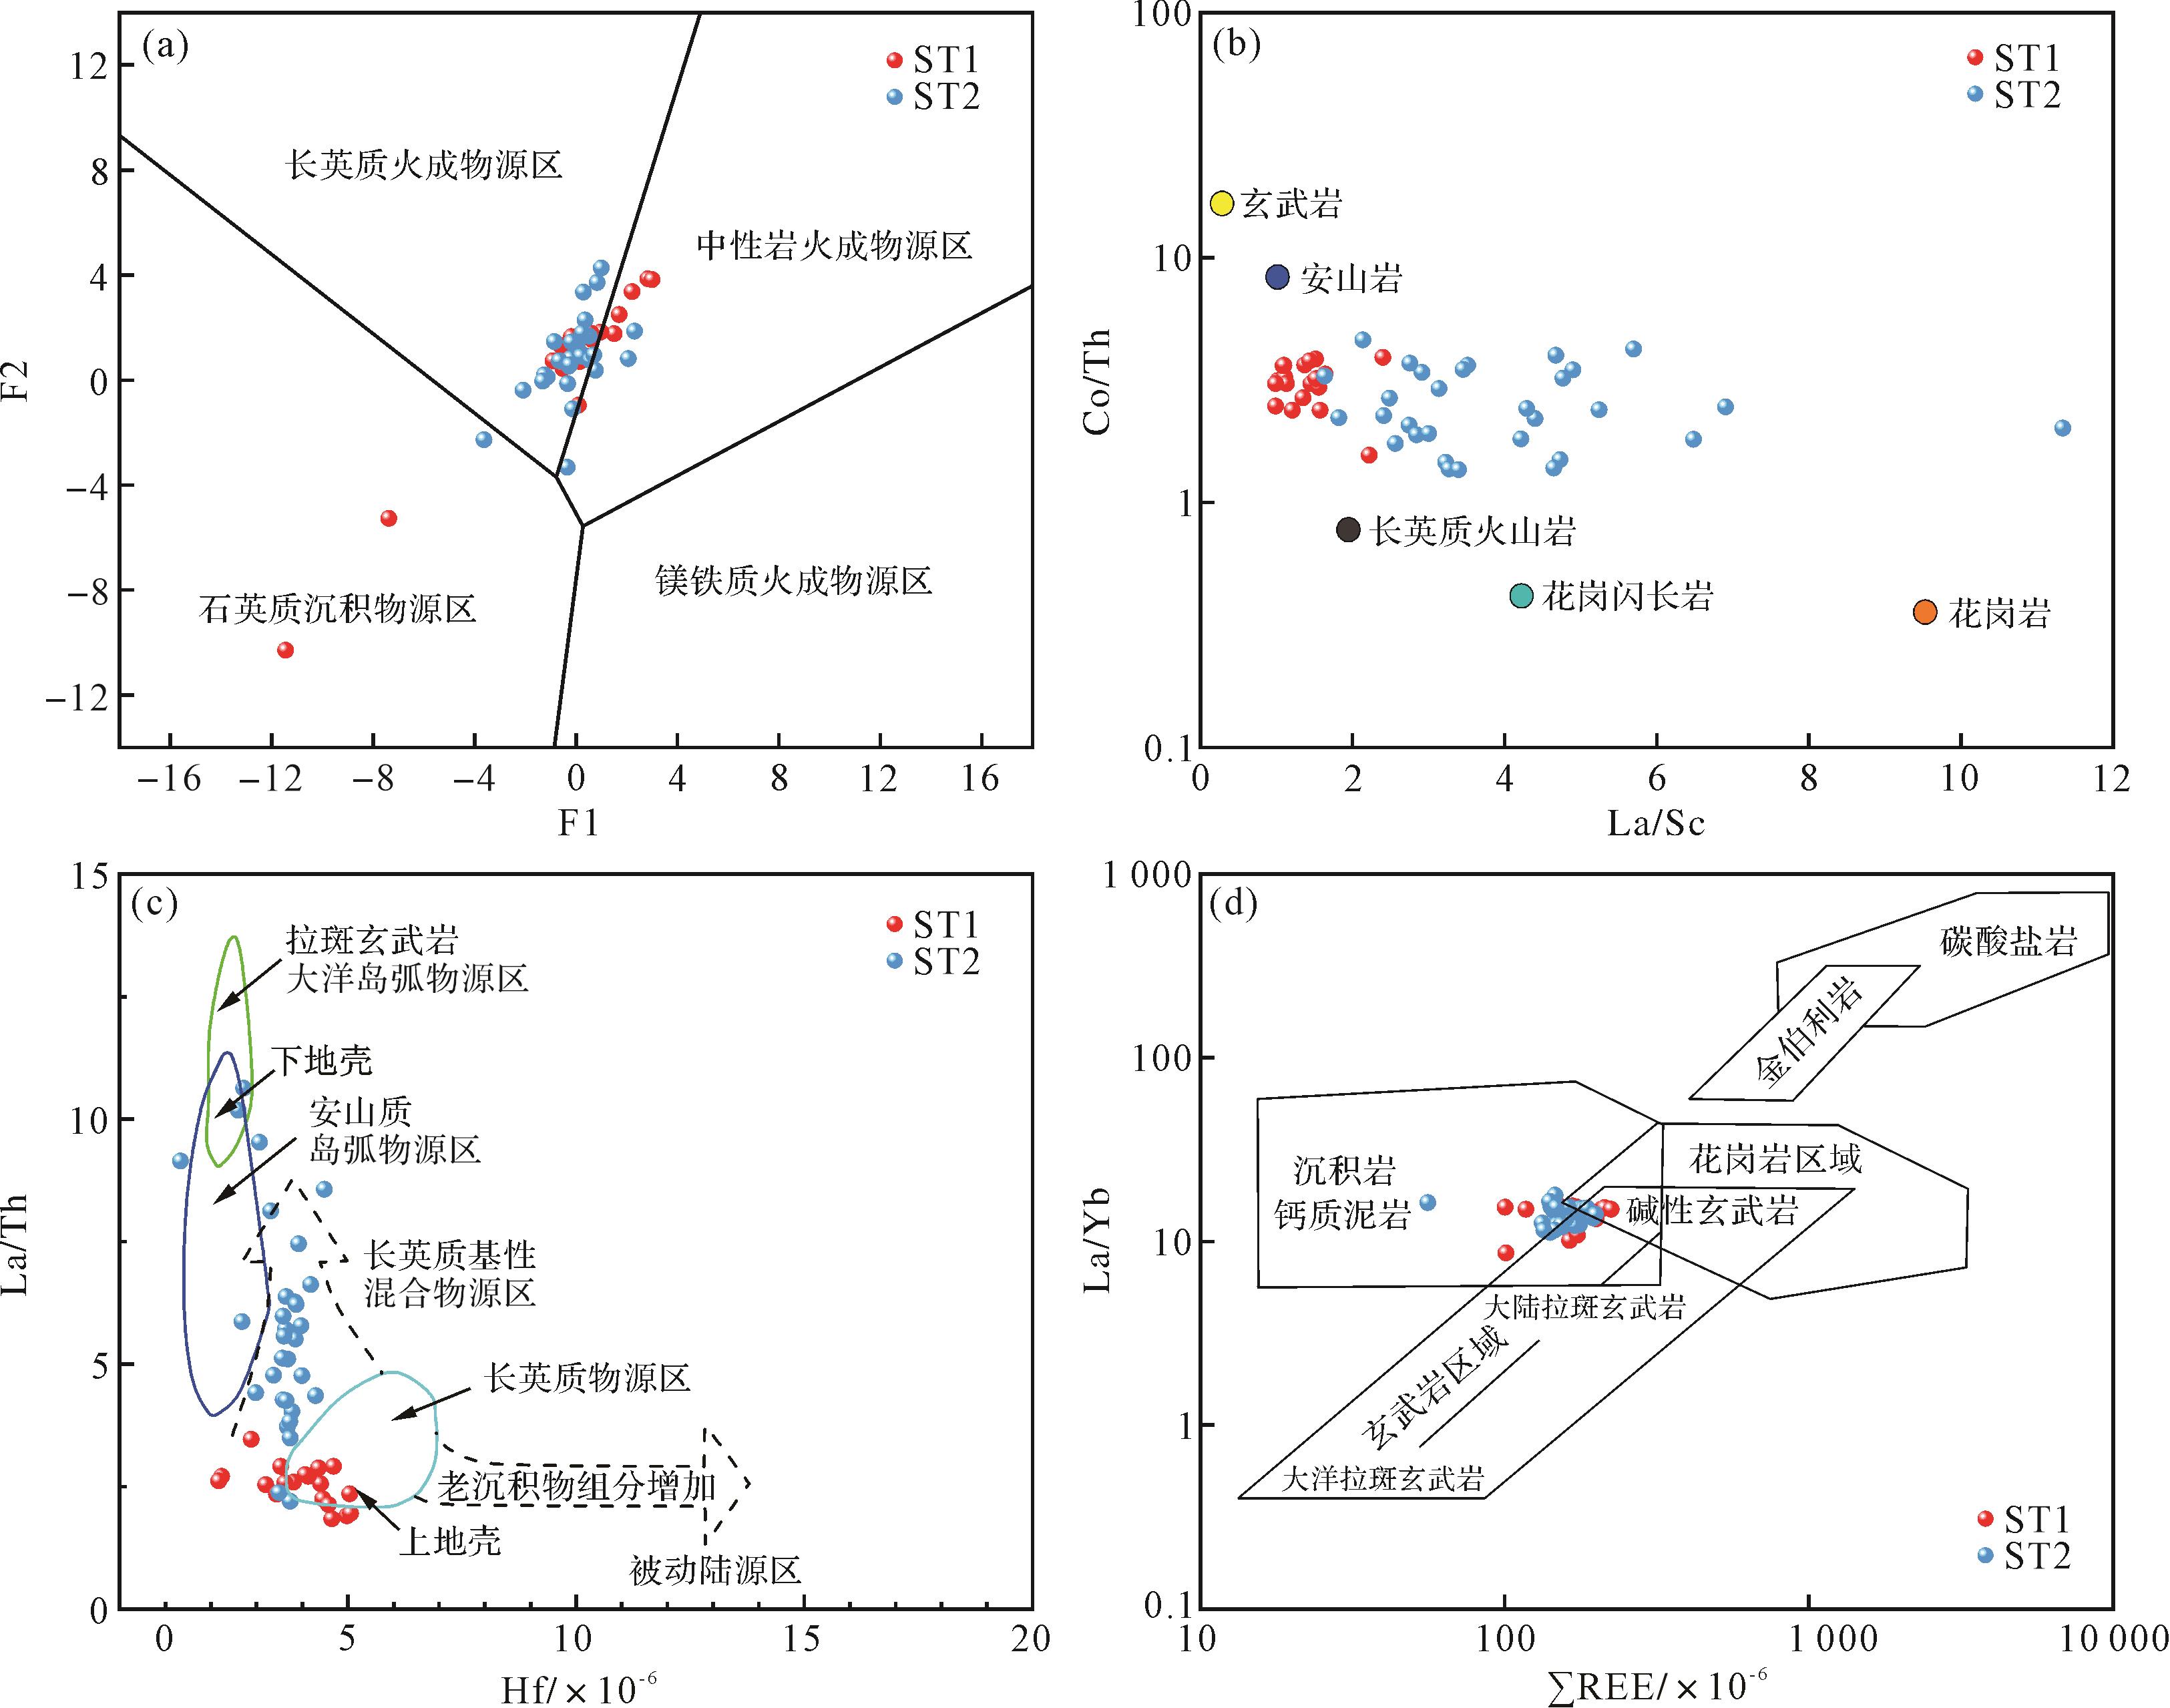
判别参数 长英质源区 铁镁质源区 ST1 ST2 ST1+ST2 Al2O3/TiO2 19-28 <14 29.61 26.89 27.99 TiO2/Zr <55 >200 35.86 45.31 41.49 Cr/Zr <1 >1 0.47 0.49 0.48 La/Sc 2.50-16.00 0.40-1.10 3.11 2.55 2.76 Th/Sc 0.83-20.00 0.04-0.05 1.23 0.50 0.78 Cr/Th 0.50-7.70 22.00-100.00 4.56 9.58 7.67 Co/Th 0.22-1.50 7.10-8.30 1.40 4.819 3.52 注: Al2O3/TiO2数据来自张云望等(2023),TiO2/Zr数据来自Hayashi et al.(1997) ,Cr/Zr数据来自屈李华等(2018),La/Sc、Th/Sc、Cr/Th、Co/Th数据来自Cullers(1994)。(2) 根据TiO2、Al2O3、Fe2O3、MgO、CaO、Na2O、K2O而建立的多变量判别函数图解进行投图,样品在限定物源区特征的F1-F2图解中,大部分投在了长英质火成物源区,少数投在中性岩火成物源区,只有个别样点落入石英质沉积物源区和中性岩火成物源区(图8a)。

图 8 泥岩物源属性判别图解
Figure 8. Source rock attribute discrimination diagram
(3) 所有样品均具有低而相对稳定的Co/Th的值,La/Sc值的变化范围较大,Co/Th-La/Sc判别图解反映ST1、ST2井的样品源区主要为长英质岩石(图8b)。
(4) La/Th-Hf判别图解显示,ST1井、ST2井的大多数样品投点落在上地壳、长英质物源区和长英质/基性混合物源区范围内,ST1井样品更偏向上地壳物源,ST2井样品更多落在长英质和基性岩混合源区(图8c)。
(5) 沉积物的稀土元素化学性质稳定,其配分模式整体保留了源岩的分配特征,对揭示物源具有重要指示意义(刘兵等,2022)。在La/Yb-ΣREE图中(图8d),ST1井、ST2井泥岩样品投点位于沉积岩、花岗岩交界区域,少部分落在玄武岩区域边缘,进一步说明ST1井、ST2井的大多数样品均来自上地壳,成分主要受到长英质源区影响。
-
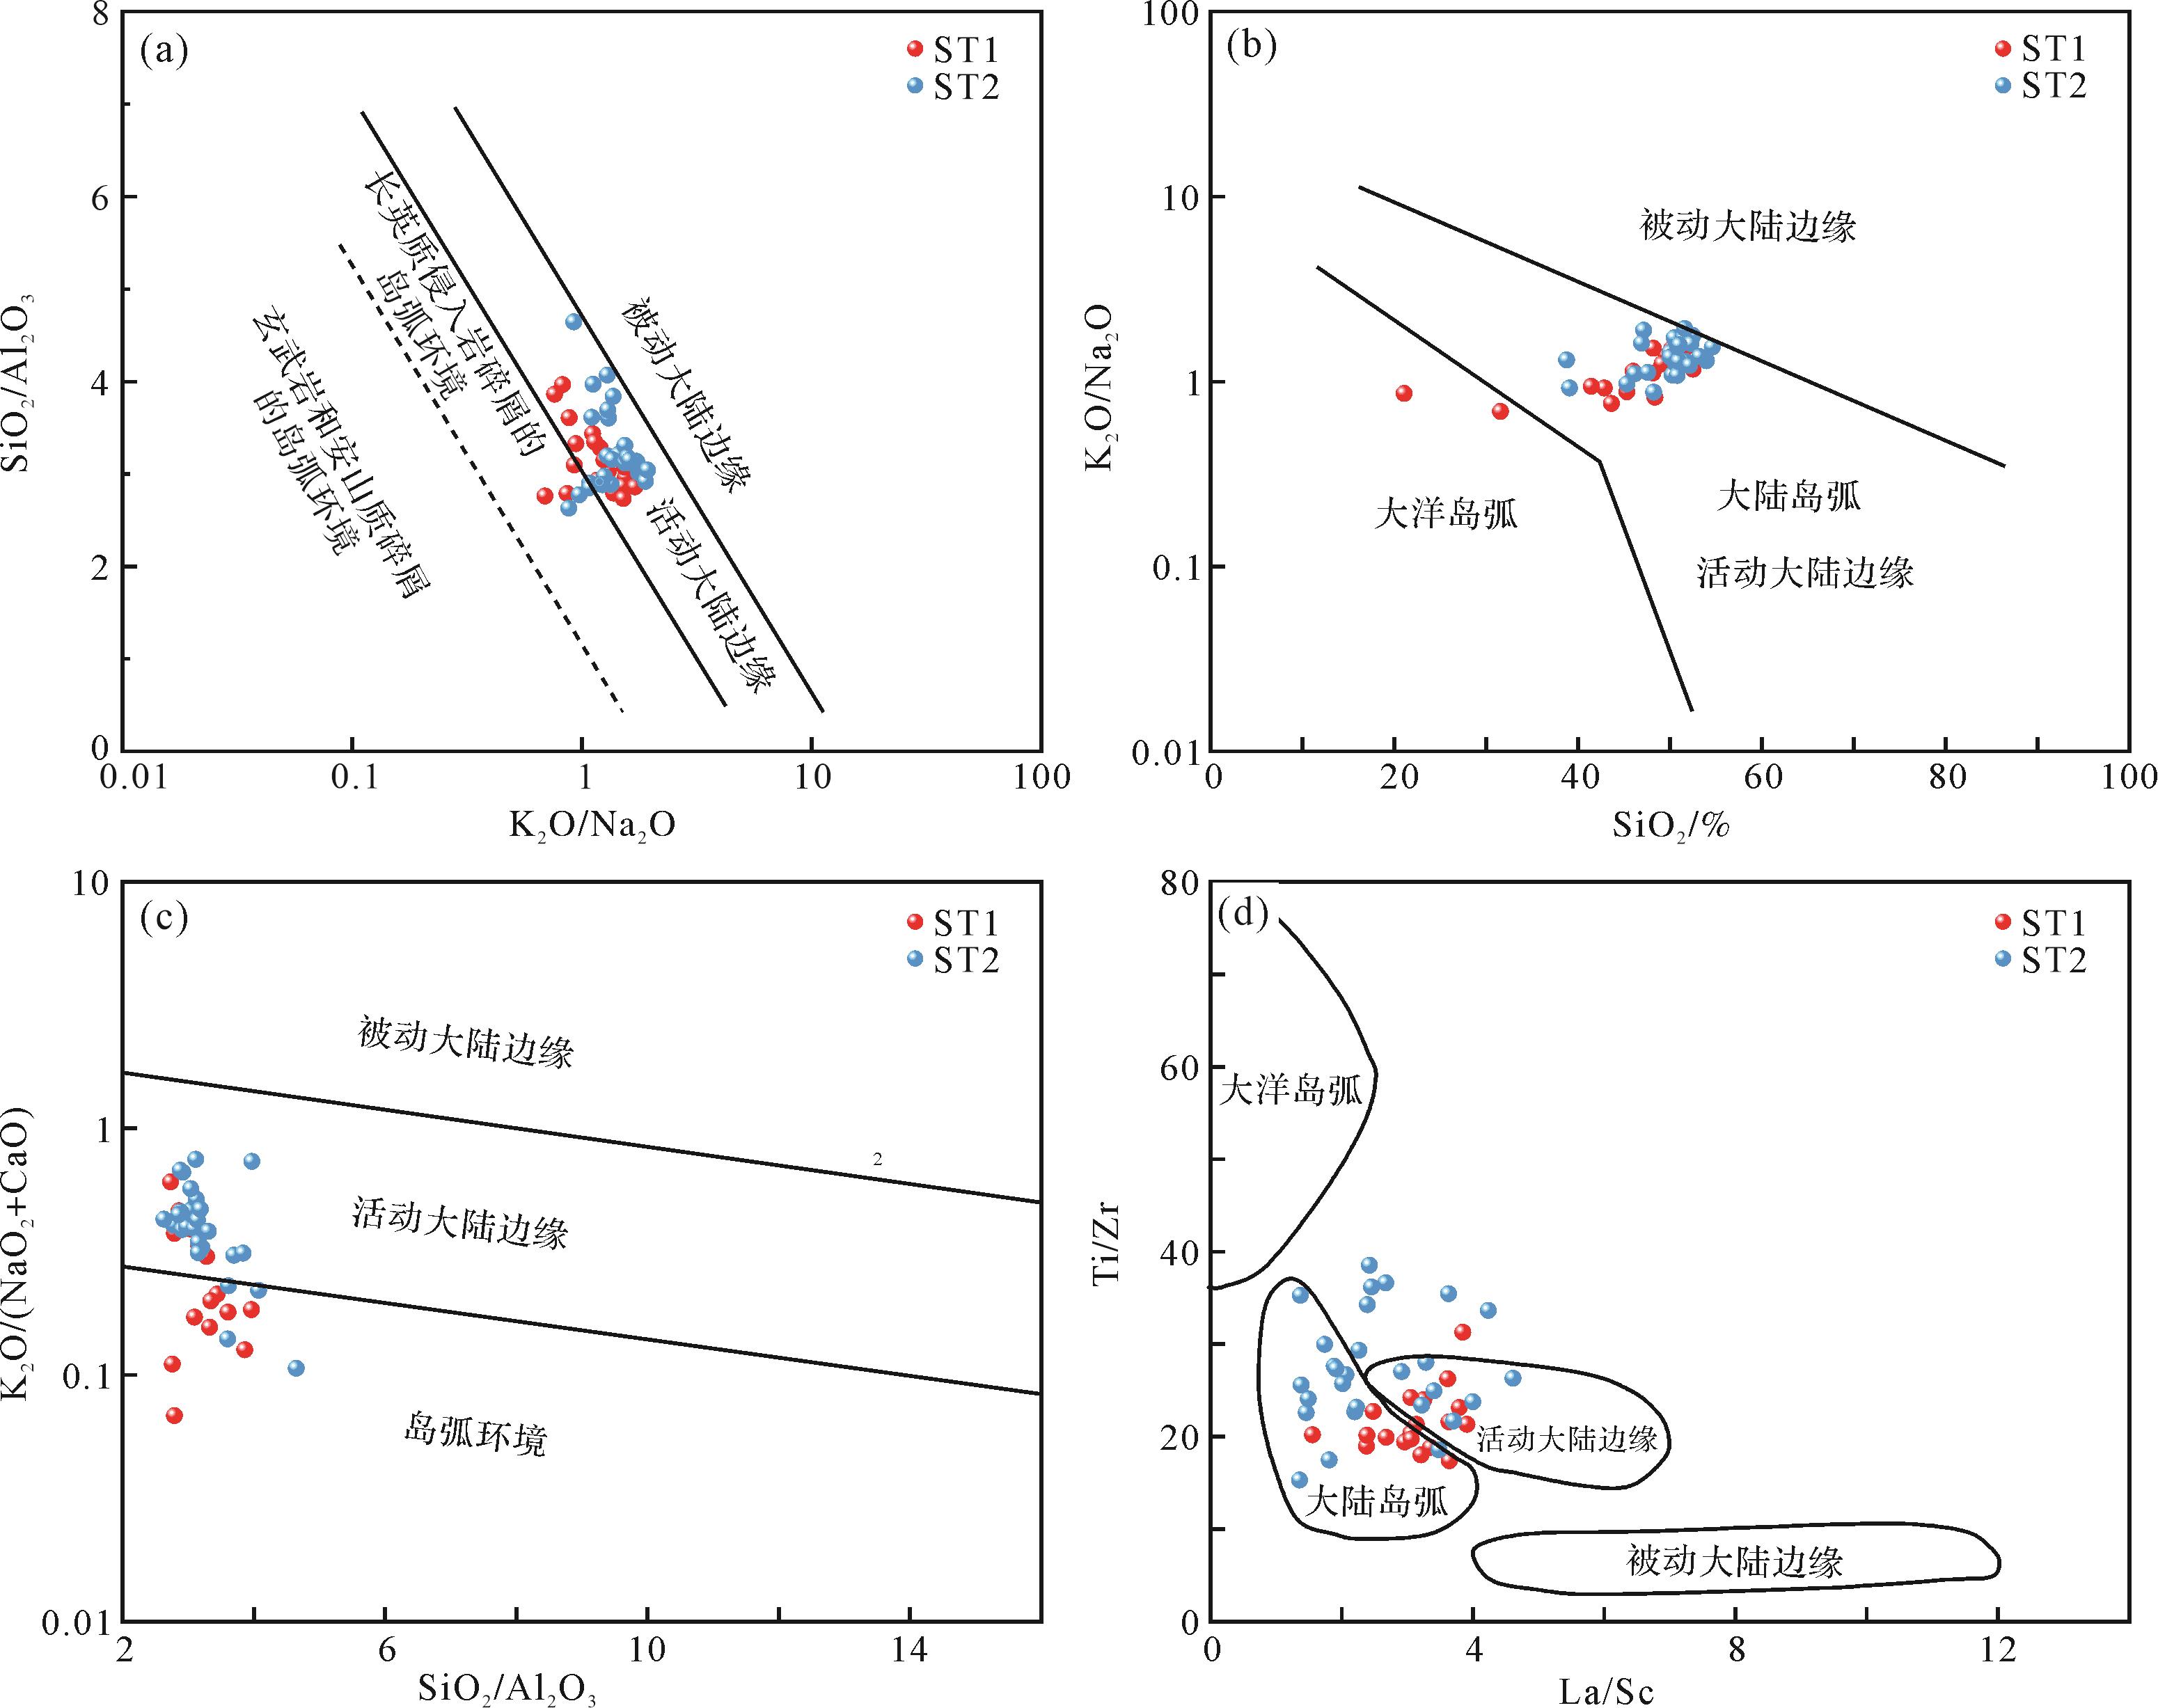
大地构造背景和物源条件是决定碎屑沉积岩地球化学特征最重要的因素,因此,碎屑沉积岩地球化学特征不仅能示踪物源条件,也能准确判别沉积岩源区的大地构造背景(Liu et al.,2021)。碎屑岩中的La、Zr、Th、Co和Sc等含量对构造环境极为敏感,是良好的大地构造背景指标(Bhatia and Crook,1986)。SiO2/Al2O3-K2O/Na2O图解和K2O/Na2O-SiO2图解(Roser and Korsch,1986,1988)显示(图9a,b),样品几乎所有的点均投到活动大陆边缘区和岛弧区域内,个别点落在大洋岛弧和被动大陆边缘区域。

图 9 源区构造背景判别图解
Figure 9. Illustration of the tectonic background of the source area
方国庆(1993)认为SiO2/Al2O3大致表示石英的富集程度,K2O/(Na2O+CaO)值能较好地反映出物源区性质及砂岩成熟度的高低,随着石英富集程度降低,SiO2/Al2O3值减小,构造环境从被动大陆边缘向活动大陆边缘和岛弧环境转化,K2O/(Na2O+CaO)-SiO2/Al2O3图解显示样品大部分均分布于活动大陆边缘区域,仅少数样品偏移落入岛弧环境区域。在Ti/Zr-La/Sc构造环境判别图解中,样品投点主要落在活动大陆边缘和大陆岛弧区域附近(图9c,d)。
Bhatia and Crook(1986)认为Th、Sc、Co等很难被分解、不易受风化搬运以及沉积作用的影响,能很好地反映物源区的地球化学性质,故可以应用在沉积物源以及构造背景的研究中。La-Th-Sc、Th-Co-Zr/10和Th-Sc-Zr/10图解是较为有效的微量元素源区构造背景判别图解,将构造背景分成四种:大洋岛弧、大陆岛弧、活动大陆边缘及被动大陆边缘,三湖地区第四系泥岩均投点于活动大陆边缘和大陆岛弧区域,与上述结果相吻合。
Bhatia and Crook(1986)总结了不同构造背景的地球化学参数,本文样品与之对比表明,本区第四系泥岩多与活动大陆边缘和大陆岛弧的元素特征相近(表4)。综上所述,多种图解、参数特征相互印证涩北地区第四系沉积物源区为活动大陆边缘环境,具有构造活动强烈的构造背景。
表 4 样品与不同构造背景相关参数对比表(Bhatia and Crook,1986;Bhatia,1985)
Table 4. Comparison of relevant parameters between samples and different structural backgrounds (Bhatia and Crook,1986;Bhatia,1985)
构造背景 大洋岛弧 大陆岛弧 活动大陆边缘 被动大陆边缘 ST1 ST2 ST1+ST2 ∑REE 58±10 146±20 186 210 171.03 156.82 162.22 LREE/HREE 3.8±0.9 7.7±1.7 9.10 8.50 8.36 10.72 9.82 La/Yb 4.2±1.5 11.0±3.6 12.5 15.9 14.01 13.82 13.89 (La/Yb)N 2.8±0.9 7.5±2.5 8.30 10.80 1.36 1.34 1.35 δEu 1.04±0.11 0.79±0.13 0.60 0.56 0.82 1.07 0.97 Th 2.27±0.7 11.11±1.1 18.8±3 16.7±3.5 14.80 7.31 10.16 U 1.09±0.21 2.53±0.24 3.9±0.5 3.2±0.8 5.17 1.81 3.09 Zr 96±20 229±27 179±33 298±80 142.13 129.63 134.38 Nb 2.0±0.4 8.5±0.8 10.7±1.4 7.9±1.9 9.75 9.54 9.62 Y 19.5±5.6 24.2±2.2 24.9±3.6 27.3±5.3 25.51 22.33 23.54 Nd 11.36±2.9 20.8±1.6 25.4±3.4 29.0±5.03 31.76 25.36 27.79 V 131±40 89±13.7 48±5.9 31±9.9 87.93 93.17 91.18 Cr 37±13 51±6.5 26±4.9 39±8.5 66.90 62.40 64.11 Ni 11±5.1 13±2.0 10±2.5 8±4.4 34.70 36.02 35.52 Rb/Sr 0.05±0.05 0.65±0.33 0.89±0.24 1.19±0.40 0.47 0.37 0.41 Ba/Rb 21.3±5.0 7.5±1.3 4.5±0.8 4.7±1.1 10.69 15.94 13.95 Ba/Sr 0.95±0.60 3.55±1.40 3.8±0.7 4.7±1.3 4.46 5.01 4.80 Th/U 2.1±0.78 4.6±0.45 4.8±0.38 5.6±0.7 3.31 5.10 4.42 Zr/Th 48±13.4 21.5±2.4 9.5±0.7 19.1±5.8 9.69 20.01 16.09 Zr/Y 5.67±1.94 9.6±0.8 7.2±0.4 12.4±4.0 5.62 5.84 5.76 Nb/Y 0.11±0.03 0.36±0.04 0.43±0.04 0.30±0.06 0.39 0.43 0.41 -
印度大陆与欧亚大陆的碰撞、持续汇聚和远程效应使得柴达木盆地周围山脉快速抬升、盆地快速沉降(段磊等,2022)。大量的低温热年代学与盆地分析研究揭示,柴达木盆地南缘东昆仑山在35~25 Ma发生快速隆升,10~15 Ma以来东昆仑断裂带强烈活动,盆地北缘南祁连山自~30 Ma开始变形、抬升、侵蚀,10~15 Ma开始快速隆升并伴随强烈的侵蚀作用,盆地西缘的阿尔金断裂带渐新世强烈左旋走滑,约15 Ma发生显著的构造变形(王伟涛等,2022),河流系统将三大山脉风化、侵蚀的碎屑物质搬运到沉降盆地中;即柴达木盆地南、北、西三侧造山带(断裂带)均已成为沉积物源区。第四纪继承了古近纪—新近纪盆地南、北、西三向物源区特点,物源分布具有区域性,不同沉积部位受各物源供给影响不同。三湖坳陷位于盆地中东部,在第四纪属于盆地沉积中心,距离西缘阿尔金山物源较远。前人在三湖坳陷的第四系重矿物、沉积特征物源研究表明(田继先等,2009;郭泽清等,2010),三湖坳陷主要受到南部昆仑山物源控制,第四系乌图美仁河、格尔木河、大灶火河等均可能为其搬运剥蚀物质,其次为东北部埃坶尼克山物源,北部祁连山弱物源控制,这与此次研究结论吻合(Cheng et al.,2021)。ST1和ST2地球化学特征具有相似性,也存在不同,说明其存在部分相同的物源,同时也存在来自不同方向的物源。前人在柴北缘鱼卡河测得的花岗质片麻岩原岩年龄为952±19 Ma(林慈銮等,2006),地球化学特征显示为过铝质特征,具有地壳重熔型同碰撞花岗岩的特征,记录了中—新元古代的陆块汇聚事件。早古生代,柴达木盆地北缘存在陆—陆碰撞的深俯冲以及俯冲后的折返过程(张建新等,2000);在早二叠世,受古亚洲洋汇聚碰撞的影响塔里木板块东南缘也处于岛弧向后造山环境方向的演化(刘东晓等,2016),其地球化学特征与ST1井更为一致。三湖坳陷南侧的东昆仑造山带以长英质沉积岩和火成岩为主,大地构造背景为活动大陆边缘和大陆岛弧的背景,地球化学特征与ST2井一致,说明来自东昆仑的物源为ST2井的主要物源。因此,推断三湖坳陷涩北地区第四系沉积物均接受来自坳陷南侧的东昆仑造山带和坳陷北侧的南祁连造山带的物源供给,其中ST1井以来自北侧的南祁连造山带为主要物源,ST2井以来自南侧的东昆仑造山带为主要物源。
-
(1) 涩北地区第四系沉积物源主要来自上地壳长英质沉积岩和火成岩源区,源区构造背景为活动大陆边缘。
(2) 涩北地区第四系沉积物均接受了来自坳陷南侧的东昆仑造山带和坳陷北侧的南祁连造山带的物源供给,其中ST1井以来自北侧的南祁连造山带为主要物源,ST2井以来自南侧的东昆仑造山带为主要物源。
样品 ST1 ST1平均值 ST2 ST2平均值 ST1+ST2平均值 UCC平均值 Rb 44.11~244.92 151.10 31.91~162.13 103.35 121.49 82 Sr 108.24~921.34 420.98 141.50~1525.67 410.40 414.42 320 U 2.42~9.27 5.17 0.66~6.06 1.81 3.09 2.70 Ba 465.70~2586.86 1267.03 594.52~7292.71 1511.63 1418.68 628 V 38.27~118.19 87.93 23.95~119.35 93.17 91.18 97 Cr 29.29~91.98 66.90 18.64~77.70 62.40 64.11 92 Ni 20.48~53.36 34.70 12.31~68.86 36.02 35.52 47 Ta 0.47~1.03 0.85 0.28~1.08 0.89 0.88 0.9 Nb 5.36~11.83 9.75 2.63~15.74 9.54 9.62 27 Yb 1.48~3.28 2.66 0.86~3.30 2.70 2.68 2 Hf 2.17~5.06 3.96 1.33~4.48 3.53 3.69 5.3 Zr 76.69~179.76 142.13 51.00~192.90 129.63 134.38 193 Y 15.29~32.32 25.51 8.13~29.04 22.33 23.54 21 Sc 5.80~16.86 12.19 6.69~27.91 15.99 14.55 14 Th 8.69~19.63 14.80 1.53~17.22 7.31 10.16 10.5 Co 13.93~26.86 19.92 15.12~64.72 27.50 24.62 17.3 Cu 15.94~60.01 41.04 9.38~603.10 87.52 69.86 28 Zn 41.33~106.93 84.98 6.54~138.74 50.11 63.36 67 La 19.63~49.22 37.00 14.02~46.45 36.80 36.88 31 Ce 39.25~88.54 68.45 24.01~86.26 66.41 67.19 63 Pr 4.96~11.47 8.52 2.76~9.55 7.60 7.95 7.1 Nd 18.84~42.42 31.76 8.54~34.09 25.36 27.79 27 Sm 3.43~7.92 5.99 1.90~7.13 5.60 5.75 4.7 Eu 0.58~1.39 1.05 0.42~1.56 1.21 1.15 1 Gd 3.14~7.00 5.31 1.46~10.82 4.46 4.78 4 Tb 0.51~1.12 0.86 0.28~1.05 0.82 0.84 0.7 Dy 2.88~6.26 4.89 0.39~6.26 1.49 2.78 3.9 Ho 0.57~1.23 0.96 0.32~3.96 1.08 1.04 0.83 Er 1.58~3.41 2.73 0.76~7.37 2.53 2.60 2.3 Tm 0.24~0.52 0.42 0.12~0.46 0.37 0.39 0.3 Yb 1.48~3.28 2.66 0.86~3.30 2.70 2.68 2 Lu 0.22~0.49 0.40 0.13~3.30 2.70 0.40 0.31 Rb/Sr 0.18~1.37 0.47 0.02~0.63 0.37 0.41 0.26 Ba/Rb 2.75~58.64 10.69 6.28~77.58 15.94 13.95 7.66 Ba/Sr 0.77~17.48 4.46 0.76~25.79 5.01 4.80 1.96 Th/U 0.94~5.53 3.31 0.79~11.15 5.10 4.42 3.89 Zr/Th 7.44~15.74 9.69 8.18~33.26 20.01 16.09 18.38 Zr/Y 3.89~8.90 5.62 4.95~9.17 5.84 5.76 9.19 Nb/Y 0.29~0.58 0.39 0.39~0.61 0.42 0.41 1.29 La/Yb 8.67~16.51 14.01 11.21~17.90 13.82 13.89 15.50 ∑REE 100.43~223.97 171.03 55.96~198.62 156.82 162.22 148.14 LREE 87.73~200.66 152.78 51.65~182.15 142.99 146.71 133.8 HREE 10.62~23.32 18.25 4.31~33.08 13.83 15.51 14.34 LREE/HREE 6.62~9.33 8.36 4.92~12.96 10.72 9.82 9.33 δCe 0.80~0.99 0.84 0.77~0.93 0.86 0.85 0.92 δEu 0.76~0.89 0.82 0.67~1.23 1.07 0.97 1.01 Ceanom -0.09~0.01 -0.07 -0.09~-0.02 -0.05 -0.06 -0.03 (La/Yb)N 0.84~1.60 1.36 1.09~1.73 1.34 1.35 1.50
Geochemical Characteristics and Source Area Analysis of Quaternary Mudstones in the Sanhu Depression of the Qaidam Basin
-
摘要: 目的 明确柴达木盆地三湖坳陷第四系泥岩的物源属性和构造背景,可为三湖地区第四系生物气勘探开发提供地质依据。 方法 对涩北地区涩探1井(ST1井)、涩探2井(ST2井)第四系不同深度的岩心样品进行主、微量元素及稀土元素分析。 结果 (1)涩北地区第四系泥岩具有低硅(SiO2=48.17%)、高铝(Al2O3=15.23%,铝指数A/NK=2.54,铝饱和指数A/CNK=1.59)、富镁钙(MgO=3.81%,CaO=7.91%)、较富铁(Fe2O3=4.99)、全碱含量较低(K2O+Na2O=5.94%)、Ba和Cu相较于上大陆地壳(UCC)明显富集、Nb亏损、其余微量元素和稀土元素含量与上地壳相当的特征;(2)涩北地区样品受沉积分选和再循环、化学风化和成岩作用影响小,其元素特征可以有效地指示物源和构造背景。主微量元素和稀土元素比值均指示三湖坳陷第四系泥岩沉积物源主要来自上地壳长英质沉积岩和火成岩源区,物源区构造背景为活动大陆边缘环境;(3)三湖坳陷第四系沉积物的潜在物源区为坳陷南侧的东昆仑造山带、坳陷北侧的南祁连造山带,其中ST1井以来自北侧的南祁连造山带为主要物源,ST2井以来自南侧的东昆仑造山带为主要物源。 结论 三湖坳陷第四系泥岩物质来源具有南北双向供给特征,其地球化学参数为活动大陆边缘背景下沉积岩—火成岩混合源区的可靠指示。Abstract: Objective Clarifying the provenance and structural background of the Quaternary mudstone in the Sanhu Depression of the Qaidam Basin can provide geological basis for the exploration and development of Quaternary biogas in the Sanhu area. Methods This study conducted analysis of the major, trace, and rare earth elements on core samples from different depths of the Quaternary strata in the well Setan 1 and well Setan2 (well ST1 and well ST2) of the Sebei area. Results (1) The Quaternary mudstones in the Sebei area have low silicon (SiO2=48.17%), high aluminum (Al2O3=15.23%, aluminum index A/NK=2.54, aluminum saturation index A/NK = 1.59), rich magnesium and calcium (MgO=3.81%, CaO=7.91%), relatively rich iron (Fe2O3=4.99), and low total alkali content (K2O + Na2O=5.94%). The Ba and Cu contents are significantly enriched compared to Upper Continental Crust (UCC). Nb is deficient, and the content of other trace and rare earth elements is equivalent to that of the upper crust. (2) The samples in the research area are less affected by sedimentary sorting and recycling, chemical weathering, and diagenesis, and their elemental characteristics can indicate the source and tectonic background. The ratios of major, trace, and rare earth elements of Quaternary mudstones in the Sanhu Depression indicate that the sedimentary sources are primarily derived from the upper crustal felsic sedimentary and igneous rocks, with the tectonic background of the source areas being an active continental margin environment. (3) The potential source areas of Quaternary sediments in the Sanhu Depression are the East Kunlun and South Qilian Orogenic Belts. Among them, well ST1 is mainly sourced from the South Qilian Orogenic Belt on the north side, and well ST2 is mainly sourced from the East Kunlun Orogenic Belt on the south side. Conclusions The source of Quaternary mudstones in the Sanhu Depression has a bidirectional supply characteristic from north to south, and its geochemical parameters are reliable indicators of the mixed source area of sedimentary rocks, which came from igneous rocks under the background of active continental margins.
-
Key words:
- elemental geochemistry /
- source area /
- mudstones /
- Sanhu Depression /
- Qaidam Basin
-
图 1 (a,b)柴达木盆地三湖坳陷构造简图(据朱筱敏等,2002;杨辉等,2012;孙平等,2013修改)及(c)第四系地层柱状图(据王波等,2025修改)
Figure 1. (a, b) Tectonic map (modified from Zhu et al., 2002; Yang et al., 2012; Sun et al., 2013) and (c) stratigraphic histogram (modified from Wang et al., 2025) of the Quaternary Formation in the Sanhu Depression, Qaidam Basin
图 2 (a)研究区第四系等厚图(Yin et al.,2021)及(b,c)采样井岩性柱状图
Figure 2. (a) Isopach map of the Quaternary in the study area and (b, c) lithologic column of sampling wells
图 3 研究区第四系典型砂泥岩岩心照片
Figure 3. Typical Quaternary sand and mudstone cores from the study area
图 4 样品主、微量元素/UCC均一化蛛网图
Figure 4. Main and trace elements /UCC homogenization spider diagram of the sample
图 5 稀土元素北美页岩标准化配分模式图
Figure 5. Standardized distribution pattern of rare earth elements in North American shale
图 6 样品Th/Sc⁃Zr/Sc判别图(McLennan,1993)、A⁃CN⁃K三角图(Fedo et al.,1995)、ICV⁃CIA(Deng et al.,2019)、WIP⁃CIA(Garzanti et al.,2013)交会图
Figure 6. Sample Th/Sc⁃Zr/Sc discrimination diagram, A⁃CN⁃K triangulation, ICV⁃CIA, and WIP⁃CIA rendezvous diagrams
图 7 样品的δCe⁃δEu、δCe⁃ΣREE、δCe⁃(La/Sm)N相关性图解
Figure 7. Correlation diagrams of δCe⁃δEu, δCe⁃ΣREE, and δCe⁃(La/Sm)N of the samples
表 1 ST1井、ST2井样品主量元素含量(%)及相关参数
Table 1. Main element contents in samples from well ST1 and well ST2
样品 ST1 ST1平均值 ST2 ST2平均值 ST1+ST2平均值 UCC平均值 SiO2 21.08~52.54 46.00 38.76~54.62 49.65 48.17 66.60 Al2O3 7.56~18.10 14.73 8.41~18.34 15.57 15.23 15.40 Fe2O3 3.24~9.21 4.99 3.74~10.93 5.89 5.52 5.04 CaO 4.01~19.12 9.62 1.23~15.85 6.75 7.91 3.59 MgO 3.05~13.83 4.41 2.52~4.60 3.41 3.81 2.48 K2O 1.42~4.06 3.09 1.65~4.21 3.48 3.32 2.80 Na2O 1.65~3.10 2.66 1.79~4.75 3.41 2.61 3.27 MnO 0.07~0.21 0.10 0.04~0.25 0.12 0.11 0.10 TiO2 0.27~0.63 0.50 0.32~0.73 0.58 0.55 0.64 P2O5 0.09~0.15 0.12 0.09~0.22 0.12 0.12 0.15 Al2O3/TiO2 22.33~37.74 29.61 16.41~33.93 26.89 27.99 24.06 SiO2/Al2O3 2.73~3.97 3.15 2.63~4.65 3.25 3.21 4.32 Na2O/K2O 0.59~1.45 0.92 0.52~1.14 0.75 0.82 1.17 Fe2O3/K2O 1.24~3.14 1.66 1.26~2.85 1.73 1.70 1.80 A/CNK 0.34~1.64 1.03 0.49~1.93 1.27 1.18 1.59 A/NK 2.23~2.84 2.54 2.06~2.82 2.59 2.57 2.54 CIA 47.49~57.66 52.75 46.19~58.06 54.32 53.69 CIW 54.39~69.98 62.26 53.99~71.47 62.23 64.03 WIP 65.83~86.46 76.35 50.24~96.37 75.45 75.82 ICV 1.42~6.10 2.08 1.46~2.69 1.73 1.87 注: UCC为上大陆地壳,数据引自Taylor and McLennan(1985);铝饱和指数A/CNK=Al2O3/(CaO+Na2O+K2O);铝指数A/NK=Al2O3/(Na2O+K2O);化学蚀变指数CIA=n(Al2O3)/[n(Al2O3)+n(CaO*)+n(Na2O)+n(K2O)]×100,CaO*指的是仅存于硅酸盐中CaO的数量,不包括碳酸盐和磷酸盐矿物,计算方法:CaO剩余=CaO-P2O5×10/3,若CaO剩余<Na2O,令CaO*=CaO剩余,若CaO剩余>Na2O,令CaO*=Na2O,n指摩尔量;CIW=100×[Al2O3/(Al2O3+CaO*+Na2O)];ICV=[n(Fe2O3)+n(K2O)+n(Na2O)+n(CaO*)+n(MgO)+n(MnO)+n(TiO2)]/n(Al2O3);WIP=[(2Na2O/0.35+MgO/0.9+2K2O/0.25+CaO*/0.7)]×100。 下载: 导出CSV
表 3 样品与不同源岩相关参数对比表
Table 3. Correlation parameters between samples and different source rocks
判别参数 长英质源区 铁镁质源区 ST1 ST2 ST1+ST2 Al2O3/TiO2 19-28 <14 29.61 26.89 27.99 TiO2/Zr <55 >200 35.86 45.31 41.49 Cr/Zr <1 >1 0.47 0.49 0.48 La/Sc 2.50-16.00 0.40-1.10 3.11 2.55 2.76 Th/Sc 0.83-20.00 0.04-0.05 1.23 0.50 0.78 Cr/Th 0.50-7.70 22.00-100.00 4.56 9.58 7.67 Co/Th 0.22-1.50 7.10-8.30 1.40 4.819 3.52 注: Al2O3/TiO2数据来自张云望等(2023),TiO2/Zr数据来自Hayashi et al.(1997) ,Cr/Zr数据来自屈李华等(2018),La/Sc、Th/Sc、Cr/Th、Co/Th数据来自Cullers(1994)。
下载: 导出CSV
表 4 样品与不同构造背景相关参数对比表(Bhatia and Crook,1986;Bhatia,1985)
Table 4. Comparison of relevant parameters between samples and different structural backgrounds (Bhatia and Crook,1986;Bhatia,1985)
构造背景 大洋岛弧 大陆岛弧 活动大陆边缘 被动大陆边缘 ST1 ST2 ST1+ST2 ∑REE 58±10 146±20 186 210 171.03 156.82 162.22 LREE/HREE 3.8±0.9 7.7±1.7 9.10 8.50 8.36 10.72 9.82 La/Yb 4.2±1.5 11.0±3.6 12.5 15.9 14.01 13.82 13.89 (La/Yb)N 2.8±0.9 7.5±2.5 8.30 10.80 1.36 1.34 1.35 δEu 1.04±0.11 0.79±0.13 0.60 0.56 0.82 1.07 0.97 Th 2.27±0.7 11.11±1.1 18.8±3 16.7±3.5 14.80 7.31 10.16 U 1.09±0.21 2.53±0.24 3.9±0.5 3.2±0.8 5.17 1.81 3.09 Zr 96±20 229±27 179±33 298±80 142.13 129.63 134.38 Nb 2.0±0.4 8.5±0.8 10.7±1.4 7.9±1.9 9.75 9.54 9.62 Y 19.5±5.6 24.2±2.2 24.9±3.6 27.3±5.3 25.51 22.33 23.54 Nd 11.36±2.9 20.8±1.6 25.4±3.4 29.0±5.03 31.76 25.36 27.79 V 131±40 89±13.7 48±5.9 31±9.9 87.93 93.17 91.18 Cr 37±13 51±6.5 26±4.9 39±8.5 66.90 62.40 64.11 Ni 11±5.1 13±2.0 10±2.5 8±4.4 34.70 36.02 35.52 Rb/Sr 0.05±0.05 0.65±0.33 0.89±0.24 1.19±0.40 0.47 0.37 0.41 Ba/Rb 21.3±5.0 7.5±1.3 4.5±0.8 4.7±1.1 10.69 15.94 13.95 Ba/Sr 0.95±0.60 3.55±1.40 3.8±0.7 4.7±1.3 4.46 5.01 4.80 Th/U 2.1±0.78 4.6±0.45 4.8±0.38 5.6±0.7 3.31 5.10 4.42 Zr/Th 48±13.4 21.5±2.4 9.5±0.7 19.1±5.8 9.69 20.01 16.09 Zr/Y 5.67±1.94 9.6±0.8 7.2±0.4 12.4±4.0 5.62 5.84 5.76 Nb/Y 0.11±0.03 0.36±0.04 0.43±0.04 0.30±0.06 0.39 0.43 0.41
下载: 导出CSV
样品 ST1 ST1平均值 ST2 ST2平均值 ST1+ST2平均值 UCC平均值 Rb 44.11~244.92 151.10 31.91~162.13 103.35 121.49 82 Sr 108.24~921.34 420.98 141.50~1525.67 410.40 414.42 320 U 2.42~9.27 5.17 0.66~6.06 1.81 3.09 2.70 Ba 465.70~2586.86 1267.03 594.52~7292.71 1511.63 1418.68 628 V 38.27~118.19 87.93 23.95~119.35 93.17 91.18 97 Cr 29.29~91.98 66.90 18.64~77.70 62.40 64.11 92 Ni 20.48~53.36 34.70 12.31~68.86 36.02 35.52 47 Ta 0.47~1.03 0.85 0.28~1.08 0.89 0.88 0.9 Nb 5.36~11.83 9.75 2.63~15.74 9.54 9.62 27 Yb 1.48~3.28 2.66 0.86~3.30 2.70 2.68 2 Hf 2.17~5.06 3.96 1.33~4.48 3.53 3.69 5.3 Zr 76.69~179.76 142.13 51.00~192.90 129.63 134.38 193 Y 15.29~32.32 25.51 8.13~29.04 22.33 23.54 21 Sc 5.80~16.86 12.19 6.69~27.91 15.99 14.55 14 Th 8.69~19.63 14.80 1.53~17.22 7.31 10.16 10.5 Co 13.93~26.86 19.92 15.12~64.72 27.50 24.62 17.3 Cu 15.94~60.01 41.04 9.38~603.10 87.52 69.86 28 Zn 41.33~106.93 84.98 6.54~138.74 50.11 63.36 67 La 19.63~49.22 37.00 14.02~46.45 36.80 36.88 31 Ce 39.25~88.54 68.45 24.01~86.26 66.41 67.19 63 Pr 4.96~11.47 8.52 2.76~9.55 7.60 7.95 7.1 Nd 18.84~42.42 31.76 8.54~34.09 25.36 27.79 27 Sm 3.43~7.92 5.99 1.90~7.13 5.60 5.75 4.7 Eu 0.58~1.39 1.05 0.42~1.56 1.21 1.15 1 Gd 3.14~7.00 5.31 1.46~10.82 4.46 4.78 4 Tb 0.51~1.12 0.86 0.28~1.05 0.82 0.84 0.7 Dy 2.88~6.26 4.89 0.39~6.26 1.49 2.78 3.9 Ho 0.57~1.23 0.96 0.32~3.96 1.08 1.04 0.83 Er 1.58~3.41 2.73 0.76~7.37 2.53 2.60 2.3 Tm 0.24~0.52 0.42 0.12~0.46 0.37 0.39 0.3 Yb 1.48~3.28 2.66 0.86~3.30 2.70 2.68 2 Lu 0.22~0.49 0.40 0.13~3.30 2.70 0.40 0.31 Rb/Sr 0.18~1.37 0.47 0.02~0.63 0.37 0.41 0.26 Ba/Rb 2.75~58.64 10.69 6.28~77.58 15.94 13.95 7.66 Ba/Sr 0.77~17.48 4.46 0.76~25.79 5.01 4.80 1.96 Th/U 0.94~5.53 3.31 0.79~11.15 5.10 4.42 3.89 Zr/Th 7.44~15.74 9.69 8.18~33.26 20.01 16.09 18.38 Zr/Y 3.89~8.90 5.62 4.95~9.17 5.84 5.76 9.19 Nb/Y 0.29~0.58 0.39 0.39~0.61 0.42 0.41 1.29 La/Yb 8.67~16.51 14.01 11.21~17.90 13.82 13.89 15.50 ∑REE 100.43~223.97 171.03 55.96~198.62 156.82 162.22 148.14 LREE 87.73~200.66 152.78 51.65~182.15 142.99 146.71 133.8 HREE 10.62~23.32 18.25 4.31~33.08 13.83 15.51 14.34 LREE/HREE 6.62~9.33 8.36 4.92~12.96 10.72 9.82 9.33 δCe 0.80~0.99 0.84 0.77~0.93 0.86 0.85 0.92 δEu 0.76~0.89 0.82 0.67~1.23 1.07 0.97 1.01 Ceanom -0.09~0.01 -0.07 -0.09~-0.02 -0.05 -0.06 -0.03 (La/Yb)N 0.84~1.60 1.36 1.09~1.73 1.34 1.35 1.50
下载: 导出CSV
-
[1] 蔡火灿,王伟涛,段磊,等. 2022. 青藏高原东北缘柴达木盆地路乐河地区新生代构造变形的古地磁证据[J]. 地质学报,96(10):3345-3359. Cai Huocan, Wang Weitao, Duan Lei, et al. 2022. Paleomagnetic evidence of Cenozoic tectonic deformation in Lulehe area, Qaidam Basin, northeastern margin of Tibet Plateau[J]. Acta Geologica Sinica, 96(10): 3345-3359. [2] 段磊,张博譞,王伟涛,等. 2022. 柴达木盆地路乐河剖面磁性地层年代及其构造变形[J]. 科学通报,67(9):872-887. Duan Lei, Zhang Boxuan, Wang Weitao, et al. 2022. Magnetostratigraphy of the Cenozoic Lulehe section in the Qaidam Basin: Implications for the tectonic deformation on the northeastern Tibetan Plateau[J]. Chinese Science Bulletin, 67(9): 872-887. [3] 方国庆. 1993. K2O/(Na2O+CaO)-SiO2/Al2O3:一个用于推断复理石形成时板块构造背景的判别图[J]. 西北地质科学,14(1):121-125. Fang Guoqing. 1993. K2O/(Na2O+CaO)-SiO2/Al2O3: A diagram for determining the plate tectonic setting of flysh[J]. Northwest Geoscience, 14(1): 121-125. [4] 冯德浩,刘成林,田继先,等. 2021. 柴达木盆地一里坪地区新近系盆地模拟及有利区预测[J]. 岩性油气藏,33(3):74-84. Feng Dehao, Liu Chenglin, Tian Jixian, et al. 2021. Basin modeling and favorable play prediction of Neogene in Yiliping area, Qaidam Basin[J]. Lithologic Reservoirs, 33(3): 74-84. [5] 冯怀伟,许淑梅,王大华,等. 2022. 柴达木盆地东段中、新生代沉积迁移规律及原型盆地性质研究[J]. 沉积学报,40(3):667-678. Feng Huaiwei, Xu Shumei, Wang Dahua, et al. 2022. Study of the process of sedimentary migration, and Mesozoic and Cenozoic prototype basins, eastern segment of Qaidam Basin[J]. Acta Sedimentologica Sinica, 40(3): 667-678. [6] 付玲,关平,简星,等. 2012. 柴达木盆地路乐河组粗碎屑沉积成 因与青藏高原隆升时限[J]. 天然气地球科学,23(5):833-840. Fu Ling, Guan Ping, Jian Xing, et al. 2012. Sedimentary genetic types of coarse fragment of Paleogene Lulehe Formation in Qaidam Basin and time limit of the Tibetan Plateau uplift[J]. Natural Gas Geoscience, 23(5): 833-840. [7] 关平,简星. 2013. 青藏高原北部新生代构造演化在柴达木盆地中的沉积记录[J]. 沉积学报,31(5):824-833. Guan Ping, Jian Xing. 2013. The Cenozoic sedimentary record in Qaidam Basin and its implications for tectonic evolution of the northern Tibetan Plateau[J]. Acta Sedimentologica Sinica, 31(5): 824-833. [8] 郭泽清,刘卫红,冯刚. 2011. 柴达木盆地三湖地区岩性气藏分布规律和有利区块预测[J]. 天然气地球科学,22(4):635-641. Guo Zeqing, Liu Weihong, Feng Gang. 2011. Distribution regularities and favorable exploration areas of lithologic gas reservoir in Sanhu area, Qaidam Basin[J]. Natural Gas Geoscience, 22(4): 635-641. [9] 郭泽清,孙平,张林,等. 2010. 柴达木盆地东部三湖地区第四纪沉积物源分析[J]. 第四纪研究,30(5):1044-1054. Guo Zeqing, Sun Ping, Zhang Lin, et al. 2010. Source analysis of Quaternary sediments in the Sanhu area, eastern Qaidam Basin[J]. Quaternary Sciences, 30(5): 1044-1054. [10] 惠博,伊海生,夏国清,等. 2011. 柴达木盆地西部新生代沉积演化特征[J]. 中国地质,38(5):1274-1281. Hui Bo, Yi Haisheng, Xia Guoqing, et al. 2011. Characteristics of Cenozoic sedimentary evolution in western Qaidam Basin[J]. Geology in China, 38(5): 1274-1281. [11] 蒋赟,潘世乐,秦彩虹,等. 2020. 柴达木盆地北缘平台地区下干柴沟组下段稀土元素特征及物源分析[J]. 天然气地球科学,31(11):1537-1547. Jiang Yun, Pan Shile, Qin Caihong, et al. 2020. Characteristics and provenance analysis of rare earth elements in the lower section of Xiaganchaigou Formation in the platform area of the northern margin of Qaidam Basin[J]. Natural Gas Geoscience, 31(11): 1537-1547. [12] 蒋赟,王远飞,马富强,等. 2022. 柴北缘平台地区下干柴沟组下段沉积—成岩环境分析[J]. 新疆地质,40(3):382-387. Jiang Yun, Wang Yuanfei, Ma Fuqiang, et al. 2022. Sedimentary-diagenetic environment analysis of lower member of Xiaganchaigou Formation in platform area of northern margin of Qaidam Basin[J]. Xin-jiang Geology, 40(3): 382-387. [13] 李凤杰,李俊武,王海峰,等. 2014. 柴达木盆地北缘新近系重矿物特征及物源分析[J]. 科学技术与工程,14(17):182-187. Li Fengjie, Li Junwu, Wang Haifeng, et al. 2014. The heavy minerals characteristics and provenance analysis of the Neogene in north margin of Qaidam Basin[J]. Science Technology and Engineering, 14(17): 182-187. [14] 李高杰,伊海生,夏国清,等. 2017. 柴达木路乐河地区新生代碎屑组分变化及其对构造隆升的指示[J]. 地质通报,36(6):1022-1031. Li Gaojie, Yi Haisheng, Xia Guoqing, et al. 2017. Compositional variation of Cenozoic detritus in the Lulehe area, Qaidam Basin, and its implications for Tibetan Plateau tectonic uplift[J]. Geological Bulletin of China, 36(6): 1022-1031. [15] 李俊,赵红格,汪建,等. 2024. 鄂尔多斯盆地西缘中部三叠系延长组碎屑岩沉积环境及物源示踪[J]. 沉积学报,42(5):1621-1638. Li Jun, Zhao Hongge, Wang Jian, et al. 2024. Sedimentary environment and provenance tracing of clastic rocks from the Triassic Yanchang Formation in the western margin of the Ordos Basin[J]. Acta Sedimentologica Sinica, 42(5): 1621-1638. [16] 李乐,姚光庆,刘永河,等. 2015. 塘沽地区沙河街组下部含云质泥岩主微量元素地球化学特征及地质意义[J]. 地球科学,40(9):1480-1496. Li Le, Yao Guangqing, Liu Yonghe, et al. 2015. Major and trace elements geochemistry and geological implications of dolomite-bearing mudstones in lower part of Shahejie Formation in Tanggu area, eastern China[J]. Earth Science, 40(9): 1480-1496. [17] 李林林,郭召杰,管树巍,等. 2015. 柴达木盆地西南缘新生代碎屑重矿物组合特征及其古地理演化[J]. 中国科学:地球科学,45(6):780-798. Li Linlin, Guo Zhaojie, Guan Shuwei, et al. 2015. Heavy mineral assemblage characteristics and the Cenozoic paleogeographic evolution in southwestern Qaidam Basin[J]. Science China Earth Sciences, 45(6): 780-798. [18] 栗兵帅,颜茂都,张伟林. 2022. 柴北缘早新生代旋转变形特征及其构造意义[J]. 地学前缘,29(4):249-264. Li Bingshuai, Yan Maodu, Zhang Weilin. 2022. Early Cenozoic rotation feature in the northern Qaidam marginal thrust belt and its tectonic implications[J]. Earth Science Frontiers, 29(4): 249-264. [19] 林慈銮,孙勇,陈丹玲,等. 2006. 柴北缘鱼卡河花岗质片麻岩的地球化学特征和锆石LA-ICPMS定年[J]. 地球化学,35(5):489-505. Lin Ciluan, Sun Yong, Chen Danling, et al. 2006. Geochemistry and zircon LA-ICPMS dating of Iqe River granitic gneiss, northern margin of Qaidam Basin[J]. Geochimica, 35(5): 489-505. [20] 刘兵,孙载波,陈棵,等. 2022. 滇西遮放盆地西缘芒棒组稀土元素富集特征及其地质意义[J]. 大地构造与成矿学,46(6):1075-1089. Liu Bing, Sun Zaibo, Chen Ke, et al. 2022. REY enrichment in profiles of the Mangbang Formation sedimentary rocks of Zhefang Basin, western Yunnan province, and its geological significance[J]. Geotectonica et Metallogenia, 46(6): 1075-1089. [21] 刘春来,熊国庆,董国明,等. 2021. 扬子北缘奥陶纪—志留纪之交泥岩地球化学特征及其源区、构造背景[J]. 地质论评,67(5):1263-1279. Liu Chunlai, Xiong Guoqing, Dong Guoming, et al. 2021. Geochemical characteristics of mudstones and its provenance and tectonic setting during the Ordovician-Silurian Period in northern margin of Yangtze Block[J]. Geological Review, 67(5): 1263-1279. [22] 刘东晓,王玉玺,王金荣,等. 2016. 塔里木板块东南缘早二叠世角闪石岩的发现及大地构造意义[J]. 兰州大学学报(自然科学版),52(2):167-178. Liu Dongxiao, Wang Yuxi, Wang Jinrong, et al. 2016. Discovery and tectonic significance of Early Permian hornblendite in the southeastern margin of the Tarim Plate[J]. Journal of Lanzhou University (Natural Sciences), 52(2): 167-178. [23] 刘康,王伟涛,赵旭东,等. 2020. 青藏高原东北缘柴达木盆地红沟剖面物源分析及其构造意义[J]. 地质学报,94(3):716-740. Liu Kang, Wang Weitao, Zhao Xudong, et al. 2020. Provenance identification for the Honggou section of the Qaidam Basin in the northeastern margin of the Tibetan Plateau and its tectonic significance[J]. Acta Geologica Sinica, 94(3): 716-740. [24] 楼谦谦,肖安成,钟南翀,等. 2016. 大型陆相坳陷型沉积盆地原型恢复方法:以新生代柴达木盆地为例[J]. 岩石学报,32(3):892-902. Lou Qianqian, Xiao Ancheng, Zhong Nanchong, et al. 2016. A method of prototype restoration of large depressions with terrestrial sediments: A case study from the Cenozoic Qaidam Basin[J]. Acta Petrologica Sinica, 32(3): 892-902. [25] 路晶芳,张克信,宋博文,等. 2020. 柴达木盆地大红沟地区始新世—上新世孢粉记录及气候变化[J]. 现代地质,34(4):732-744. Lu Jingfang, Zhang Kexin, Song Bowen, et al. 2020. Paleogene-Neogene pollen and climate change in Dahonggou region of Qaidam Basin[J]. Geoscience, 34(4): 732-744. [26] 马万里,江小青,李璇,等. 2021. 柴达木盆地西北缘上干柴沟组泥岩地球化学特征与古环境古气候意义[J]. 矿物岩石地球化学通报,40(5):1166-1180. Ma Wanli, Jiang Xiaoqing, Li Xuan, et al. 2021. Geochemical characteristics and paleoenvironment paleo-climate significance of mudstone in the Shang-Gan-Chai-Gou Formation at the northwestern margin of Qaidam Basin[J]. Bulletin of Mineralogy, Petrology and Geochemistry, 40(5): 1166-1180. [27] 彭治超,李亚男,张孙玄琦,等. 2018. 主微量元素地球化学特征在沉积环境中的应用[J]. 西安文理学院学报(自然科学版),21(3):108-111. Peng Zhichao, Li Ya’nan, Zhangsun Xuanqi, et al. 2018. Application of the geochemical characteristics of the major and trace elements in the sedimentary environment[J]. Journal of Xi'an University (Natural Science Edition), 21(3): 108-111. [28] 屈李华,刘喜方,赵芳,等. 2018. 北羌塘盆地三叠系康南组砂岩地球化学特征及其对物源区和构造背景的制约[J]. 西北地质,51(4):97-113. Qu Lihua, Liu Xifang, Zhao Fang, et al. 2018. Geochemical characteristics of the sandstones from Triassic Kangnan Formation in North Qiangtang Basin (Tibet): Implications for provenance and tectonic setting[J]. Northwestern Geology, 51(4): 97-113. [29] 芮华松,关平. 2012. 三湖坳陷北斜坡新近系狮子沟组层序地层特征及有利勘探目标预测[J]. 天然气地球科学,23(5):897-902. Rui Huasong, Guan Ping. 2012. The sequence stratigraphy of Neogene Shizigou Formation of north slope in Sanhu Depression and the prediction of potential targets[J]. Natural Gas Geoscience, 23(5): 897-902. [30] 桑胜萍,卢海建,叶家灿,等. 2024. 柴达木盆地北缘新生代沉积物再旋回作用研究:以大红沟剖面为例[J]. 中国地质,51(2):606-622. Sang Shengping, Lu Haijian, Ye Jiacan, et al. 2024. Sediment recycling in the northern Qaidam Basin margin during the Cenozoic: A case study from the Dahonggou section[J]. Geology in China, 51(2): 606-622. [31] 单俊峰,鞠俊成,张文伟,等. 2019. 柴达木盆地三湖坳陷盐壳遮挡型生物气成藏模式[J]. 天然气工业,39(8):25-32. Shan Junfeng, Ju Juncheng, Zhang Wenwei, et al. 2019. Hydrocarbon accumulation patterns of salt crust covered biogenic gas reservoirs in the Sanhu Depression, Qaidam Basin[J]. Natural Gas Industry, 39(8): 25-32. [32] 司马立强,马骏,刘俊丰,等. 2023. 柴达木盆地涩北地区第四系泥岩型生物气储层孔隙有效性评价[J]. 岩性油气藏,35(2):1-10. Sima Liqiang, Ma Jun, Liu Junfeng, et al. 2023. Evaluation of pore effectiveness of Quaternary mudstone biogas reservoirs in Sebei area, Qaidam Basin[J]. Lithologic Reservoirs, 35(2): 1-10. [33] 孙国强,陈波,郑永仙,等. 2015. 柴北缘冷湖五号构造中新统成岩作用及沉积环境[J]. 天然气地球科学,26(4):679-688. Sun Guo-qiang, Chen Bo, Zheng Yongxian, et al. 2015. Diagenesis and sedimentary environment of Miocene in Lenghu Ⅴ tectonic belt[J]. Natural Gas Geoscience, 26(4): 679-688. [34] 孙国强,郑建京,苏龙,等. 2010. 柴达木盆地西北区中—新生代构造演化过程研究[J]. 天然气地球科学,21(2):212-217. Sun Guo-qiang, Zheng Jianjing, Su Long, et al. 2010. Mesozoic-Cenozoic tectonic evolution in northwestern Qaidam Basin[J]. Natural Gas Geoscience, 21(2): 212-217. [35] 孙平,郭泽清,张林,等. 2013. 柴达木盆地三湖地区生物气成藏机理与勘探对策[J]. 天然气地球科学,24(3):494-504. Sun Ping, Guo Zeqing, Zhang Lin, et al. 2013. Biologic gas accumulation mechanism and exploration strategy in Sanhu area, Qaidam Basin[J]. Natural Gas Geoscience, 24(3): 494-504. [36] 田继先,纪宝强,曾旭,等. 2022. 柴北缘下干柴沟组深部碎屑岩储层发育特征及主控因素[J]. 天然气地球科学,33(5):720-730. Tian Jixian, Ji Baoqiang, Zeng Xu, et al. 2022. Development characteristics and main controlling factors of deep clastic reservoir of Xiaganchaigou Formation in the northern margin of Qaidam Basin[J]. Natural Gas Geoscience, 33(5): 720-730. [37] 田继先,张林,孙平,等. 2009. 柴达木盆地第四系驼峰山构造带七个泉组物源分析[J]. 内蒙古石油化工,35(21):33-37. Tian Jixian, Zhang Lin, Sun Ping, et al. 2009. The analysis of sedimentary source on Qigequan Formation of Tuo Fengshan tectonic zone, Qaidam Basin[J]. Inner Mongolia Petrochemical Industry, 35(21): 33-37. [38] 王波,田继先,周飞,等. 2025. 柴达木盆地三湖坳陷第四系泥岩元素地球化学特征及沉积环境分析[J]. 天然气地球科学,36(4):653-664. Wang Bo, Tian Jixian, Zhou Fei, et al. 2025. Discussion on the elemental geochemical characteristics and sedimentary environment of Quaternary mudstone in the Sanhu Depression of Qaidam Basin, China[J]. Natural Gas Geoscience, 36(4): 653-664. [39] 王万春,刘文汇,王国仓,等. 2016a. 沉积有机质微生物降解与生物气源岩识别:以柴达木盆地三湖坳陷第四系为例[J]. 石油学报,37(3):318-327. Wang Wanchun, Liu Wenhui, Wang Guocang, et al. 2016a. Biodegradation of depositional organic matter and identification of biogenic gas source rocks: An example from the Sanhu Depression of Qaidam Basin[J]. Acta Petrolei Sinica, 37(3): 318-327. [40] 王万春,王成,孙敏卓,等. 2016b. 成岩阶段微生物作用及其油气地质意义[J]. 天然气地球科学,27(11):1970-1978. Wang Wan-chun, Wang Cheng, Sun Minzhuo, et al. 2016b. Effect of micro-organisms during diagenesis and its significance on petroleum formation[J]. Natural Gas Geoscience, 27(11): 1970-1978. [41] 王伟涛,张培震,段磊,等. 2022. 柴达木盆地新生代地层年代框架与沉积—构造演化[J]. 科学通报,67(28/29):3452-3475. Wang Weitao, Zhang Peizhen, Duan Lei, et al. 2022. Cenozoic stratigraphic chronology and sedimentary-tectonic evolution of the Qaidam Basin[J]. Chinese Science Bulletin, 67(28/29): 3452-3475. [42] 魏岩岩,吴磊,周道卿,等. 2021. 柴达木盆地西部阿拉尔断裂新生代构造变形特征及意义[J]. 物探与化探,45(5):1171-1178. Wei Yanyan, Wu Lei, Zhou Daoqing, et al. 2021. Cenozoic tectonic deformation characteristics of Alar fault in southwestern Qaidam Basin and their significance[J]. Geophysical and Geochemical Exploration, 45(5): 1171-1178. [43] 吴颖,杜贵超,马明. 2023. 鄂尔多斯盆地南部旬邑地区延长组砂岩地球化学特征[J]. 天然气地球科学,34(2):194-209. Wu Ying, Du Guichao, Ma Ming. 2023. Geochemical characteristics of the sandstones of the Yanchang Formation in the Xunyi area, southern Ordos Basin[J]. Natural Gas Geoscience, 34(2): 194-209. [44] 杨辉,张友焱,马达德,等. 2012. 柴达木盆地第四系生物气分布综合地球物理研究[J]. 石油勘探与开发,39(1):27-36. Yang Hui, Zhang Youyan, Ma Dade, et al. 2012. Integrated geophysical studies on the distribution of Quaternary biogenic gases in Qaidam Basin, NW China[J]. Petroleum Exploration and Development, 39(1): 27-36. [45] 杨仁超,李进步,樊爱萍,等. 2013. 陆源沉积岩物源分析研究进展与发展趋势[J]. 沉积学报,31(1):99-107. Yang Renchao, Li Jinbu, Fan Aiping, et al. 2013. Research progress and development tendency of provenance analysis on terrigenous sedimentary rocks[J]. Acta Sedimentologica Sinica, 31(1): 99-107. [46] 杨永恒,孙国强,王晔桐,等. 2019. 柴达木盆地北缘平台地区路乐河组沉积环境与成岩流体特征[J]. 沉积学报,37(6):1258-1268. Yang Yongheng, Sun Guoqiang, Wang Yetong, et al. 2019. Sedimentary diagenetic environment of the Lulehe Formation in the Pingtai region, northern Qaidam Basin[J]. Acta Sedimentologica Sinica, 37(6): 1258-1268. [47] 叶爱娟,朱扬明. 2006. 柴达木盆地第三系咸水湖相生油岩古沉积环境地球化学特征[J]. 海洋与湖沼,37(5):472-480. Ye Aijuan, Zhu Yangming. 2006. Geochemical and sedimentary features of Tertiary saline lacustrine source rocks in Qaidm Basin[J]. Oceanologia et Limnologia Sinica, 37(5): 472-480. [48] 苑广尧,李凤杰. 2023. 柴达木盆地北缘古近系稀土元素地球化学特征及其地质意义[J]. 天然气地球科学,34(8):1374-1384. Yuan Guangyao, Li Fengjie. 2023. Geochemical characteristics and geological significance of Paleogene rare earth elements in the northern margin of Qaidam Basin[J]. Natural Gas Geoscience, 34(8): 1374-1384. [49] 张建新,杨经绥,许志琴,等. 2000. 柴北缘榴辉岩的峰期和退变质年龄:来自U-Pb及Ar-Ar同位素测定的证据[J]. 地球化学,29(3):217-222. Zhang Jianxin, Yang Jingsui, Xu Zhiqin, et al. 2000. Peak and retrograde age of eclogites at the northern margin of Qaidam Basin, northwestern China: Evidences from U-Pb and Ar-Ar dates[J]. Geochimica, 29(3): 217-222. [50] 张景廉,石兰亭,陈启林,等. 2008. 柴达木盆地地壳深部构造特征及油气勘探新领域[J]. 岩性油气藏,20(2):29-36. Zhang Jinglian, Shi Lanting, Chen Qilin, et al. 2008. Deep crust structural features and new targets of petroleum exploration in Qaidam Basin[J]. Lithologic Reservoirs, 20(2): 29-36. [51] 张茜,肖渊甫,王晓飞,等. 2020. 四川盆地西南缘龙马溪组泥岩地球化学特征及物源区和构造背景分析[J]. 地质论评,66(5):1393-1411. Zhang Qian, Xiao Yuanfu, Wang Xiaofei, et al. 2020. Geochemistry of the Longmaxi Formation mudstones of the southwest Sichuan Basin: Implications for provenance and source weathering[J]. Geological Review, 66(5): 1393-1411. [52] 张云望,金鑫,乔培军,等. 2023. 鄂尔多斯盆地东北部下侏罗统富县组沉积物源分析:来自榆林安崖剖面砂岩的岩石学及元素地球化学证据[J]. 沉积学报,41(5):1414-1429. Zhang Yunwang, Jin Xin, Qiao PeiJun, et al. 2023. Petrological and geochemical constraints on sedimentary provenance of the Fuxian Formation (Lower Jurassic) sandstones in the northeastern Ordos Basin[J]. Acta Sedimentologica Sinica, 41(5): 1414-1429. [53] 周铁锁,张文伟,鞠俊成,等. 2020. 柴达木盆地三湖坳陷区域性盐壳发现及生物气勘探地质意义[J]. 东北石油大学学报,44(1):77-84. Zhou Tiesuo, Zhang Wenwei, Ju Juncheng, et al. 2020. Discovery of regional salt crust and geological significance of biogas exploration in Sanhu Depression of Tsaidam Basin[J]. Journal of Northeast Petroleum University, 44(1): 77-84. [54] 朱筱敏,康安,胡宗全,等. 2002. 柴达木盆地第四系层序地层特征与油气评价[J]. 石油勘探与开发,29(1):56-60. Zhu Xiaomin, Kang An, Hu Zongquan, et al. 2002. Quaternary sequence stratigraphy and hydrocarbon evaluation in Qaidam Basin[J]. Petroleum Exploration and Development, 29(1): 56-60. [55] Allègre C J, Minster J F. 1978. Quantitative models of trace element behavior in magmatic processes[J]. Earth and Planetary Science Letters, 38(1): 1-25. [56] Bhatia M R. 1985. Rare earth element geochemistry of Australian Paleozoic graywackes and mudrocks: Provenance and tectonic control[J]. Sedimentary Geology, 45(1/2): 97-113. [57] Bhatia M R, Crook K A W. 1986. Trace element characteristics of graywackes and tectonic setting discrimination of sedimentary basins[J]. Contributions to Mineralogy and Petrology, 92(2): 181-193. [58] Cheng F, Jolivet M, Guo Z J, et al. 2021. Cenozoic evolution of the Qaidam Basin and implications for the growth of the northern Tibetan Plateau: A review[J]. Earth-Science Reviews, 220: 103730. [59] Cullers R L. 1994. The chemical signature of source rocks in size fractions of Holocene stream sediment derived from metamorphic rocks in the Wet Mountains region, Colorado, U.S.A.[J]. Chemical Geology, 113(3/4): 327-343. [60] Deng T, Li Y, Wang Z J, et al. 2019. Geochemical characteristics and organic matter enrichment mechanism of black shale in the Upper Triassic Xujiahe Formation in the Sichuan Basin: Implications for paleoweathering, provenance and tectonic setting[J]. Marine and Petroleum Geology, 109: 698-716. [61] Fedo C M, Nesbitt H W, Young G M. 1995. Unraveling the effects of potassium metasomatism in sedimentary rocks and paleosols, with implications for paleoweathering conditions and provenance[J]. Geology, 23(10): 921-924. [62] Floyd P A, Leveridge B E. 1987. Tectonic environment of the Devonian Gramscatho Basin, South Cornwall: Framework mode and geochemical evidence from turbiditic sandstones[J]. Journal of the Geological Society, 144(4): 531-542. [63] Garzanti E, Andò S, Padoan M, et al. 2015. The modern Nile sediment system: Processes and products[J]. Quaternary Science Reviews, 130: 9-56. [64] Garzanti E, Padoan M, Setti M, et al. 2013. Weathering geochemistry and Sr-Nd fingerprints of equatorial Upper Nile and Congo muds[J]. Geochemistry, Geophysics, Geosystems, 14(2): 292-316. [65] Hayashi K I, Fujisawa H, Holland H D, et al. 1997. Geochemistry of ∼1.9 Ga sedimentary rocks from northeastern Labrador, Canada[J]. Geochimica et Cosmochimica Acta, 61(19): 4115-4137. [66] Liu C F, Qing M, Liu S F, et al. 2021. Genesis of sediment‐hosted stratiform Cu-Co deposits of the Zambia Copperbelt: Geochemistry and S-Pb isotopes constraints from the Chambishi deposit[J]. Geological Journal, 56(7): 3902-3921. [67] McLennan S M. 1993. Weathering and global denudation[J]. The Journal of Geology, 101(2): 295-303. [68] McLennan S M, Taylor S R, Kröner A. 1983. Geochemical evolution of Archean shales from South Africa. I. The Swaziland and Pongola Supergroups[J]. Precambrian Research, 22(1/2): 93-124. [69] Métivier F, Gaudemer Y, Tapponnier P, et al. 1998. Northeastward growth of the Tibet Plateau deduced from balanced reconstruction of two depositional areas: The Qaidam and Hexi Corridor Basins, China[J]. Tectonics, 17(6): 823-842. [70] Pearce J A, Harris N B W, Tindle A G. 1984. Trace element discrimination diagrams for the tectonic interpretation of granitic rocks[J]. Journal of Petrology, 25(4): 956-983. [71] Roser B P, Korsch R J. 1986. Determination of tectonic setting of sandstone-mudstone suites using SiO2 content and K2O/Na2O ratio[J]. The Journal of Geology, 94(5): 635-650. [72] Roser B P, Korsch R J. 1988. Provenance signatures of sandstone-mudstone suites determined using discriminant function analysis of major-element data[J]. Chemical Geology, 67(1/2): 119-139. [73] Taylor S R, McLennan S M. 1985. The continental crust: Its composition and evolution[M]. Oxford: Blackwell Scientific Publications. [74] Yin M S, Huang H P, Cheng L. 2021. Molecular fingerprints in shales from the Sanhu biogenic gas fields in eastern Qaidam Basin, NW China: Evidence of biodegradation of shale organic matter[J]. Marine and Petroleum Geology, 133: 105289. -

 点击查看大图
计量
- 文章访问数: 316
- HTML全文浏览量: 64
- PDF下载量: 236
- 被引次数: 0