


HTML
-
源—汇系统分析将物源区的剥蚀、沉积物的搬运以及最终的沉积过程作为一个完整的体系,旨在分析沉积物从“源”到“汇”的驱动机制、物源区的演化以及流域范围等科学问题,以此来指导相应地质事件的预测[1⁃4]。近年来源—汇系统分析已成为沉积学领域的研究热点,在“深时”古环境研究方面得到了广泛应用[5⁃12]。
源—汇系统各组成部分的相关参数的定量恢复是源—汇系统分析的重要内容。源—汇系统中绝大部分物质通过河流从物源区搬运至沉积区,作为“源”与“汇”沟通的纽带,河流沉积中往往蕴含着流域以及沉积盆地的重要信息[13⁃14]。近年来大量研究表明河道尺寸、河道沉积物粒度、流域面积、满岸水流量、沉积物流量等参数之间存在一定的数量关系[15⁃17],这样即使在流域保存不完整的情况下,也可以通过研究河道信息来恢复源—汇系统各组成部分的相关参数。前人曾利用水力学方程,根据河道尺寸信息来计算满岸水流量[18⁃20];同样沉积物流量也可以通过测量相应河道几何尺寸来恢复[19⁃20]。也有学者利用现代建立的河道比例关系模型,根据河道厚度重建不同河流所对应的流域面积[21⁃22]。与此同时,源—汇系统分析方法已越来越多地应用于“深时”沉积物收支评估,理论上讲源—汇系统收支应处于平衡状态[1,4,10,23⁃29]。Holbrook和Wanas于2014年提出了一种重要的源—汇系统分析方法—支点法(fulcrum approach)[25],其理论依据是在一段时间内通过河道某个横截面的物质量,既与到达该横截面的上游物源区剥蚀产物量相等,又与通过该横截面后下游沉积区的沉积物量一致。这一横截面可以看作一个支点,在这个支点两侧的“源”与“汇”的物质量保持平衡[25]。
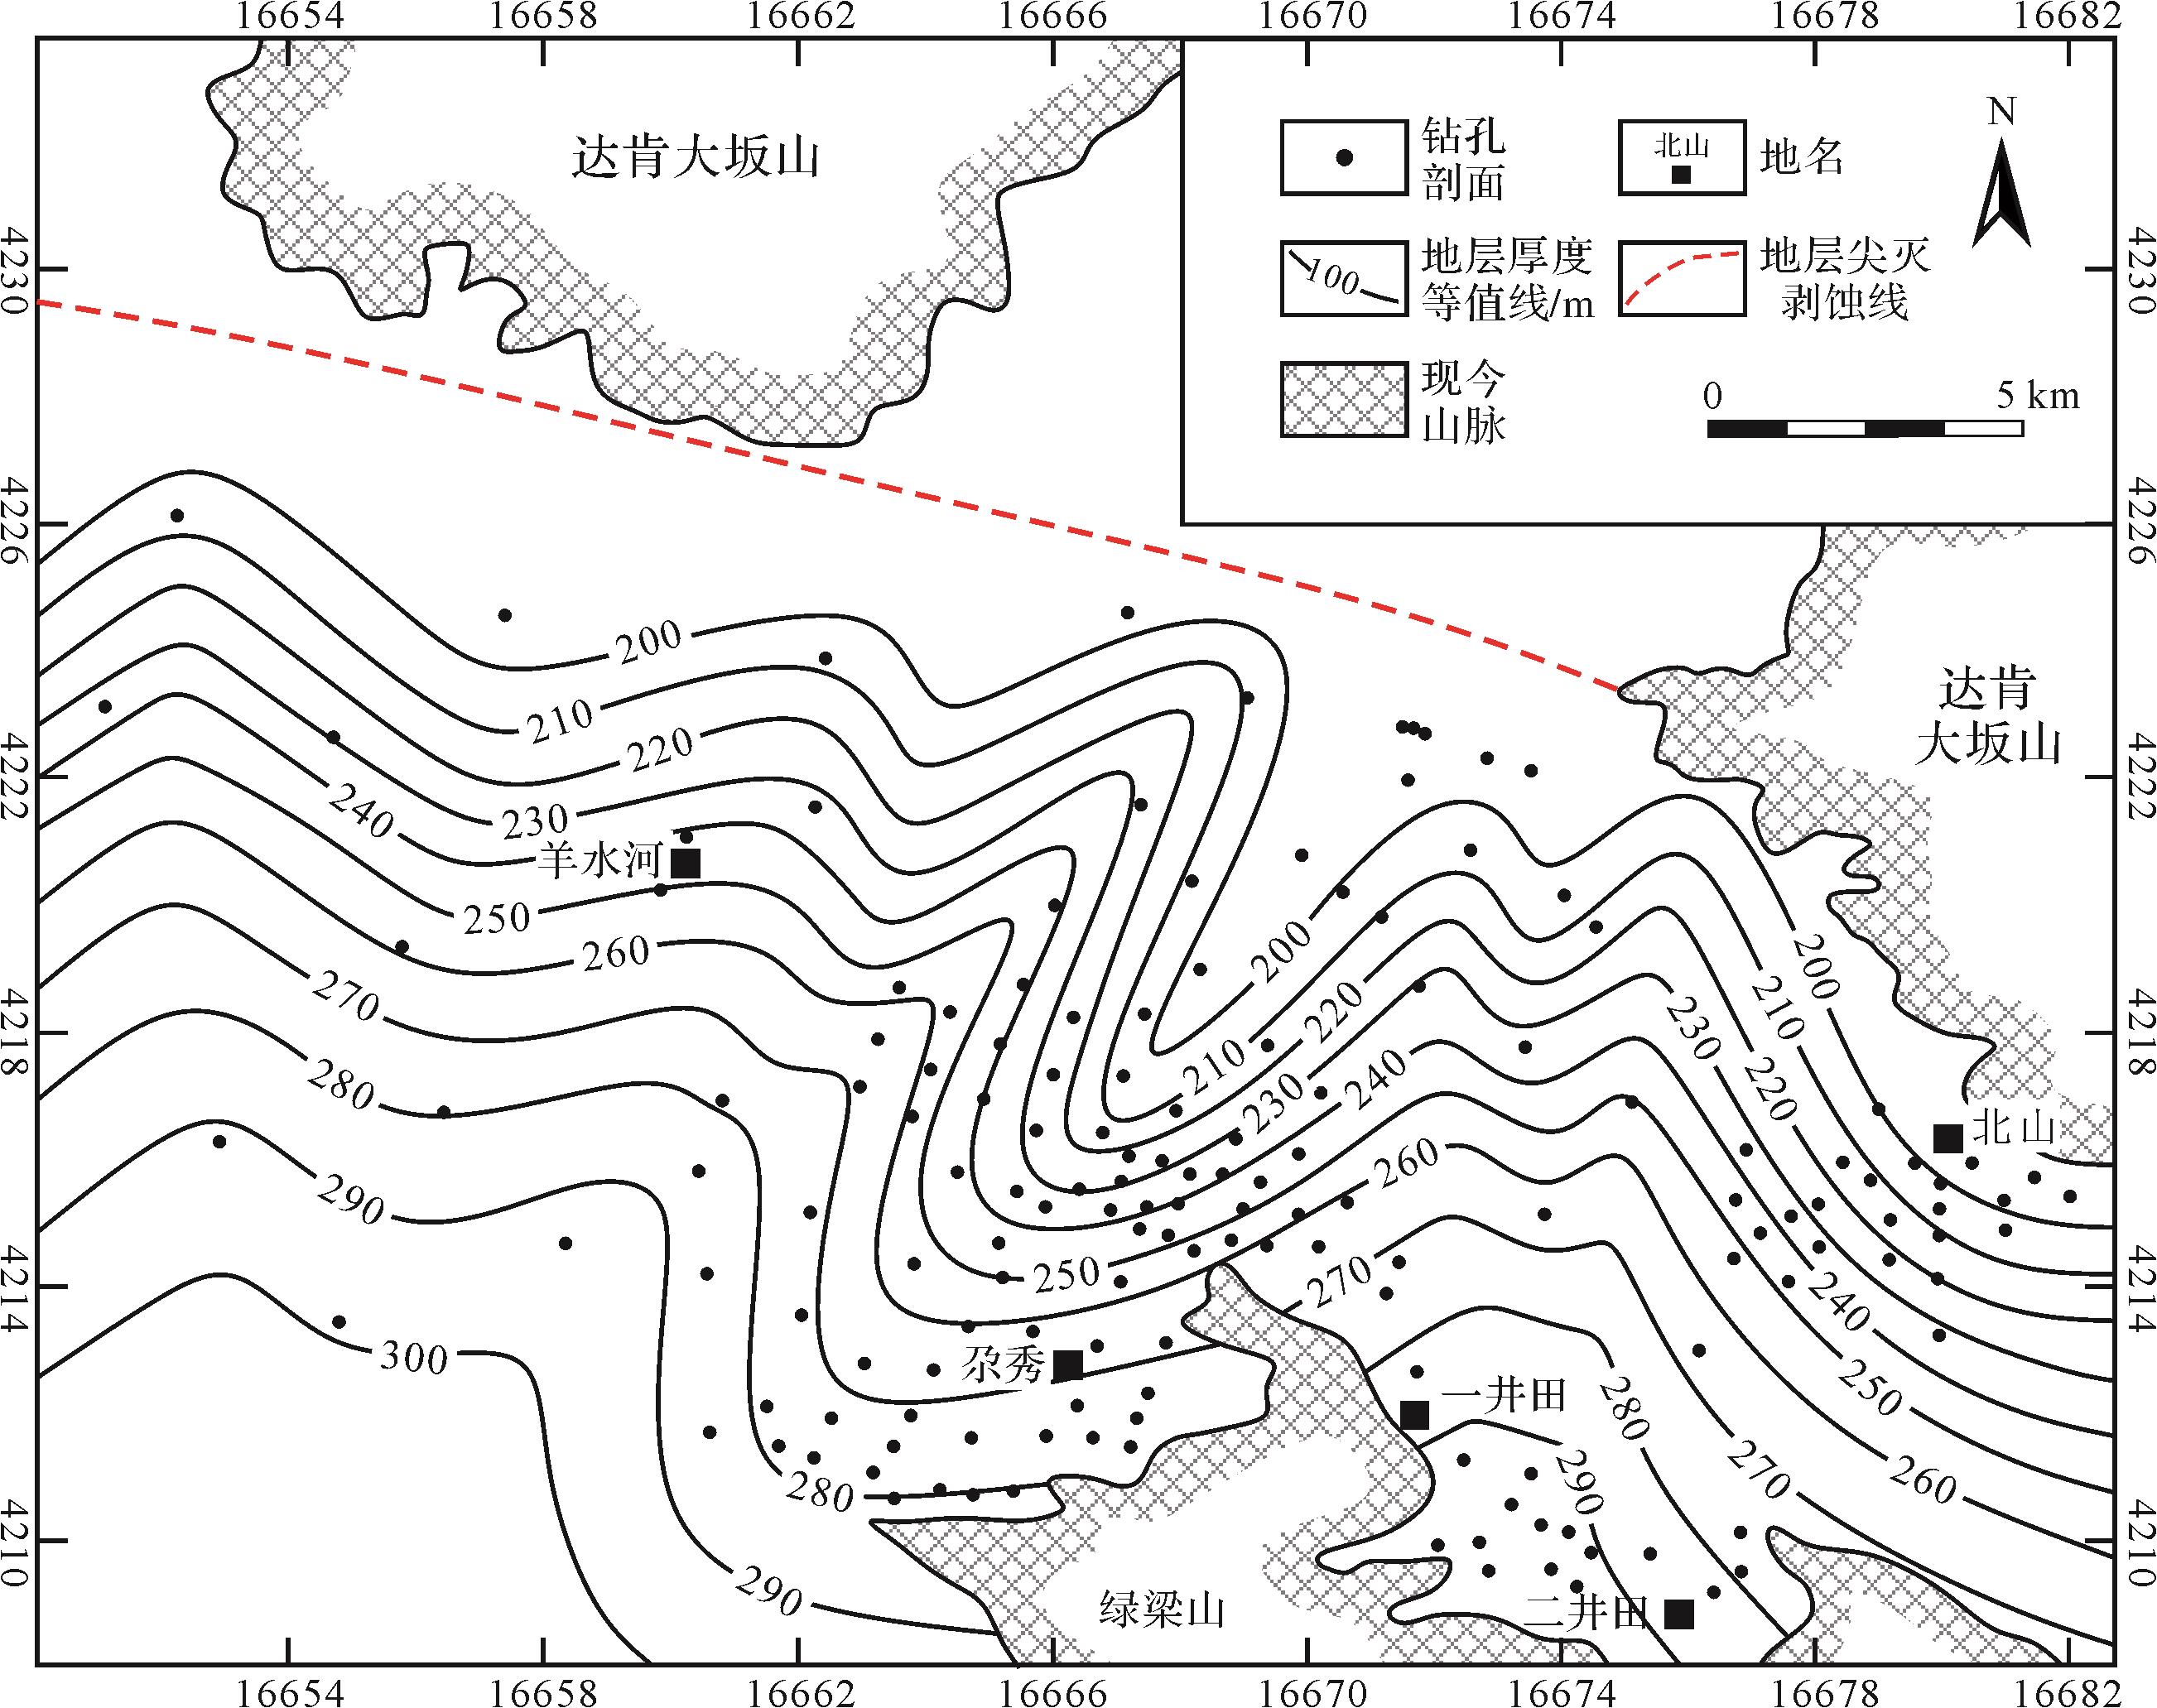
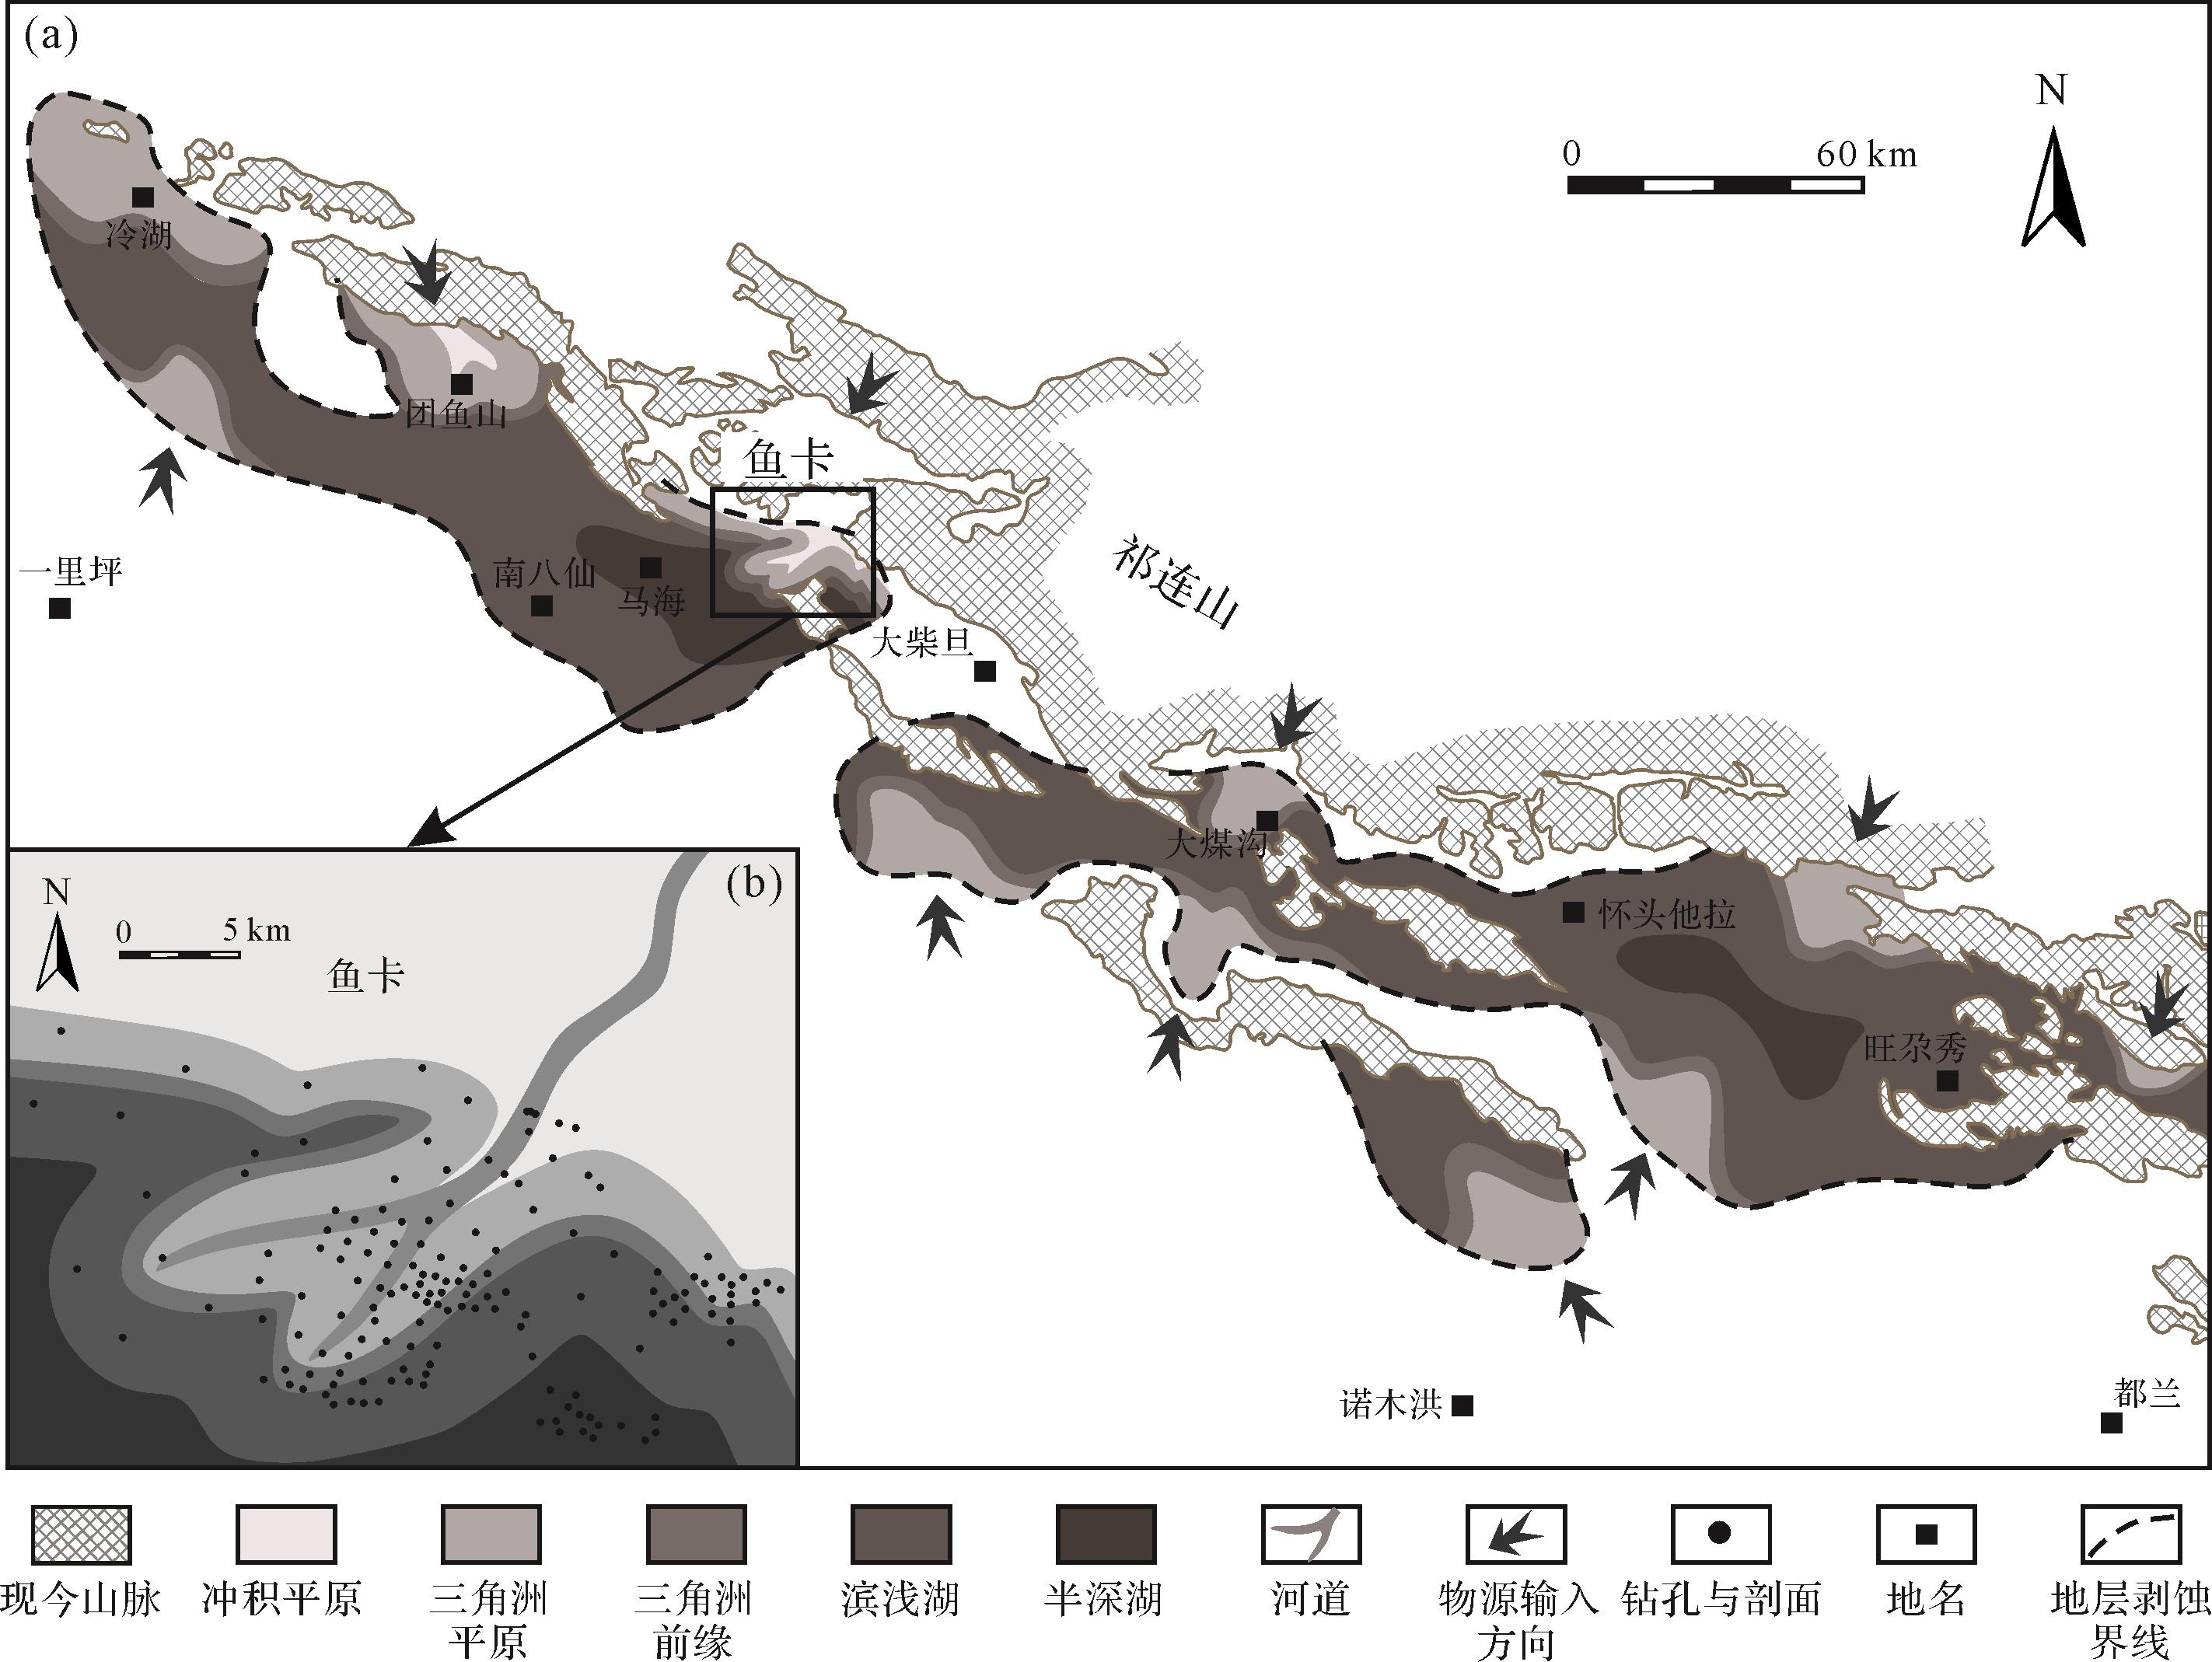
柴北缘鱼卡地区中侏罗世发育典型的曲流河—曲流河三角洲—湖泊沉积体系[30](图1)。基于鱼卡地区的露头剖面与钻孔数据,可以进行干流河道识别与测量,同时古地理也已得到高精度的定量重建。大量的砂岩薄片则可以提供河道沉积物粒度信息,为进一步计算古水力参数提供了便利。因此,柴北缘鱼卡地区是运用支点法进行源—汇系统收支分析的理想地区。

Figure 1. Geological setting of Middle Jurassic sequence S2, northern Qaidam Basin (modified from reference [30])
-
柴达木盆地为中国第三大内陆盆地,处于青藏高原的东北地区,现今属于特提斯—喜马拉雅构造域与古亚洲构造域的相交部位[31]。柴达木盆地可划分为4个一级构造单元,分别为茫崖坳陷、北部断块带、三湖坳陷与德令哈坳陷。柴达木盆地在侏罗纪大致位于北纬25°~30°[32],属于西北侏罗纪陆相盆地群的南部区域,其南部通过昆仑造山带与新特提斯洋分隔,西部为塔里木地块,北部与华北地块通过祁连山加里东褶皱带相连,东部为扬子地块,柴达木盆地的构造演化与相邻地块密切相关。柴北缘侏罗系划分为下侏罗统湖西山组和小煤沟组、中侏罗统大煤沟组和石门沟组、上侏罗统采石岭组和红水沟组[33⁃34]。
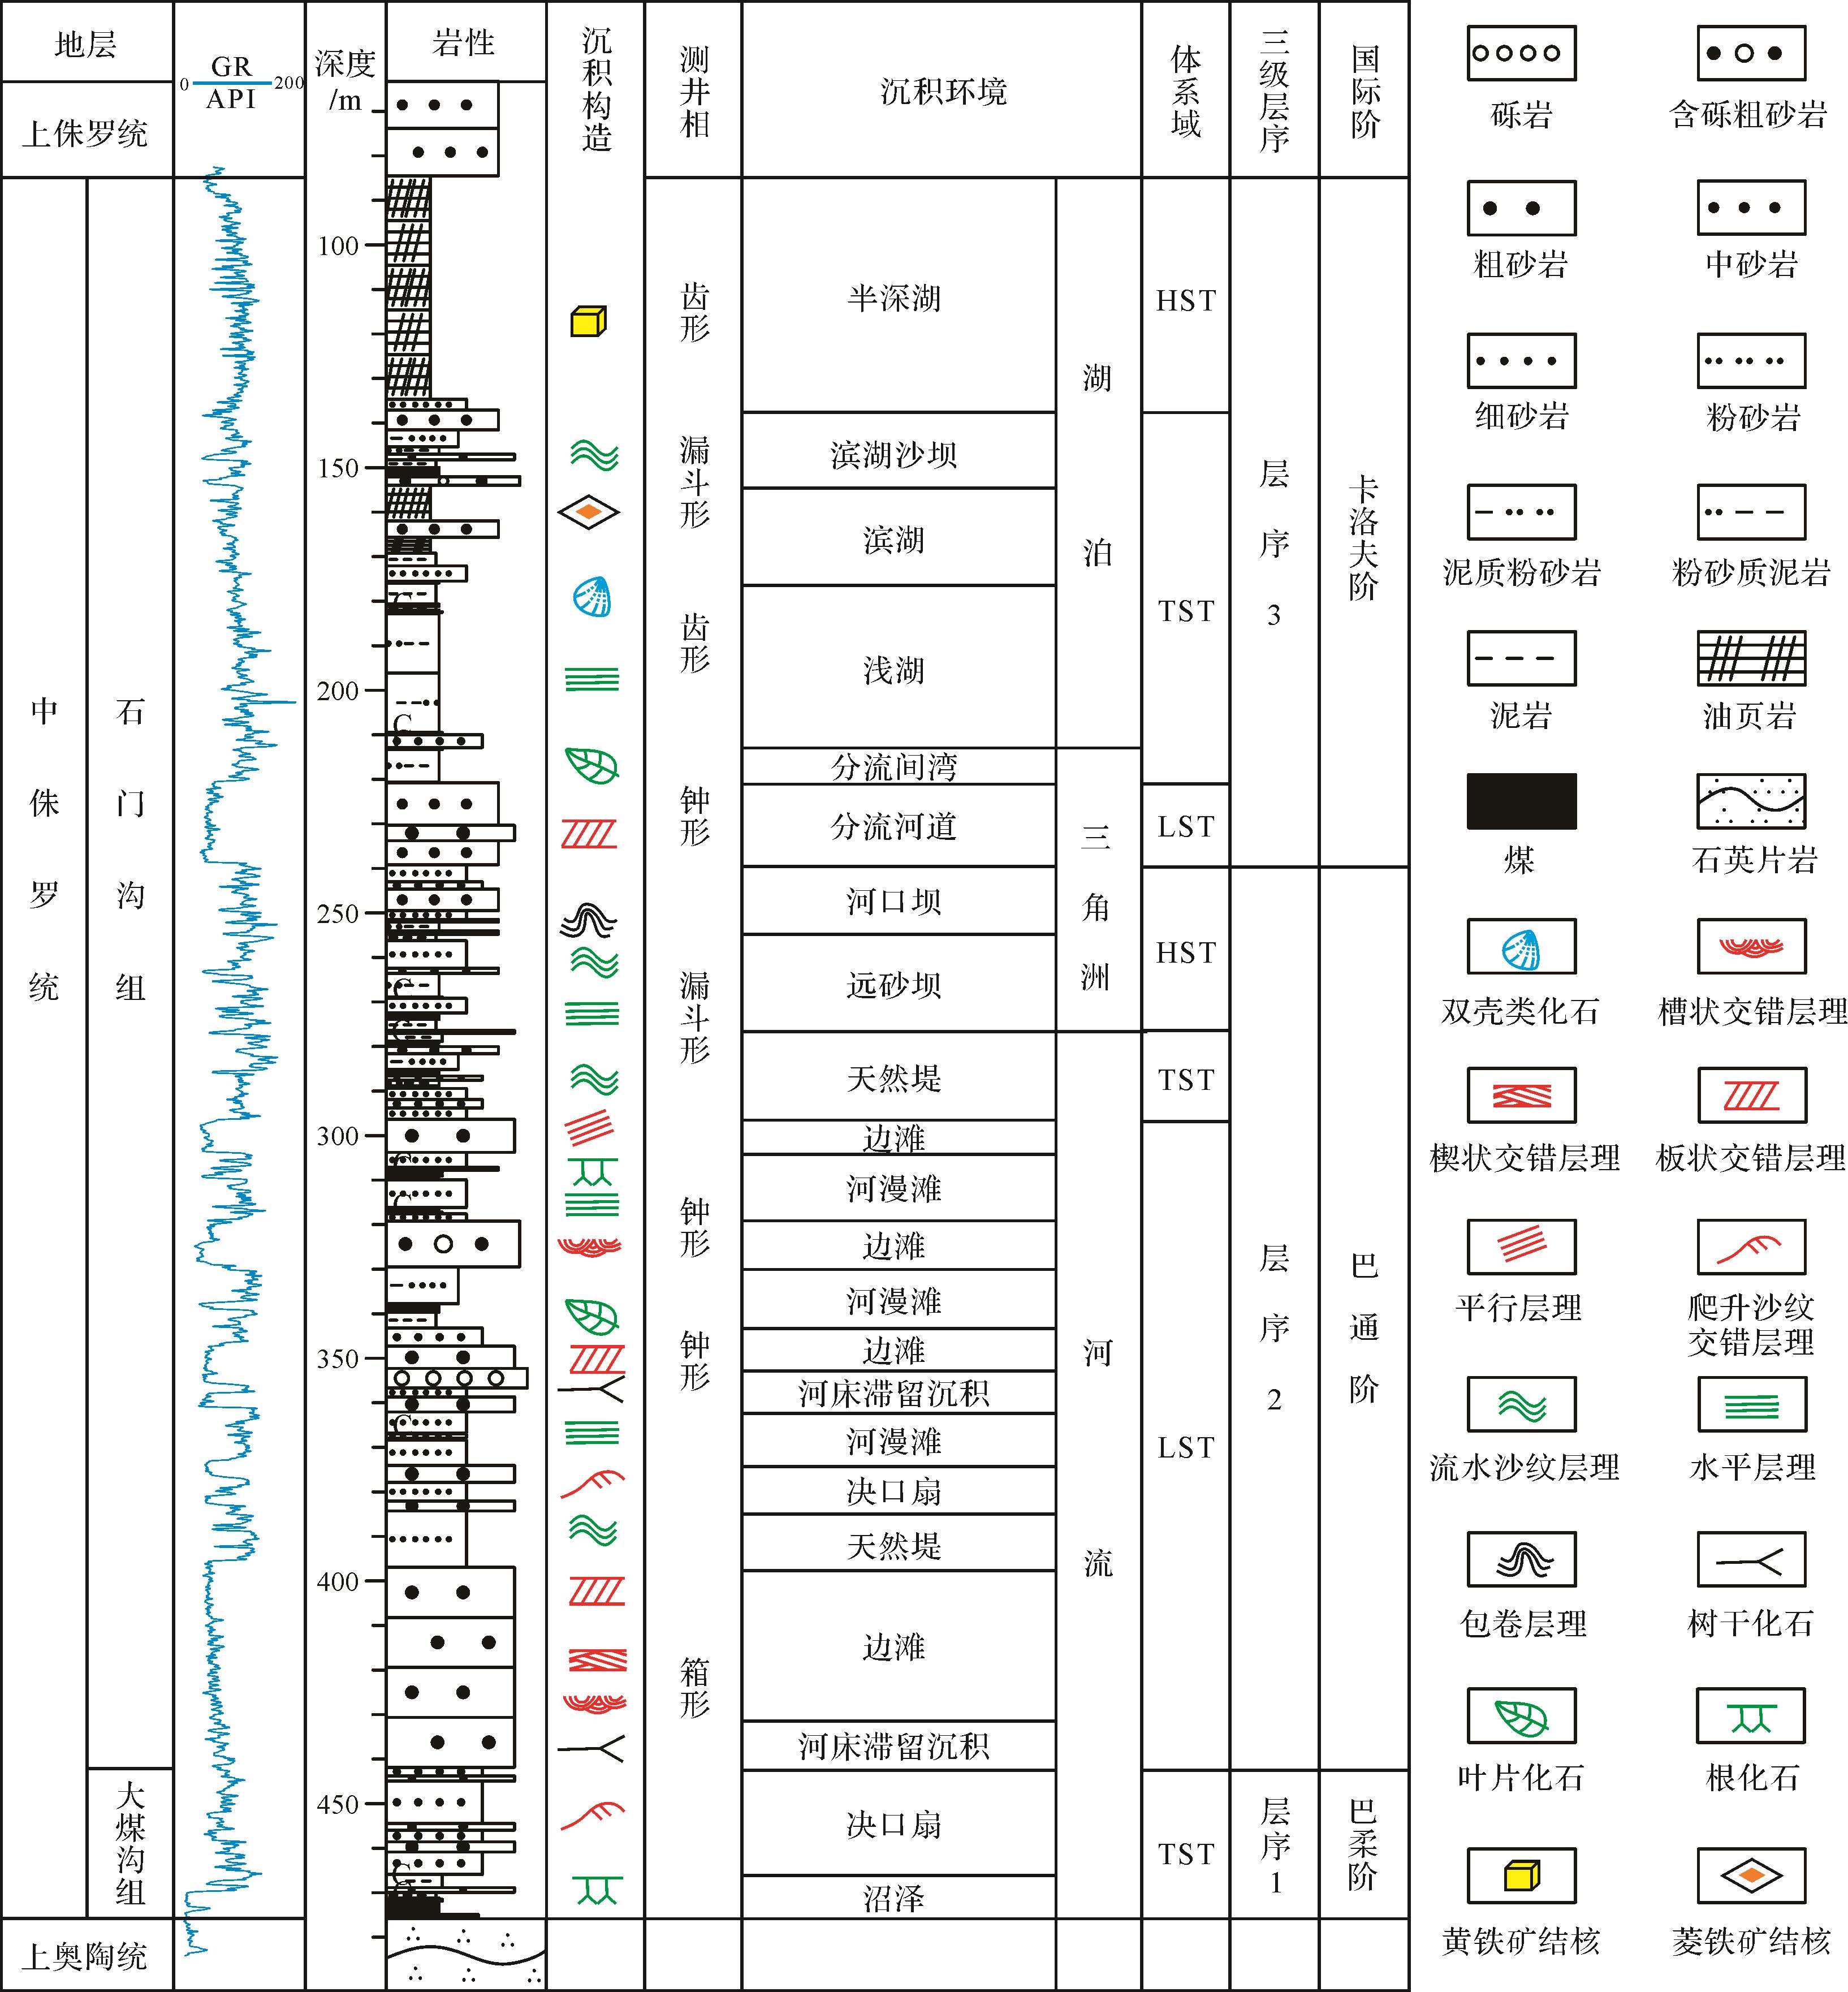
鱼卡地区位于柴北缘中部,其基底主要由上奥陶统片岩、片麻岩与凝灰岩组成。鱼卡地区中侏罗统一般厚200~600 m,包含大煤沟组与石门沟组,岩性以碎屑岩夹煤层为主。层序地层分析显示鱼卡地区中侏罗统可划分为3个三级层序,分别对应于S1、S2与S3[30](图2)。动植物化石以及孢粉组合指示了该时期温暖潮湿的古气候[35⁃36]。柴北缘鱼卡地区中侏罗统层序S2发育典型的陆相盆地源—汇系统。古地理重建表明该时期自北东向南西依次发育了曲流河、曲流河三角洲与湖泊环境,其中曲流河三角洲可进一步划分出三角洲平原与三角洲前缘,湖泊深度向南有增加的趋势,可由滨浅湖过渡为半深湖环境(图1)。构造背景与物源分析表明沉积期达肯大坂山与绿梁山尚未隆起,距鱼卡仍有一段距离的祁连山为当时的物源区。河流将北部祁连山风化剥蚀的物质源源不断地搬运至南部沉积区,构成了配置关系清晰且得到合理约束的源—汇系统。

Figure 2. Depositional facies and sequence stratigraphy of Middle Jurassic in Yuqia area, northern Qaidam Basin (after reference [30])
-
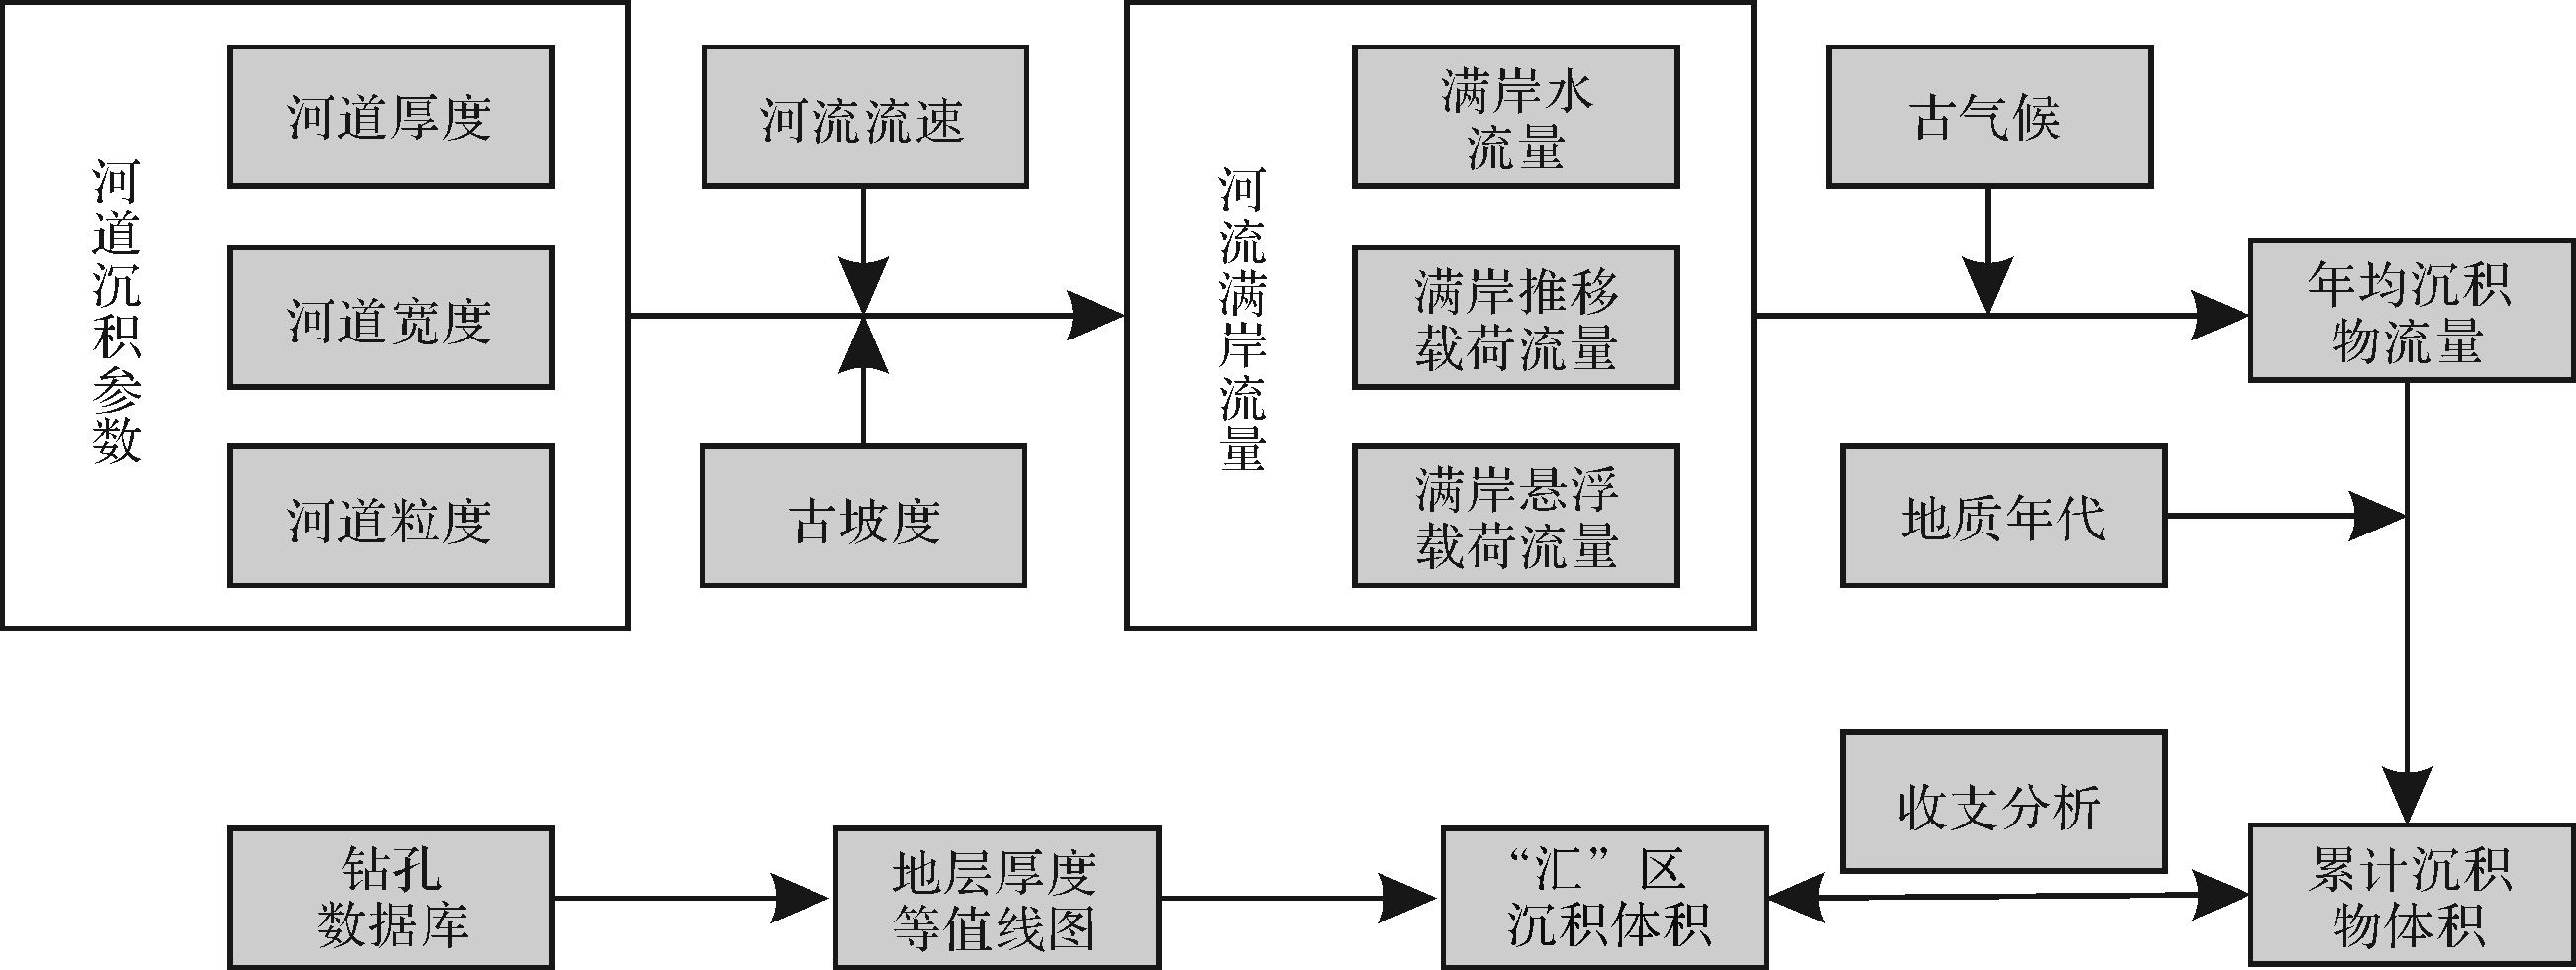
通过支点法进行源—汇系统收支定量分析的研究流程主要包括以下五个步骤(图3):第一步,识别干流河道沉积,测量或计算河道尺寸,进行粒度分析;第二步,计算瞬时满岸水流量及沉积物流量;第三步,结合古气候分析,对年均沉积物量进行计算;第四步,得出在给定地层持续时间内输送的沉积物量;第五步,对沉积区的沉积物量进行测量统计,并与第四步所得出的沉积物量进行对比,分析源—汇系统收支状况。

Figure 3. Work flow for source⁃to⁃sink system analysis
-
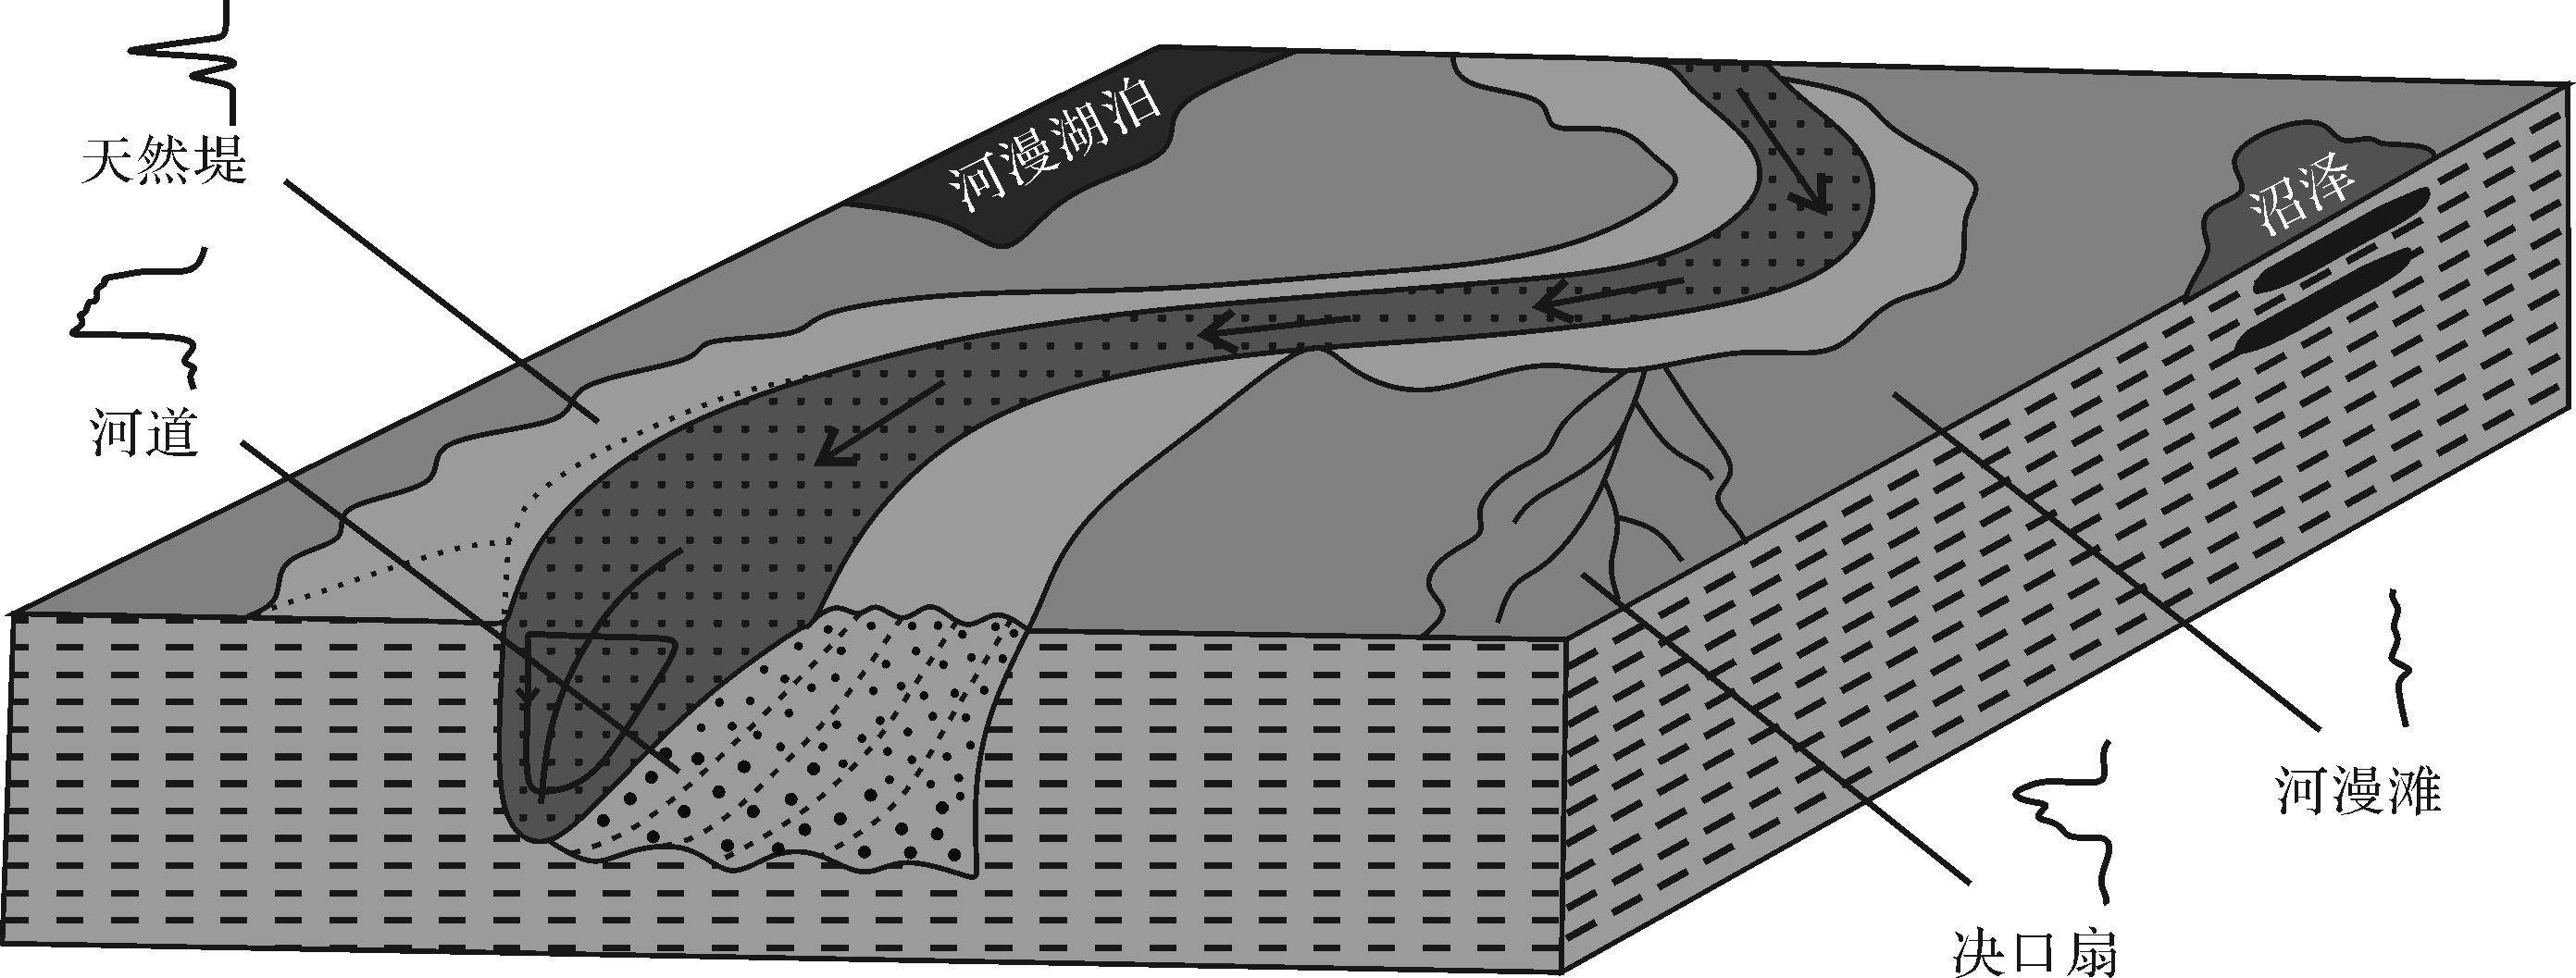
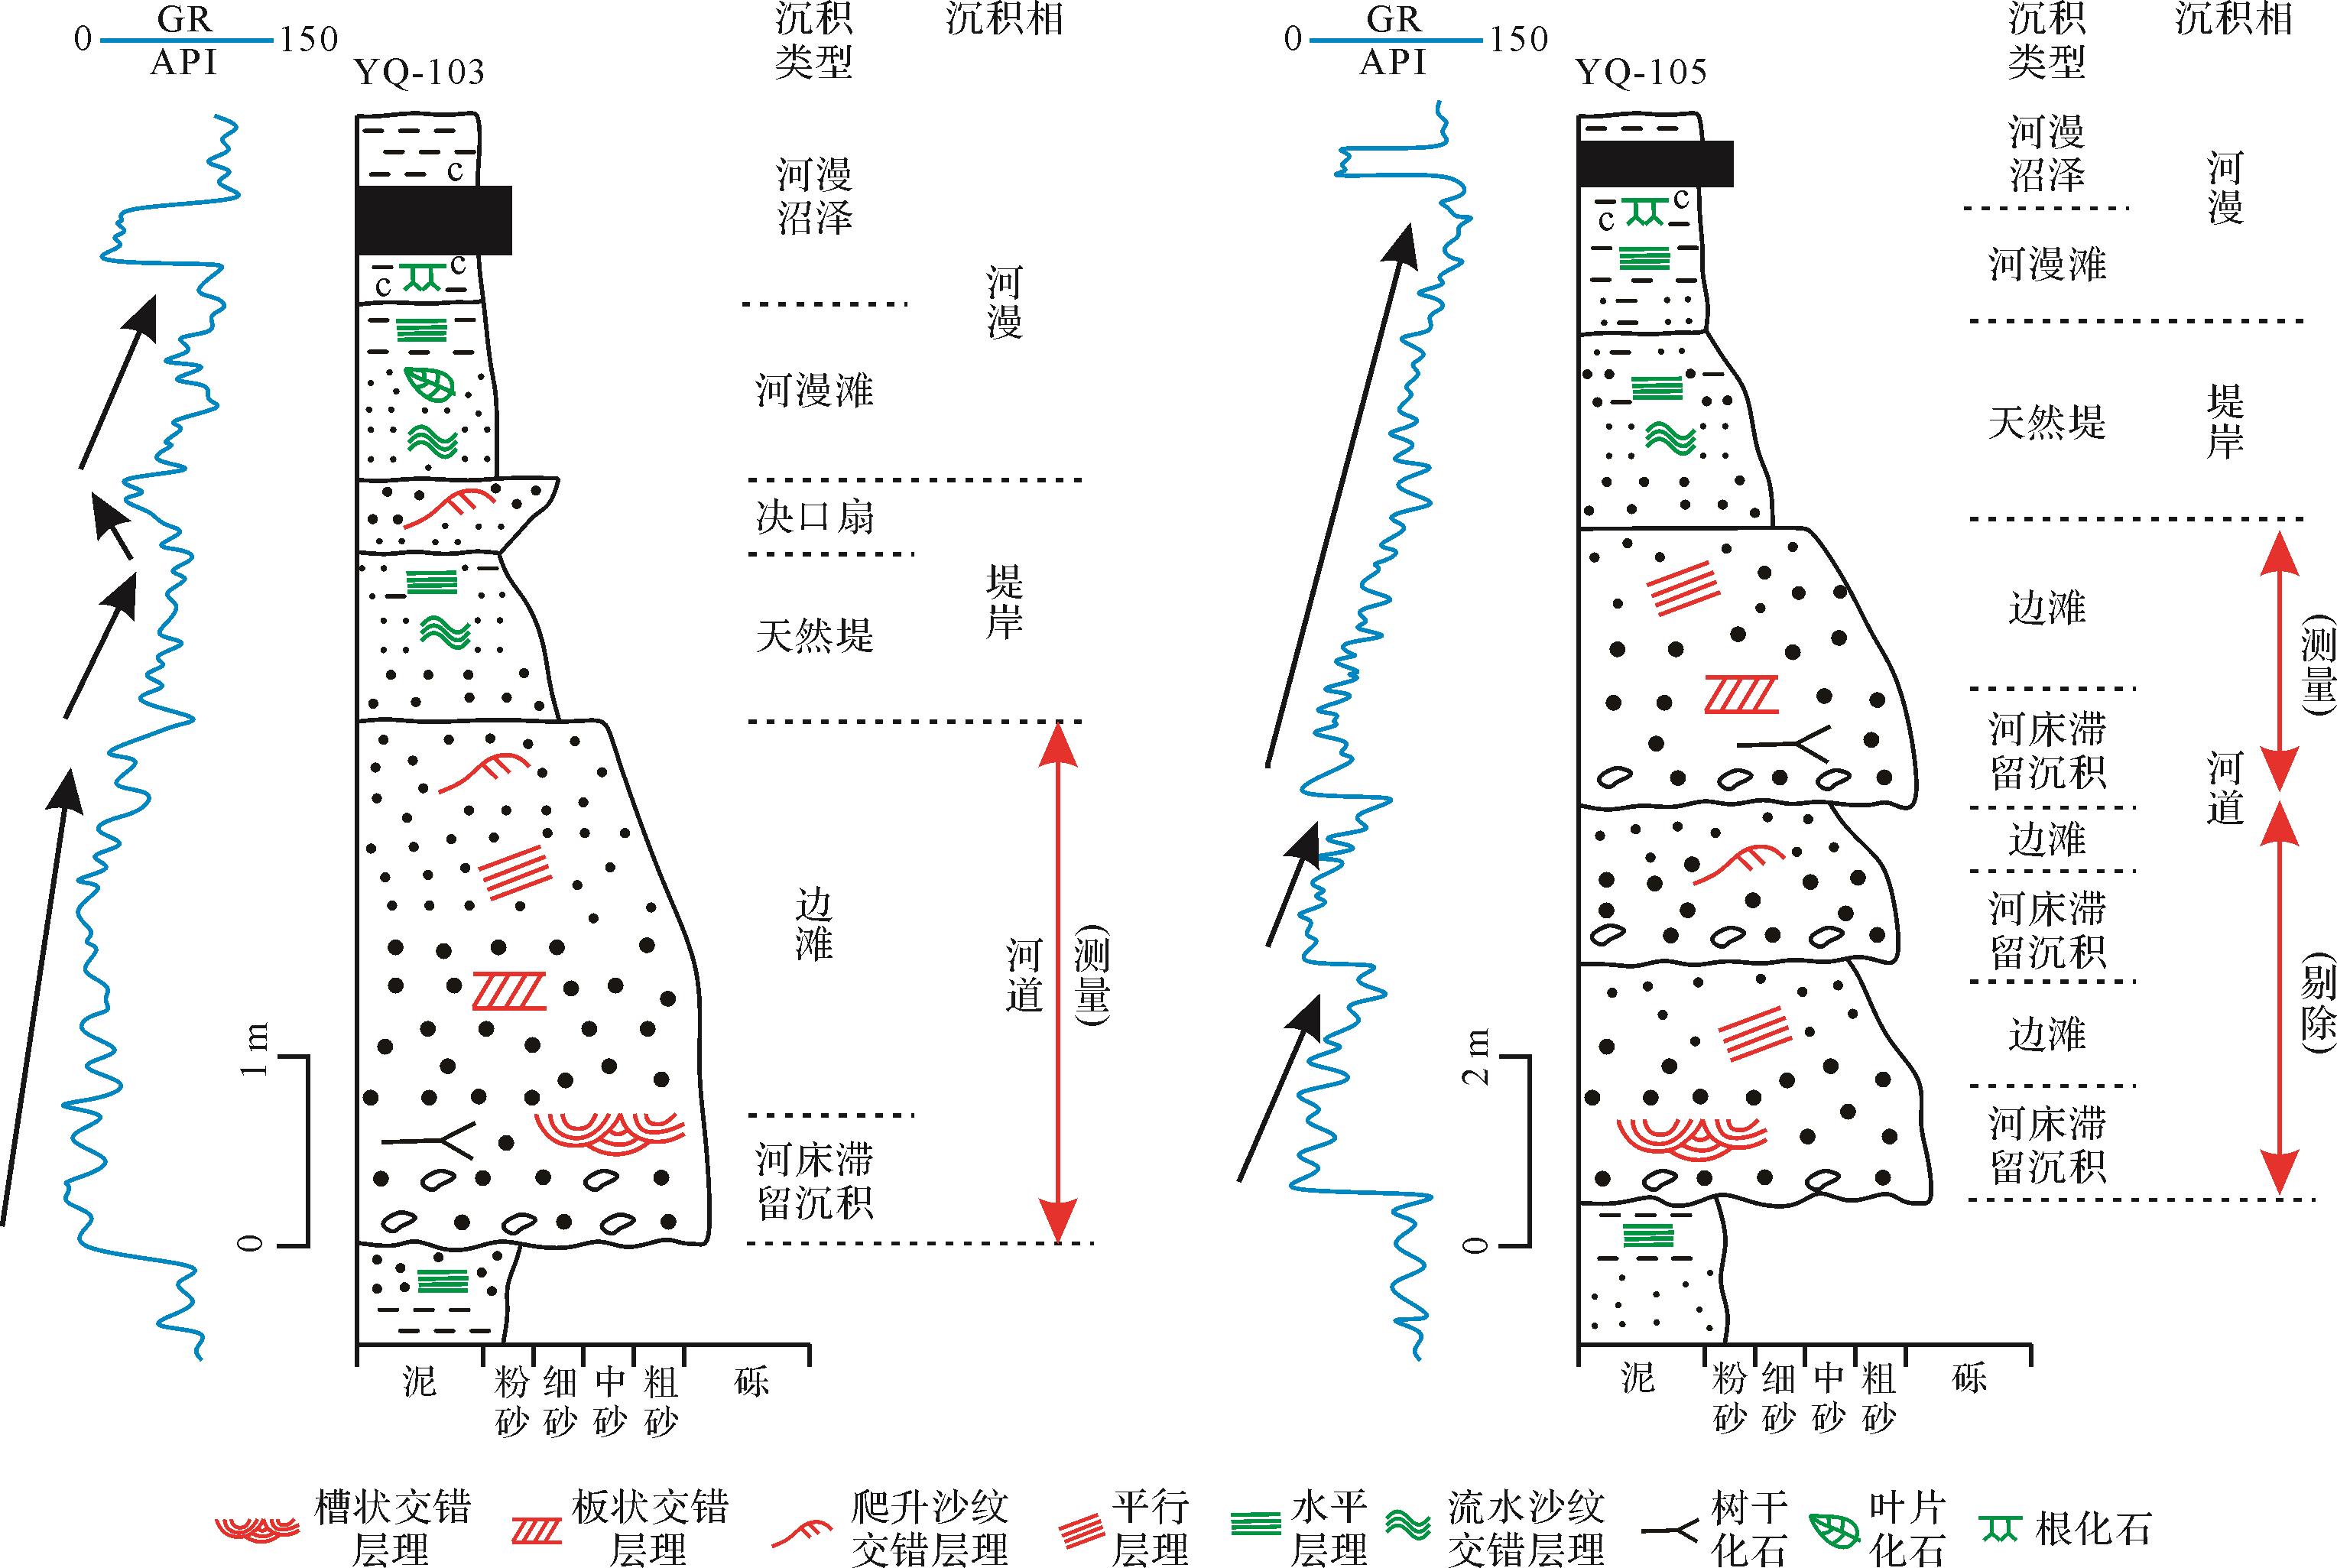
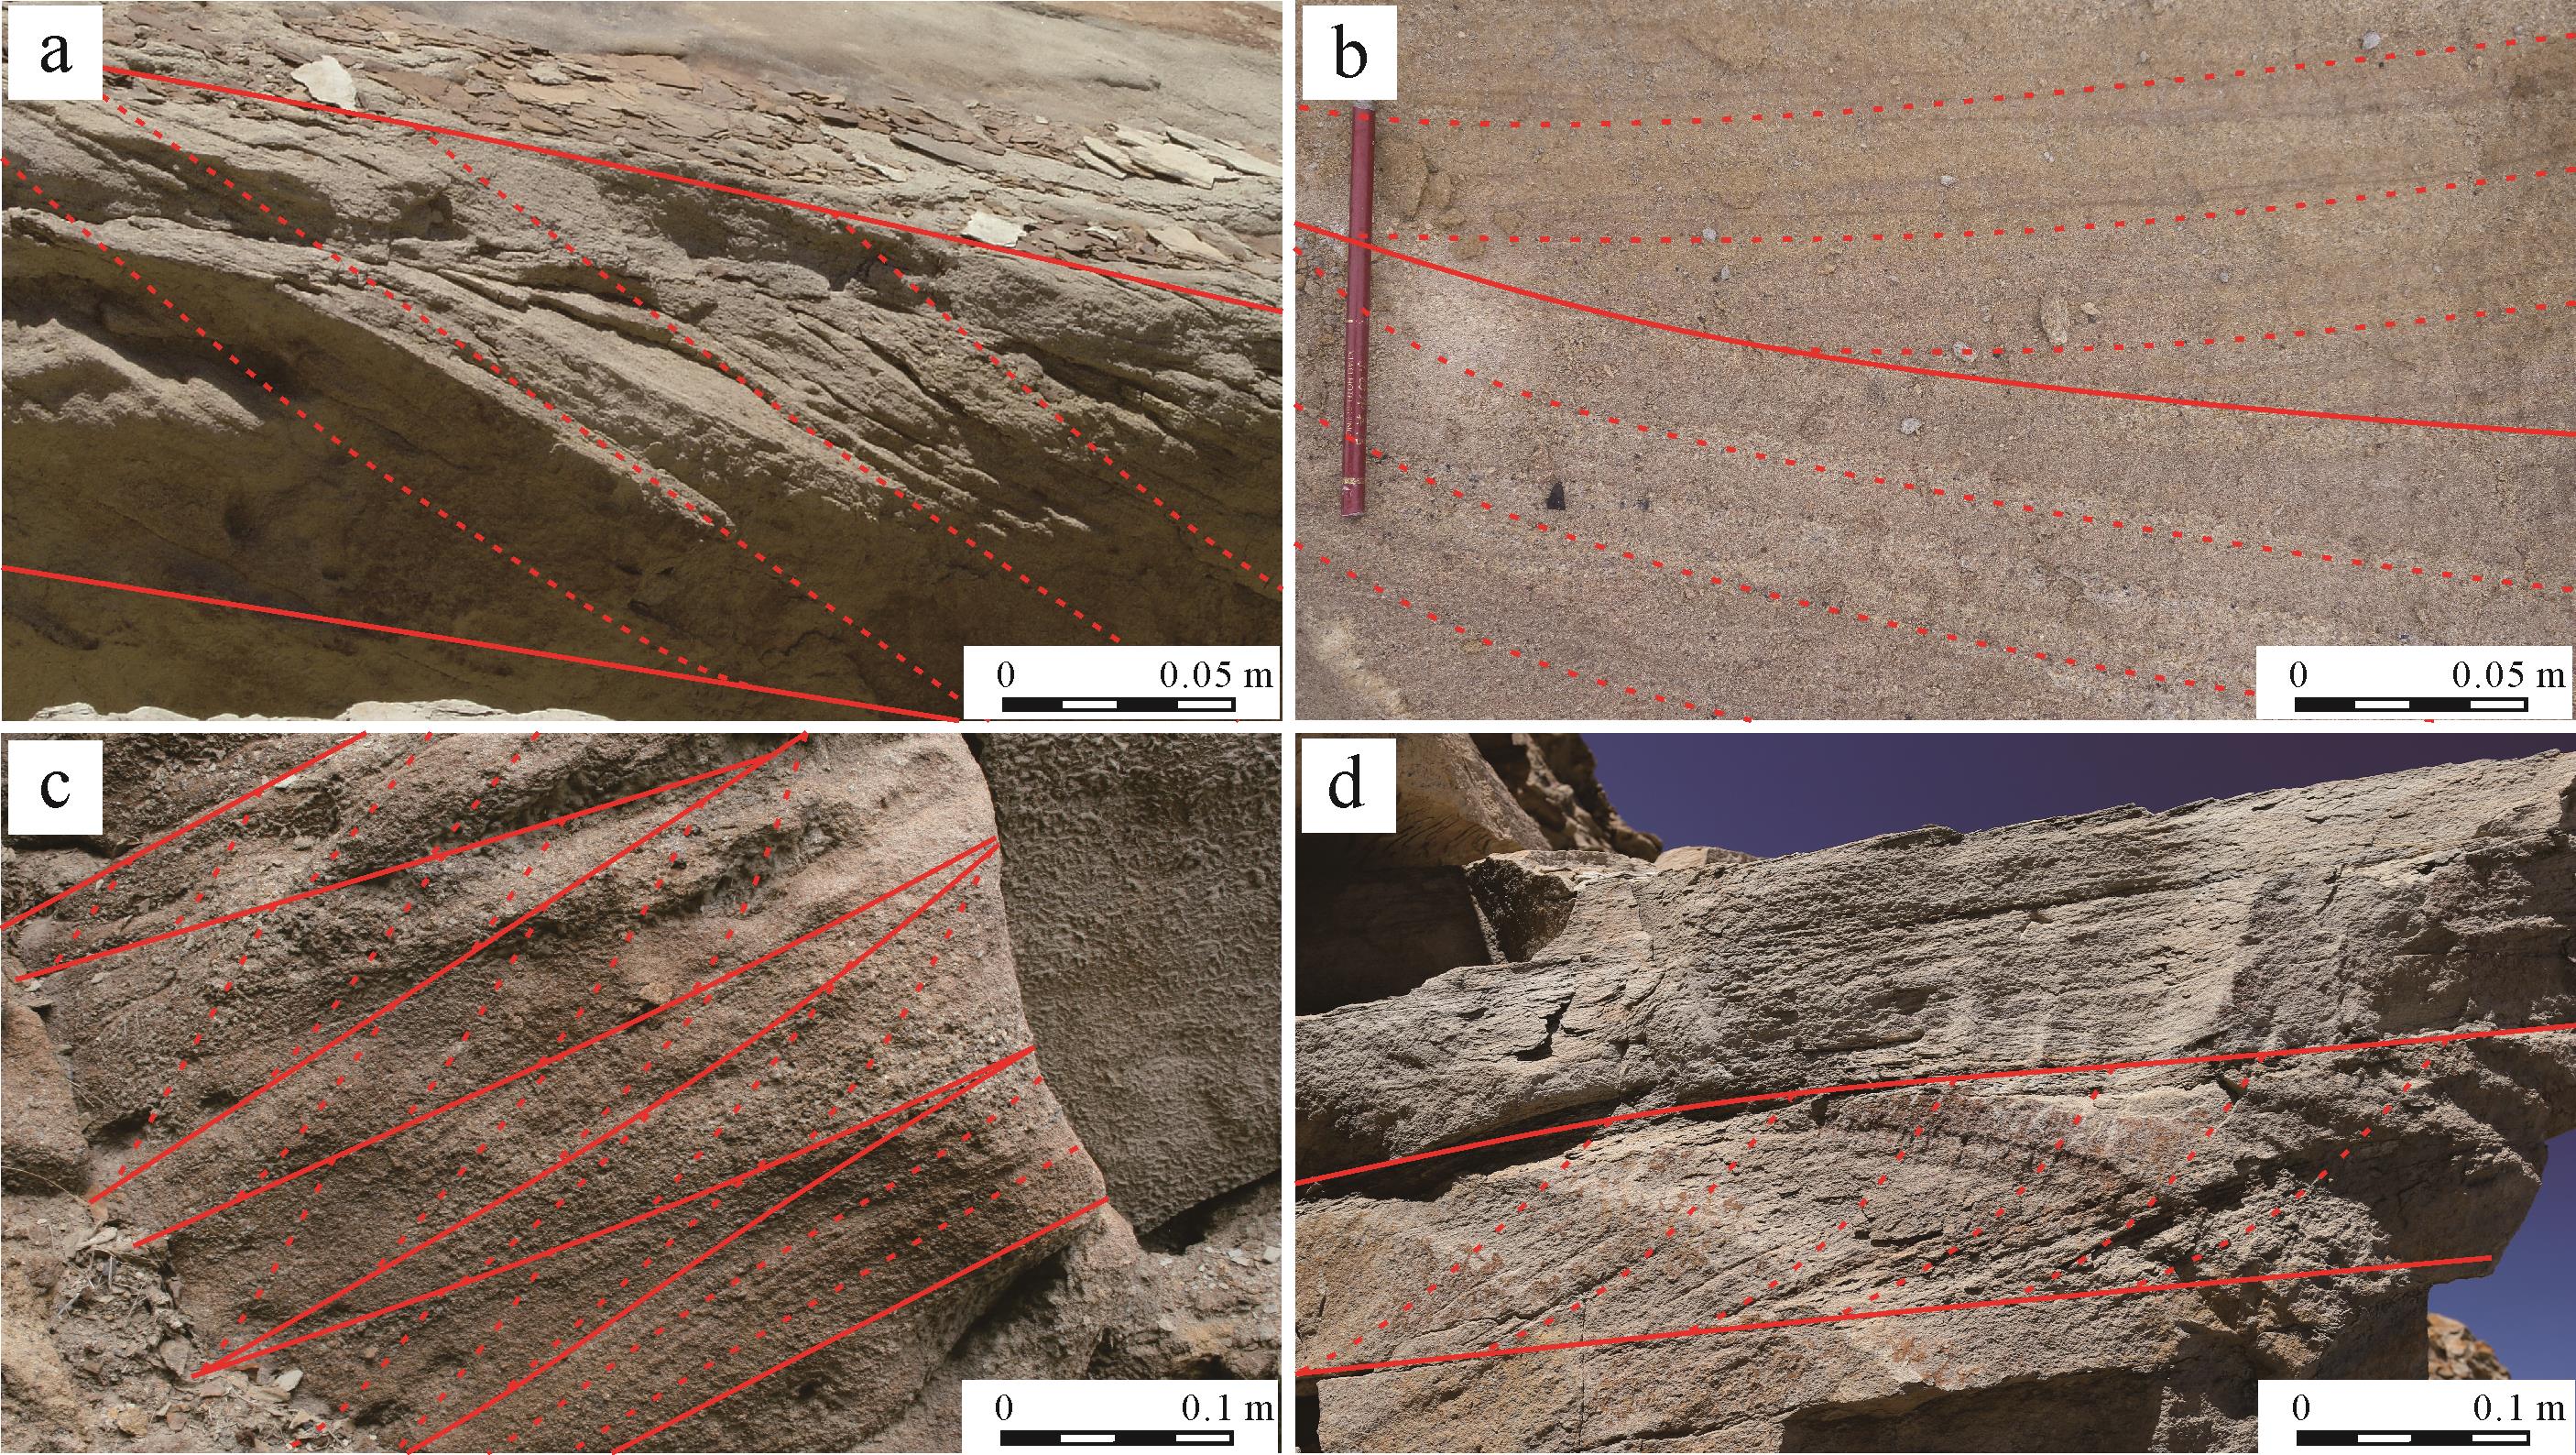
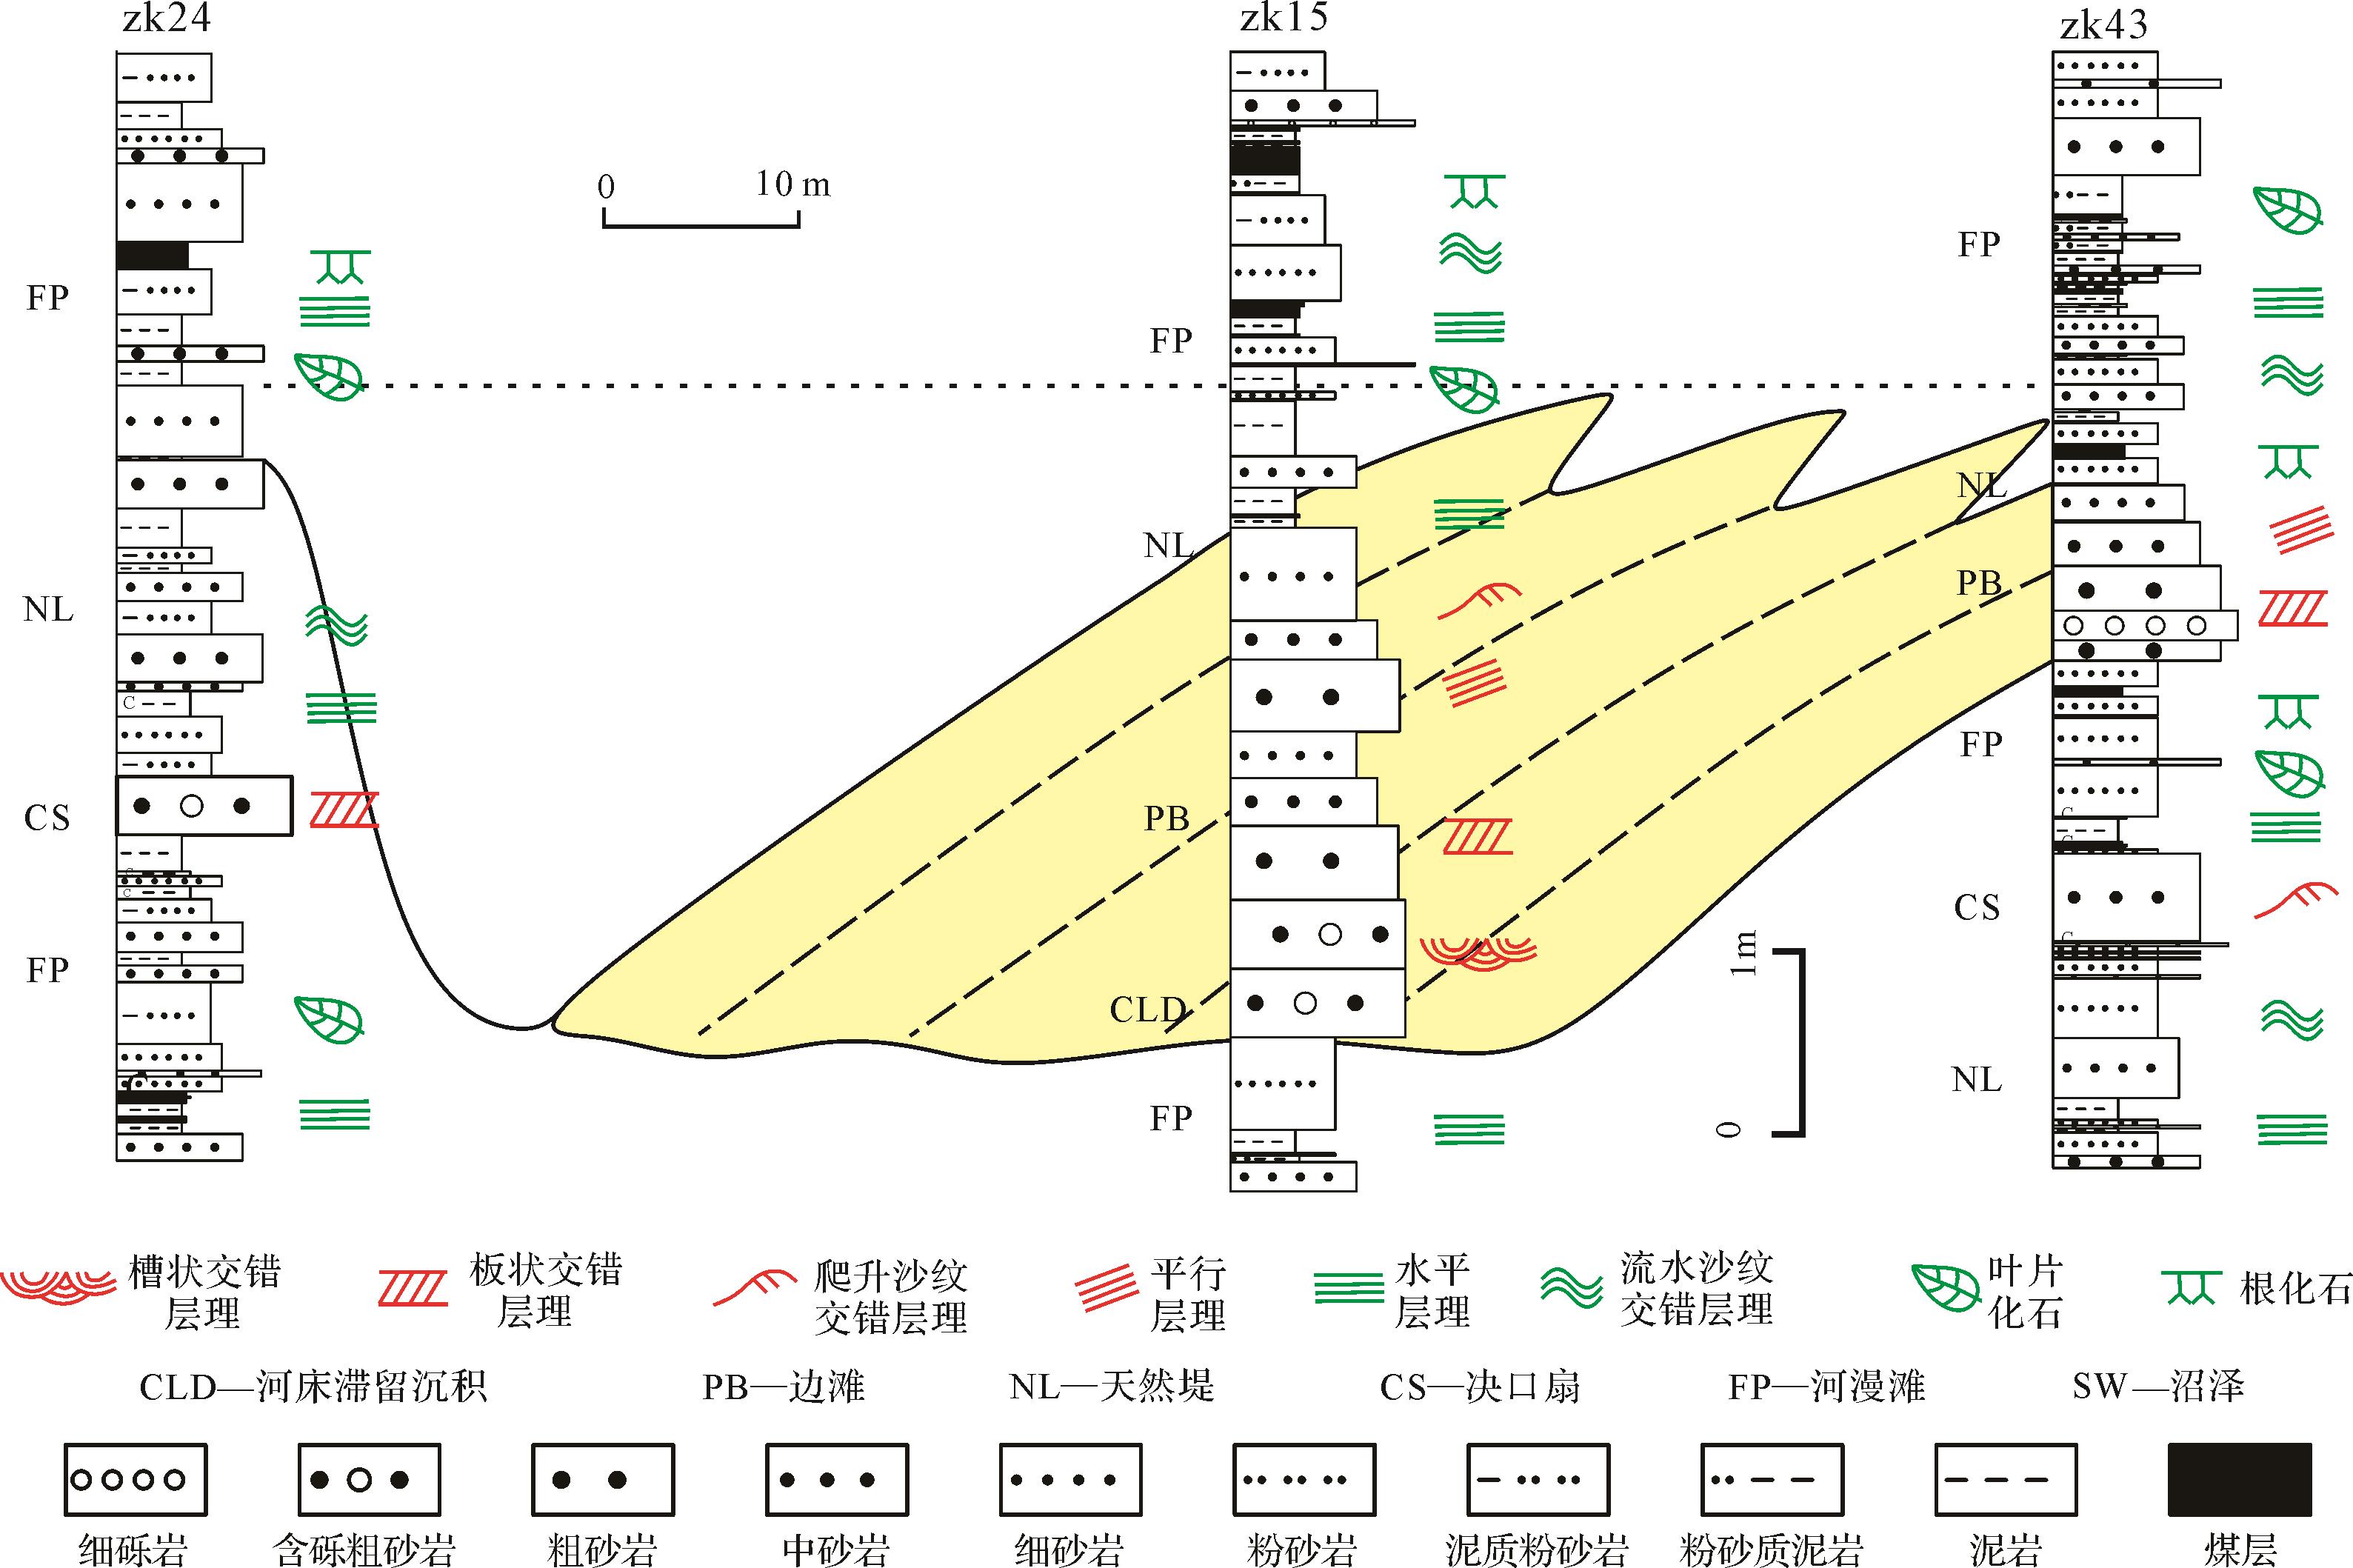
河道尺寸分析主要包括满岸深度与河道宽度的恢复。满岸深度可以通过测量野外剖面、钻孔岩心以及测井曲线所对应的完整保存的河道厚度来确定,考虑到沉积后的压实作用,通常将实测的河道厚度提高10%来作为满岸深度[37]。曲流河沉积体系中的河道、天然堤、决口扇以及河漫滩均有特定的岩相组合、沉积构造以及垂向变化趋势,同时对应一定的测井曲线形态(图4)。河道厚度的测量主要基于沉积序列与测井曲线的综合识别,沉积序列一般呈向上变细的趋势,下部河床滞留沉积厚度相对较小,可见槽状交错层理与树干化石,边滩作为河道的主体,常发育板状交错层理、平行层理以及爬升沙纹交错层理,与河道对应的测井曲线多表现为钟形或箱形(图5)。向上过渡为堤岸与河漫粒度较细的沉积,GR测井值相对较高,偶见漏斗形的测井曲线,指示了决口扇沉积。河道厚度的测量过程中需要选择完整保存的河道序列,而河道序列的保存主要取决于沉积物供给与可容空间之间的关系。在高沉积供给速率与低可容空间背景下容易出现多层河道叠置的情况,此时上覆河道往往会对下伏河道序列造成侵蚀而使其无法完整保存,应只测量最后一期完整保存的河道厚度来确定(图5)。鱼卡地区层序S2时期盆地沉降较为稳定,一般具有较高的可容空间背景,比较有利于完整河道序列的保存,给河道厚度的测量带来了便利。

Figure 4. Gamma ray well log patterns for different depositional facies in fluvial depositional systems (modified from reference [38])

Figure 5. Sedimentary succession of meandering river, sequence S2 in Yuqia area, northern Qaidam Basin
此外,利用底形高度与水流深度之间的比例关系也可以作为一种独立评估满岸深度的方式,与直接测量河道厚度的方式相互检验。交错层系(cross-bed set)厚度与河流沙丘高度具有明显的正相关性,Leclair et al.[39]基于现代河流水槽试验提出了二者的经验公式:
Hm =5.3β +0.001β 2(1) 式中:Hm 为沙丘平均高度,β=Sm /1.8,Sm 为交错层系平均垂向厚度[39]。
前人研究表明满岸深度一般为沙丘平均高度的6~10倍[25,39],因此将所计算的沙丘平均高度扩大6~10倍,即可得到满岸深度的范围。鱼卡地区河道沉积中可见明显的交错层理,主要包括板状交错层理、槽状交错层理与楔状交错层理,本次对其层系进行了标定与测量(图6)。这样在河道保存不完整或者仅局部出露的情况下,交错层系的厚度依然较为容易获取,进而独立计算满岸深度。

Figure 6. Cross⁃bed sets in meandering river channel deposits of sequence S2 in Yuqia area, northern Qaidam Basin
相对于河道厚度,河道宽度并不容易在野外剖面或者钻孔岩心中直接测量出来,但可以通过其他方法恢复。鱼卡地区层序S2发育的曲流河河道(图7),可以通过Bridge et al.[40]针对曲流河所提出的方程进行宽度评估:
Bbf =8.8Hbf 1.82(2) 式中:Hbf 为满岸深度,Bbf 为河道宽度。

Figure 7. Cross⁃section of meandering river channel deposits, sequence S2 in Yuqia area, northern Qaidam Basin
本次将鱼卡地区层序S2河道沉积中的砂岩样品,磨制成薄片并进行显微镜下粒度分析。沉积物粒径可以用来评估河床上的剪切应力,主要由水流深度和地形决定,并控制了泥沙输送模式(推移载和悬浮载荷)以及水流和泥沙输送速度[24]。粒径中值(D50)在接下来的过程中对满岸水流量以及古坡度的恢复具有一定的价值[25],粒径分布系列D16、D50、D84、D90则可以用来分析沉积物流量。
-
河道尺寸及粒度分析是满岸水流量与沉积物流量恢复的前提条件,此外古坡度与流速也是重要的基础参数。在现存的地层记录中,直接对古坡度进行测量的难度较高,但是可以应用Holbrook et al.[25]提出的方程进行计算:
τ *bf 50=(Hbf S )/(PD 50)=const(3) 式中:S为古坡度,D50为粒径中值。若沉积物以石英质为主则其密度可以假定为2.65 g/cm3,那么标准密度水中的浸没无量纲密度P为1.65。无量纲剪切应力的满岸阻抗参数τ* bf50为1.86[41⁃43]。
本次河流流速的恢复采用了两种不同的方法,从而可以对分析结果进行交叉比较。第一种方法利用Rubin et al.[44]建立的底床形态相位图,基于已获得的粒径、底床形态、水深来推断对应的流速。第二种方法是利用水力学方程对流速进行计算,基于Chezy系数、水力半径和古坡度来分析河流流速[25,39,45]:
v =Cz (RS )1/2(4) 式中:Cz 为Chezy系数,Cz =8.1g1/2(Hbf /ks )1/6;ks 为底形粗糙程度,ks =3D90+1.1Δ(1-e-25ψ );Δ为底形高度,Δ=Hbf /8;ψ=Δ/λ,λ为底形波长,λ=7.3Hbf;R为水力半径,R=(Bbf ×Hbf )/(2Hbf +Bbf )。
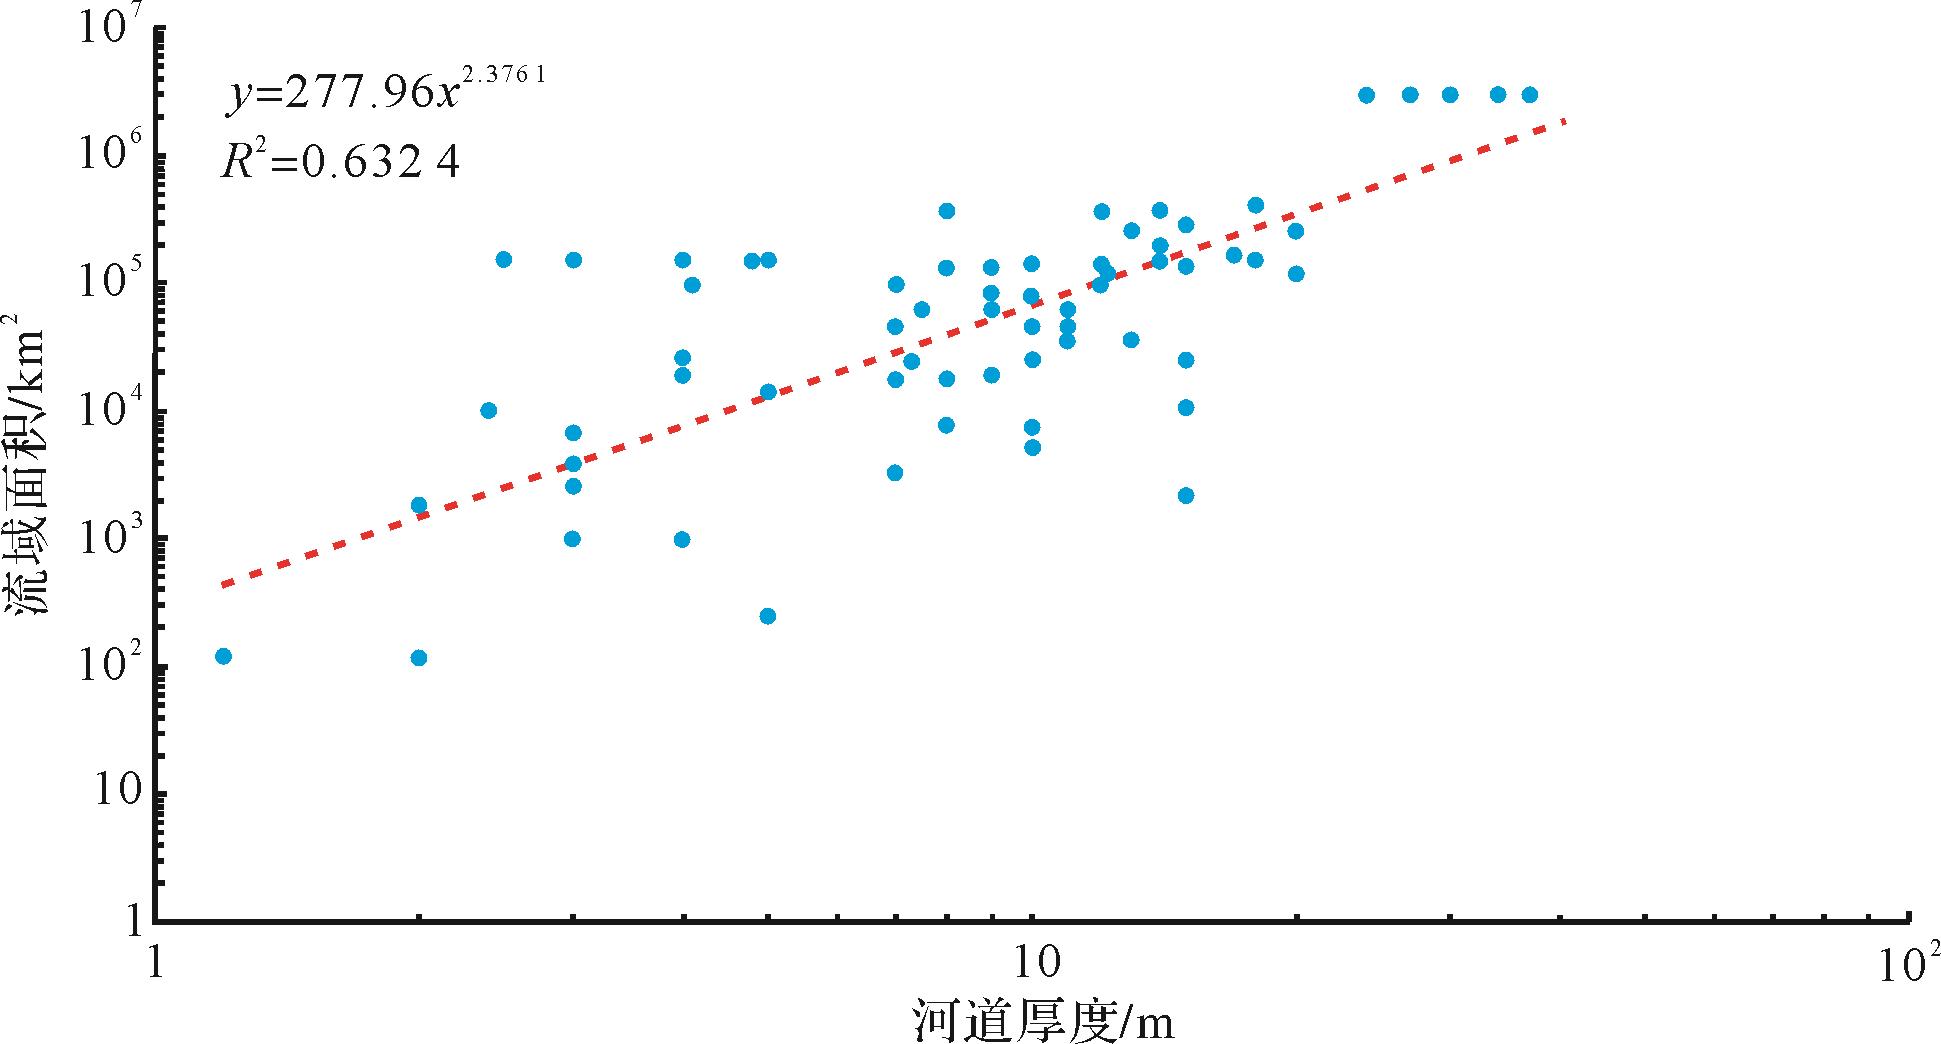
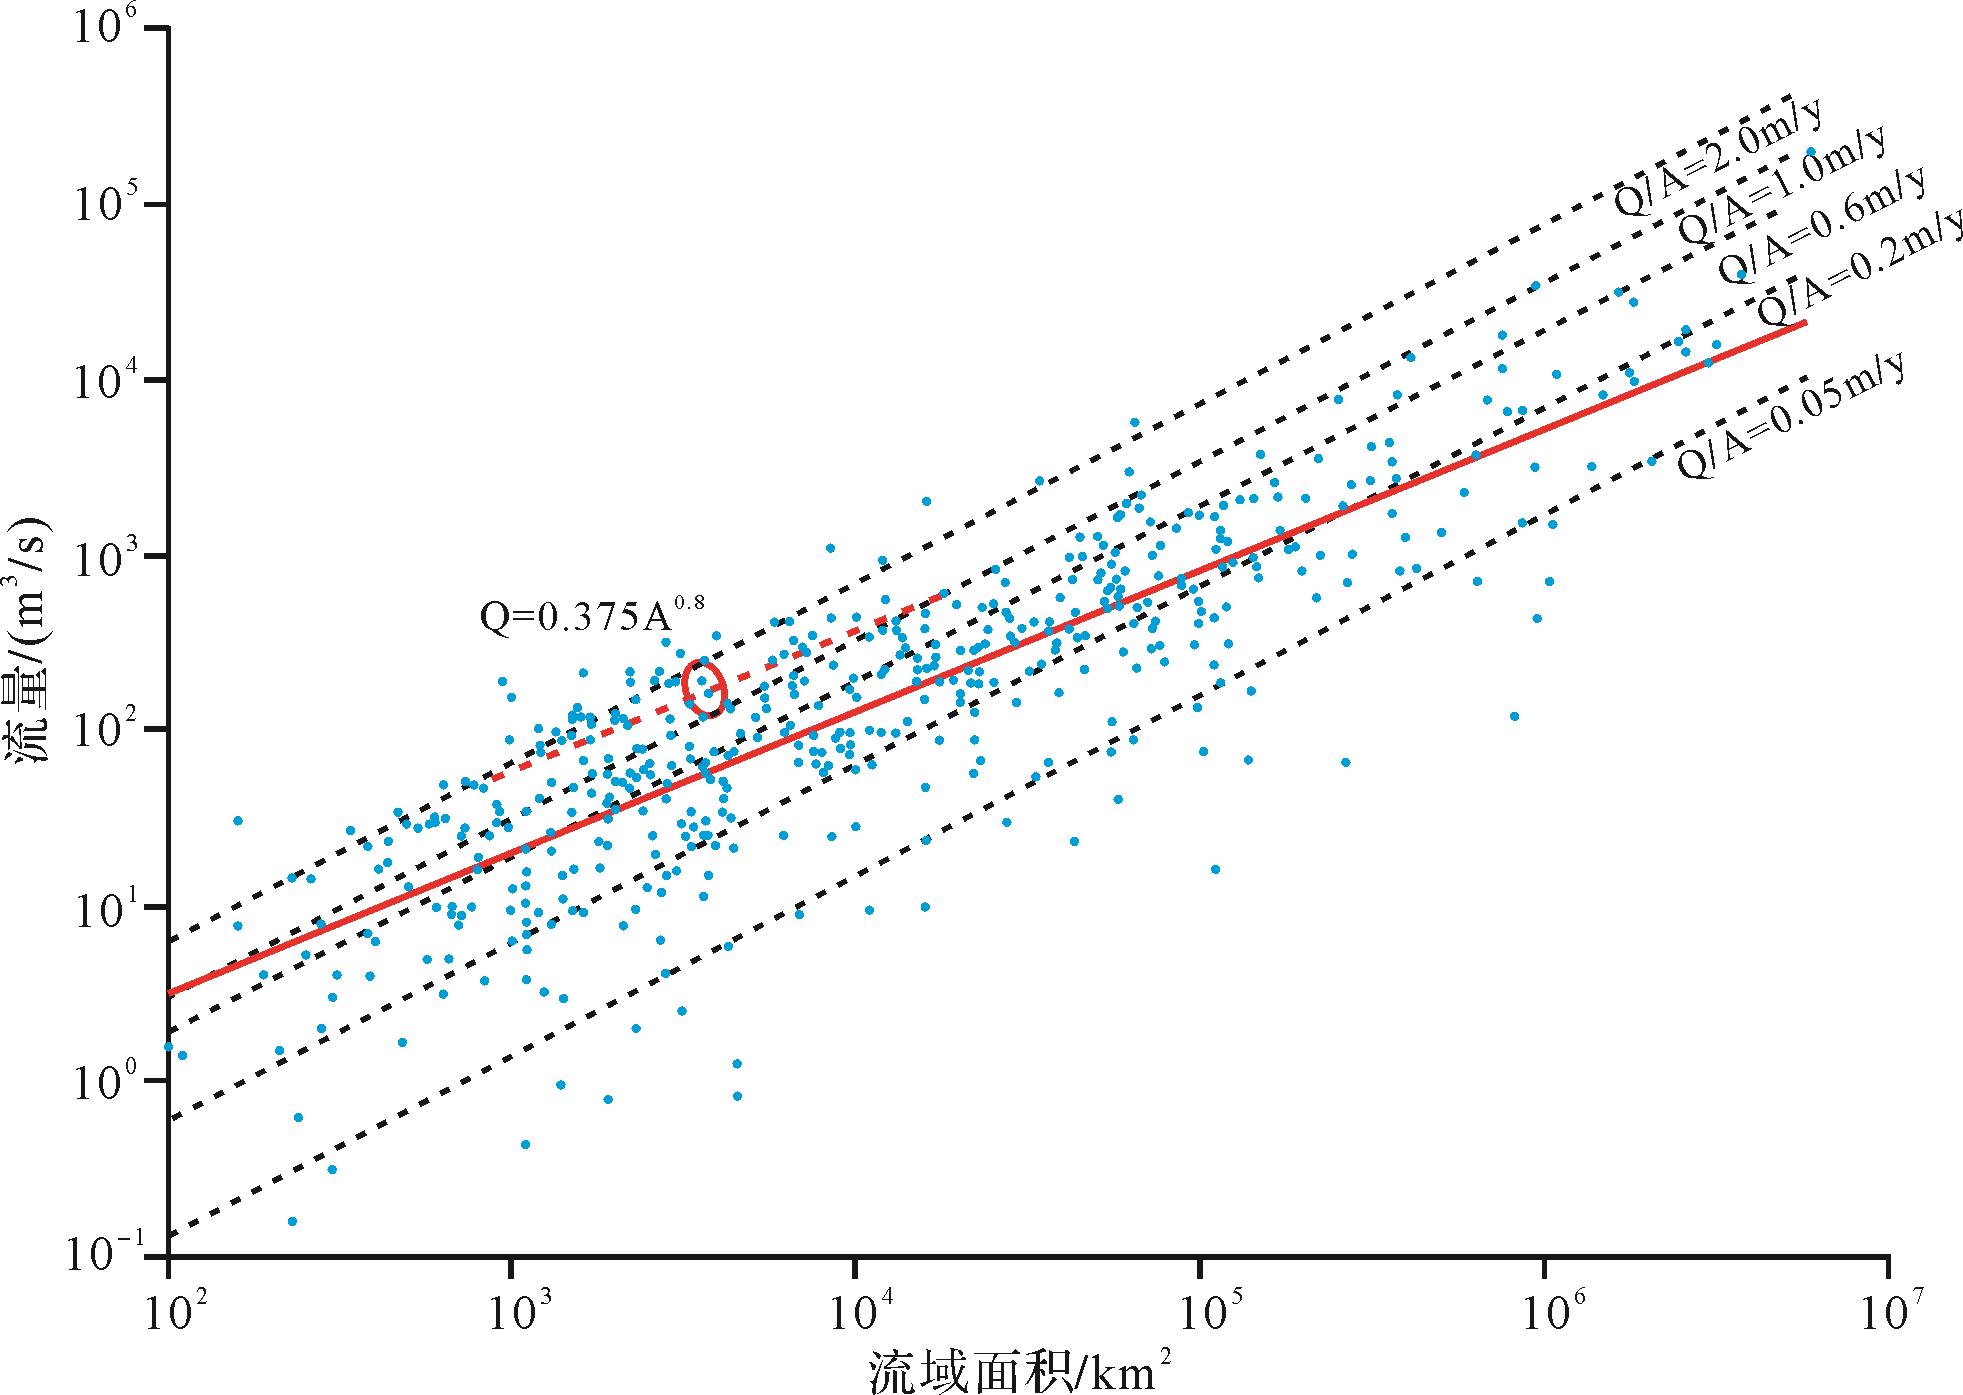
满岸水流量可以通过前面得出的河道尺寸及古坡度进行计算,此外,基于全球河流信息数据库,前人建立了河道厚度、流域面积以及满岸水流量之间的经验比例模型,同样可以作为一种恢复满岸水流量的手段与上述方法相互验证。其中Blum et al.[16]恢复了河道厚度与流域面积之间的比例关系模型(图8),Syvitski et al.[17]根据全球现代河流测量数据建立了不同气候条件下流域面积与满岸水流量之间的比例关系(图9),研究区在中侏罗世层序S2时期处于北纬25°~30°[32],古植物以及孢粉组合显示了温暖潮湿的亚热带古气候[35⁃36,46⁃51],可选择对应的比例关系进行满岸水流量分析。

Figure 8. Global scaling relationship between channel⁃belt thickness and drainage area (after reference [16])

Figure 9. Global scaling relationship between drainage area and discharge (after reference [17])
利用河道尺寸及古坡度恢复满岸水流量的方程[25]如下:
Cf [(Qbf 2)/(Bbf 2Hbf 2)]=gHbf S (5) 式中:Cf 为无量纲Chezy摩擦系数,Cf-1/2=8.32(Hbf /ks )1/6,Qbf 为满岸水流量。
Qtbf =Bbf qtbf =Bbf (R gD 50)1/2αt [ϕsτ *bf 50-τ *c ]nt (6) 式中:qtbf 为单位宽度的推移载荷流量,αt =αEH /Cf,αEH =0.05,nt =2.5,ϕs =1,τ* c =0,公式中相关常数的详细论述可参见Engelund et al.[53]的研究成果。
满岸悬浮载荷流量主要通过van Rijn[45]提出的流程进行恢复,该方法利用推移载荷的粒度分布所评估的夹带阈值,推导出单位河道宽度沿深度上的平均悬浮载荷浓度,共包括13个步骤,利用12个方程来约束最后一个方程中所使用的变量。关于产生这些变量所需步骤的详细说明,请参考文献[45],最终可推导出如下公式:
qs =FvHbf ca (7) Qss =qsBbf (8) 式中:qs 为单位宽度悬浮载荷流量,F为悬浮因子,对给定深度下全水柱浓度进行校正,v为河流流速,ca 为指定深度下悬浮沉积物浓度,Qss 为满岸悬浮载荷流量。
-
上述方法所得出的满岸水流量、推移载荷流量及悬浮载荷流量均为河流满岸时期的瞬时流量,而支点法主要是评估一段地质时期内源—汇系统的收支平衡,而年均沉积物量是计算一段地质时期内河流搬运的沉积物量的前提条件。在现代源—汇系统中,河流沉积物流量能够实时观测,从而容易建立沉积物流量随时间变化的曲线,进而获得年均沉积物量,但这种方法显然无法在深时源—汇系统中实施。Kettner et al.[54]通过数据统计显示年径流量与短期径流量具有一定的关系,但并没有从统计数据中得出具体的径流量预测。Meybeck et al.[55]研究了大量不同流域和类型的河流,评估了其沉积物产量的共同关系。研究的河流普遍显示,每年的总沉积物载荷中有很大一部分是通过短期洪水事件(如满岸事件)所搬运的,这种趋势在小型及干旱型盆地中往往更为明显。在洪水事件中径流量突然增大,持续时间从几天至几周不等,但通常在一周左右[54⁃62]。基于前人对现代河流的大量统计汇编,可得出以下公式[25]:
Qmas =Qtbs ×D /b (9) 式中:Qmas 为年均沉积物量,Qtbs 满岸沉积物流量,D为满岸事件持续的时间,b为每年满岸事件搬运的沉积物量所占的比例。结合研究区的古气候分析,与现代类似物进行对比,可以对满岸事件持续的时间以及搬运沉积物量所占的比例评估。
-
基于大数据分析绘制了柴北缘鱼卡地区的各种单因素等值线图,综合详细的沉积环境分析与物源分析,完成了鱼卡地区中侏罗世等时层序地层格架下的古地理重建(图1),因而层序S2沉积区的沉积物体积得到了良好的约束。通过GIS软件对鱼卡地区层序S2的地层等厚线图进行矢量化(图10),可统计累计的沉积物体积。本次研究的支点主要位于河流沉积体系的干流河道,其下游沉积区主要包括三角洲以及湖泊沉积体系(图1),鱼卡地区半深湖环境的细粒沉积主要为深水原地沉积,受河流搬运的沉积物影响很小,因此统计的地层等厚线范围主要覆盖了三角洲以及滨浅湖沉积体系。将支点下游沉积区统计的沉积物体积与古水力学方程所计算出的河流累计搬运的沉积物体积进行对比,即可得出柴北缘鱼卡地区层序S2的源—汇系统收支状况。

Figure 10. Isopachs for sequence S2 in Yuqia area, northern Qaidam Basin
-
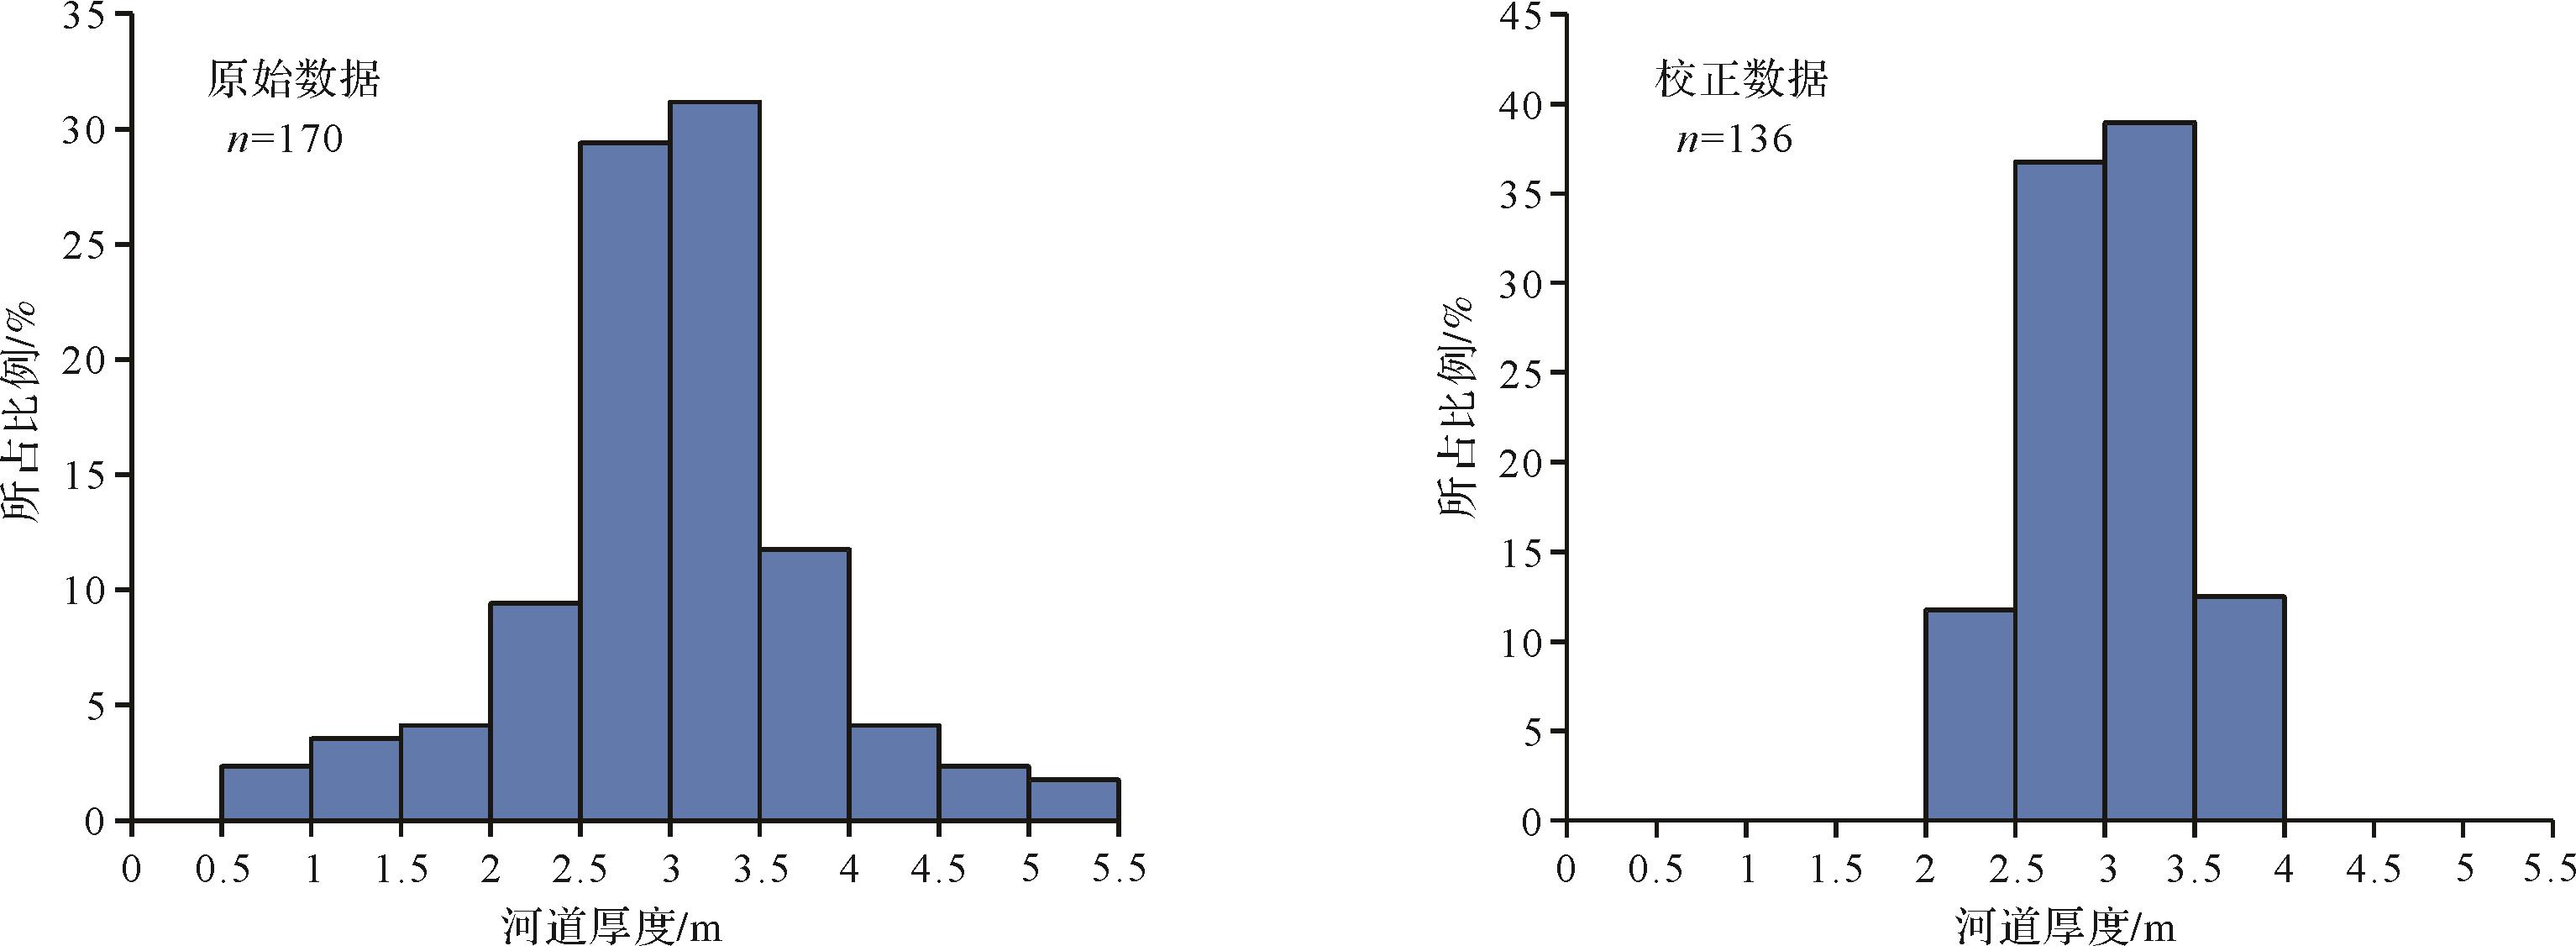
近年来野外实测的露头剖面、实地编录描述的钻孔岩心以及在生产单位现场收集的第一手钻孔岩心与测井资料,构成了本次鱼卡地区源—汇系统收支分析的数据库,为源—汇系统各组成部分的相关参数恢复提供了有力保障。本次共测量170个河道厚度数据,厚度范围介于0.6~5.1 m,并呈较为明显的正态分布的特征(图11)。一般来讲,厚度最小的10%的数据代表了干流河道周边的支流河道或者下游的三角洲分流河道,而厚度最大的10%的数据代表了未能识别并提出的多层叠置的河道[22]。为了排除这些异常值对真实干流河道厚度测量的干扰,选取其余较为集中分布的80%的河道厚度数据进行分析。经过校正后的数据在2.3~3.5 m之间,平均厚度为3 m(图11),考虑到沉积后的压实作用,将实测的河道厚度提高10%来作为满岸深度即为3.3 m。

Figure 11. Trunk channel thickness histograms for sequence S2 in Yuqia area, northern Qaidam Basin
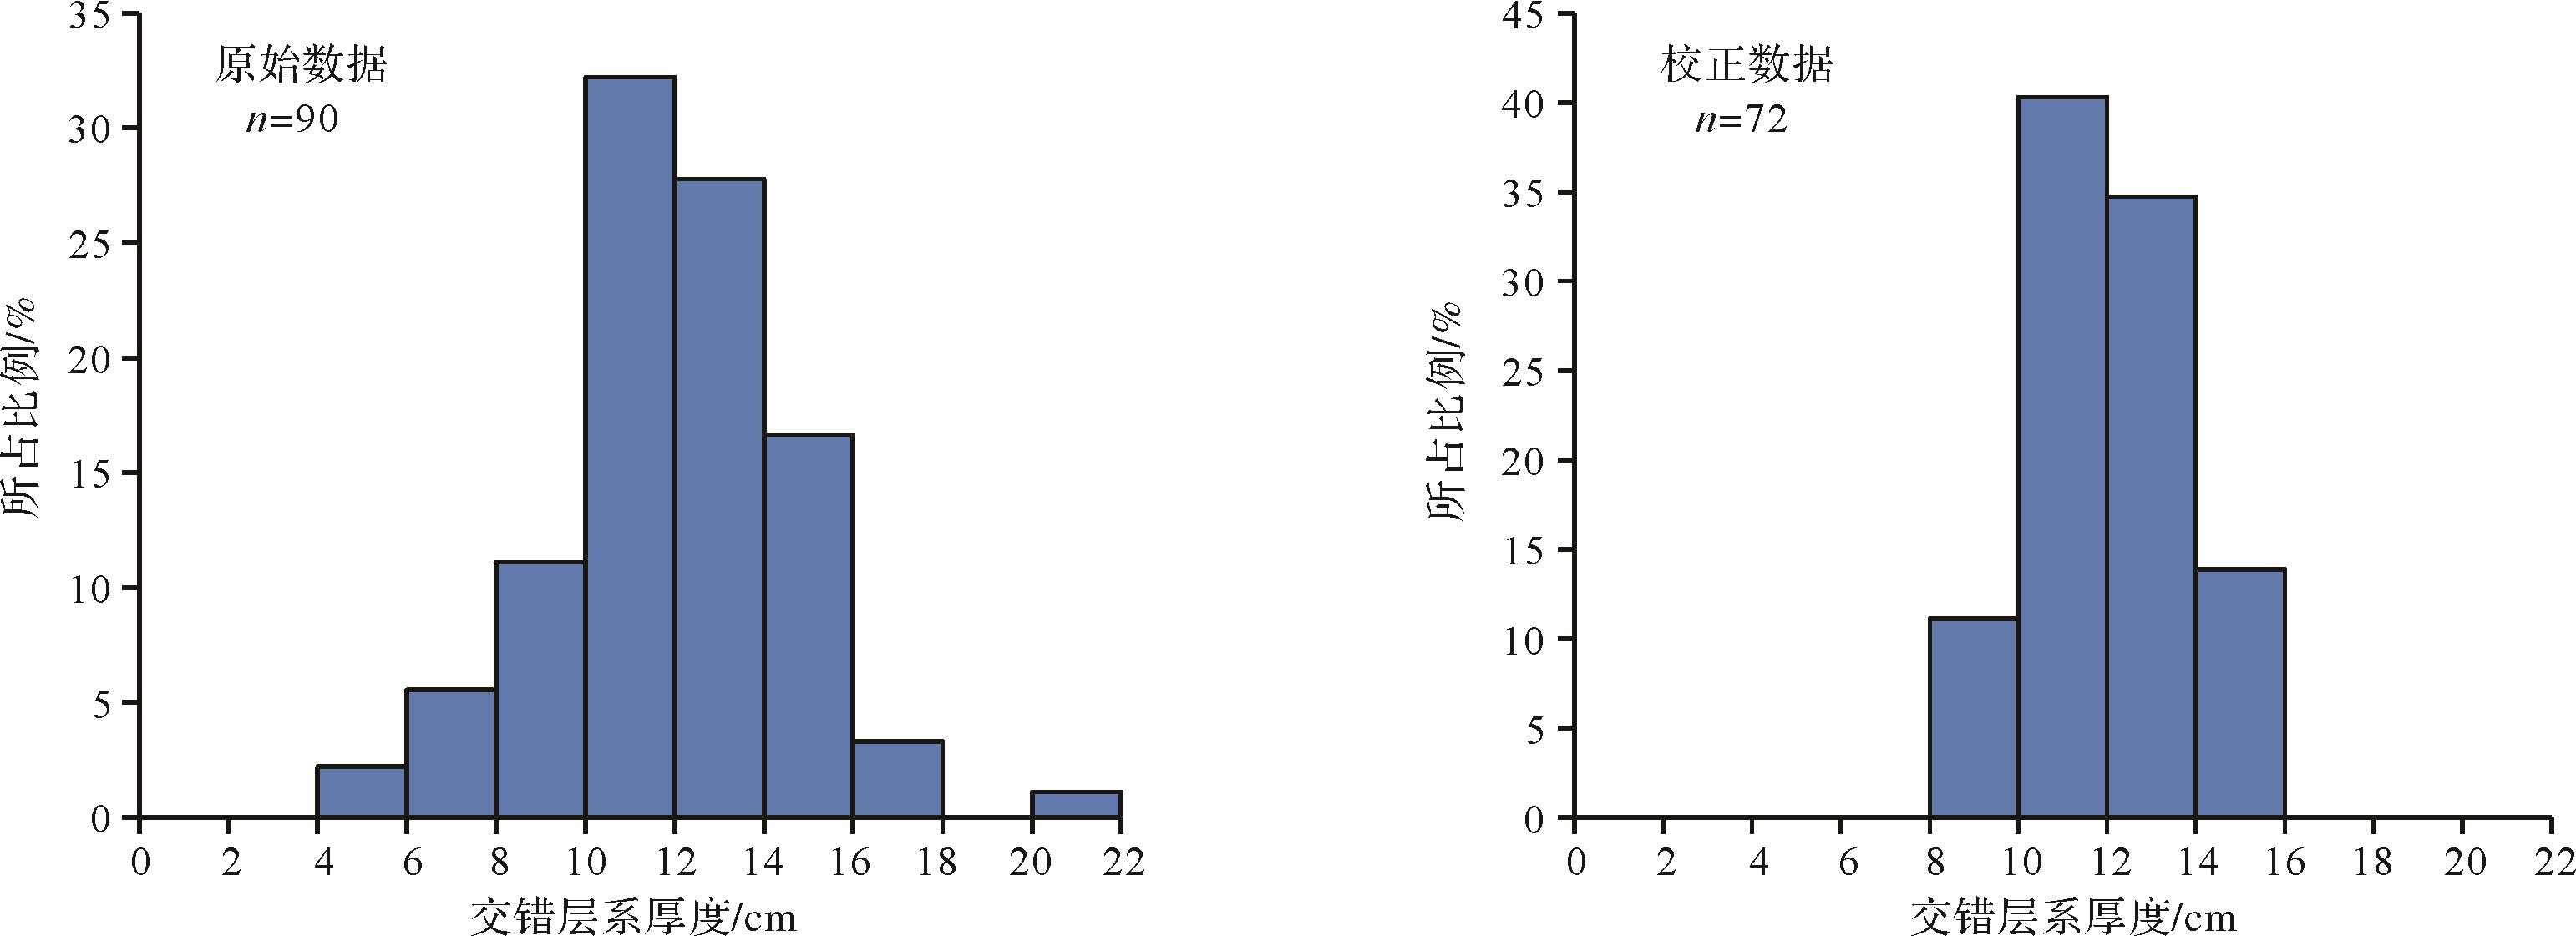
此外,在野外露头独立测量了90个交错层系(cross-bed set)厚度数据,采取了与河道厚度相同的方法对其进行校正,显示厚度在9~14 cm之间,平均值为13 cm(图12)。较为集中的交错层系厚度表明侧向迁移的沙丘在形成交错层理过程中未发生较大的变化,通过公式(1)可计算出交错层系对应的沙丘平均高度为0.38 m,根据前人的研究成果[25,39]将其扩大8倍获得平均满岸深度为3.1 m,与直接测量河道厚度恢复的满岸深度十分接近。两种独立的满岸深度恢复方法的相互验证,保证了本次满岸深度数据的准确性,可认为其介于3.1~3.3 m。

Figure 12. Histograms for distribution of cross⁃bed set thickness in sequence S2, Yuqia area, northern Qaidam Basin
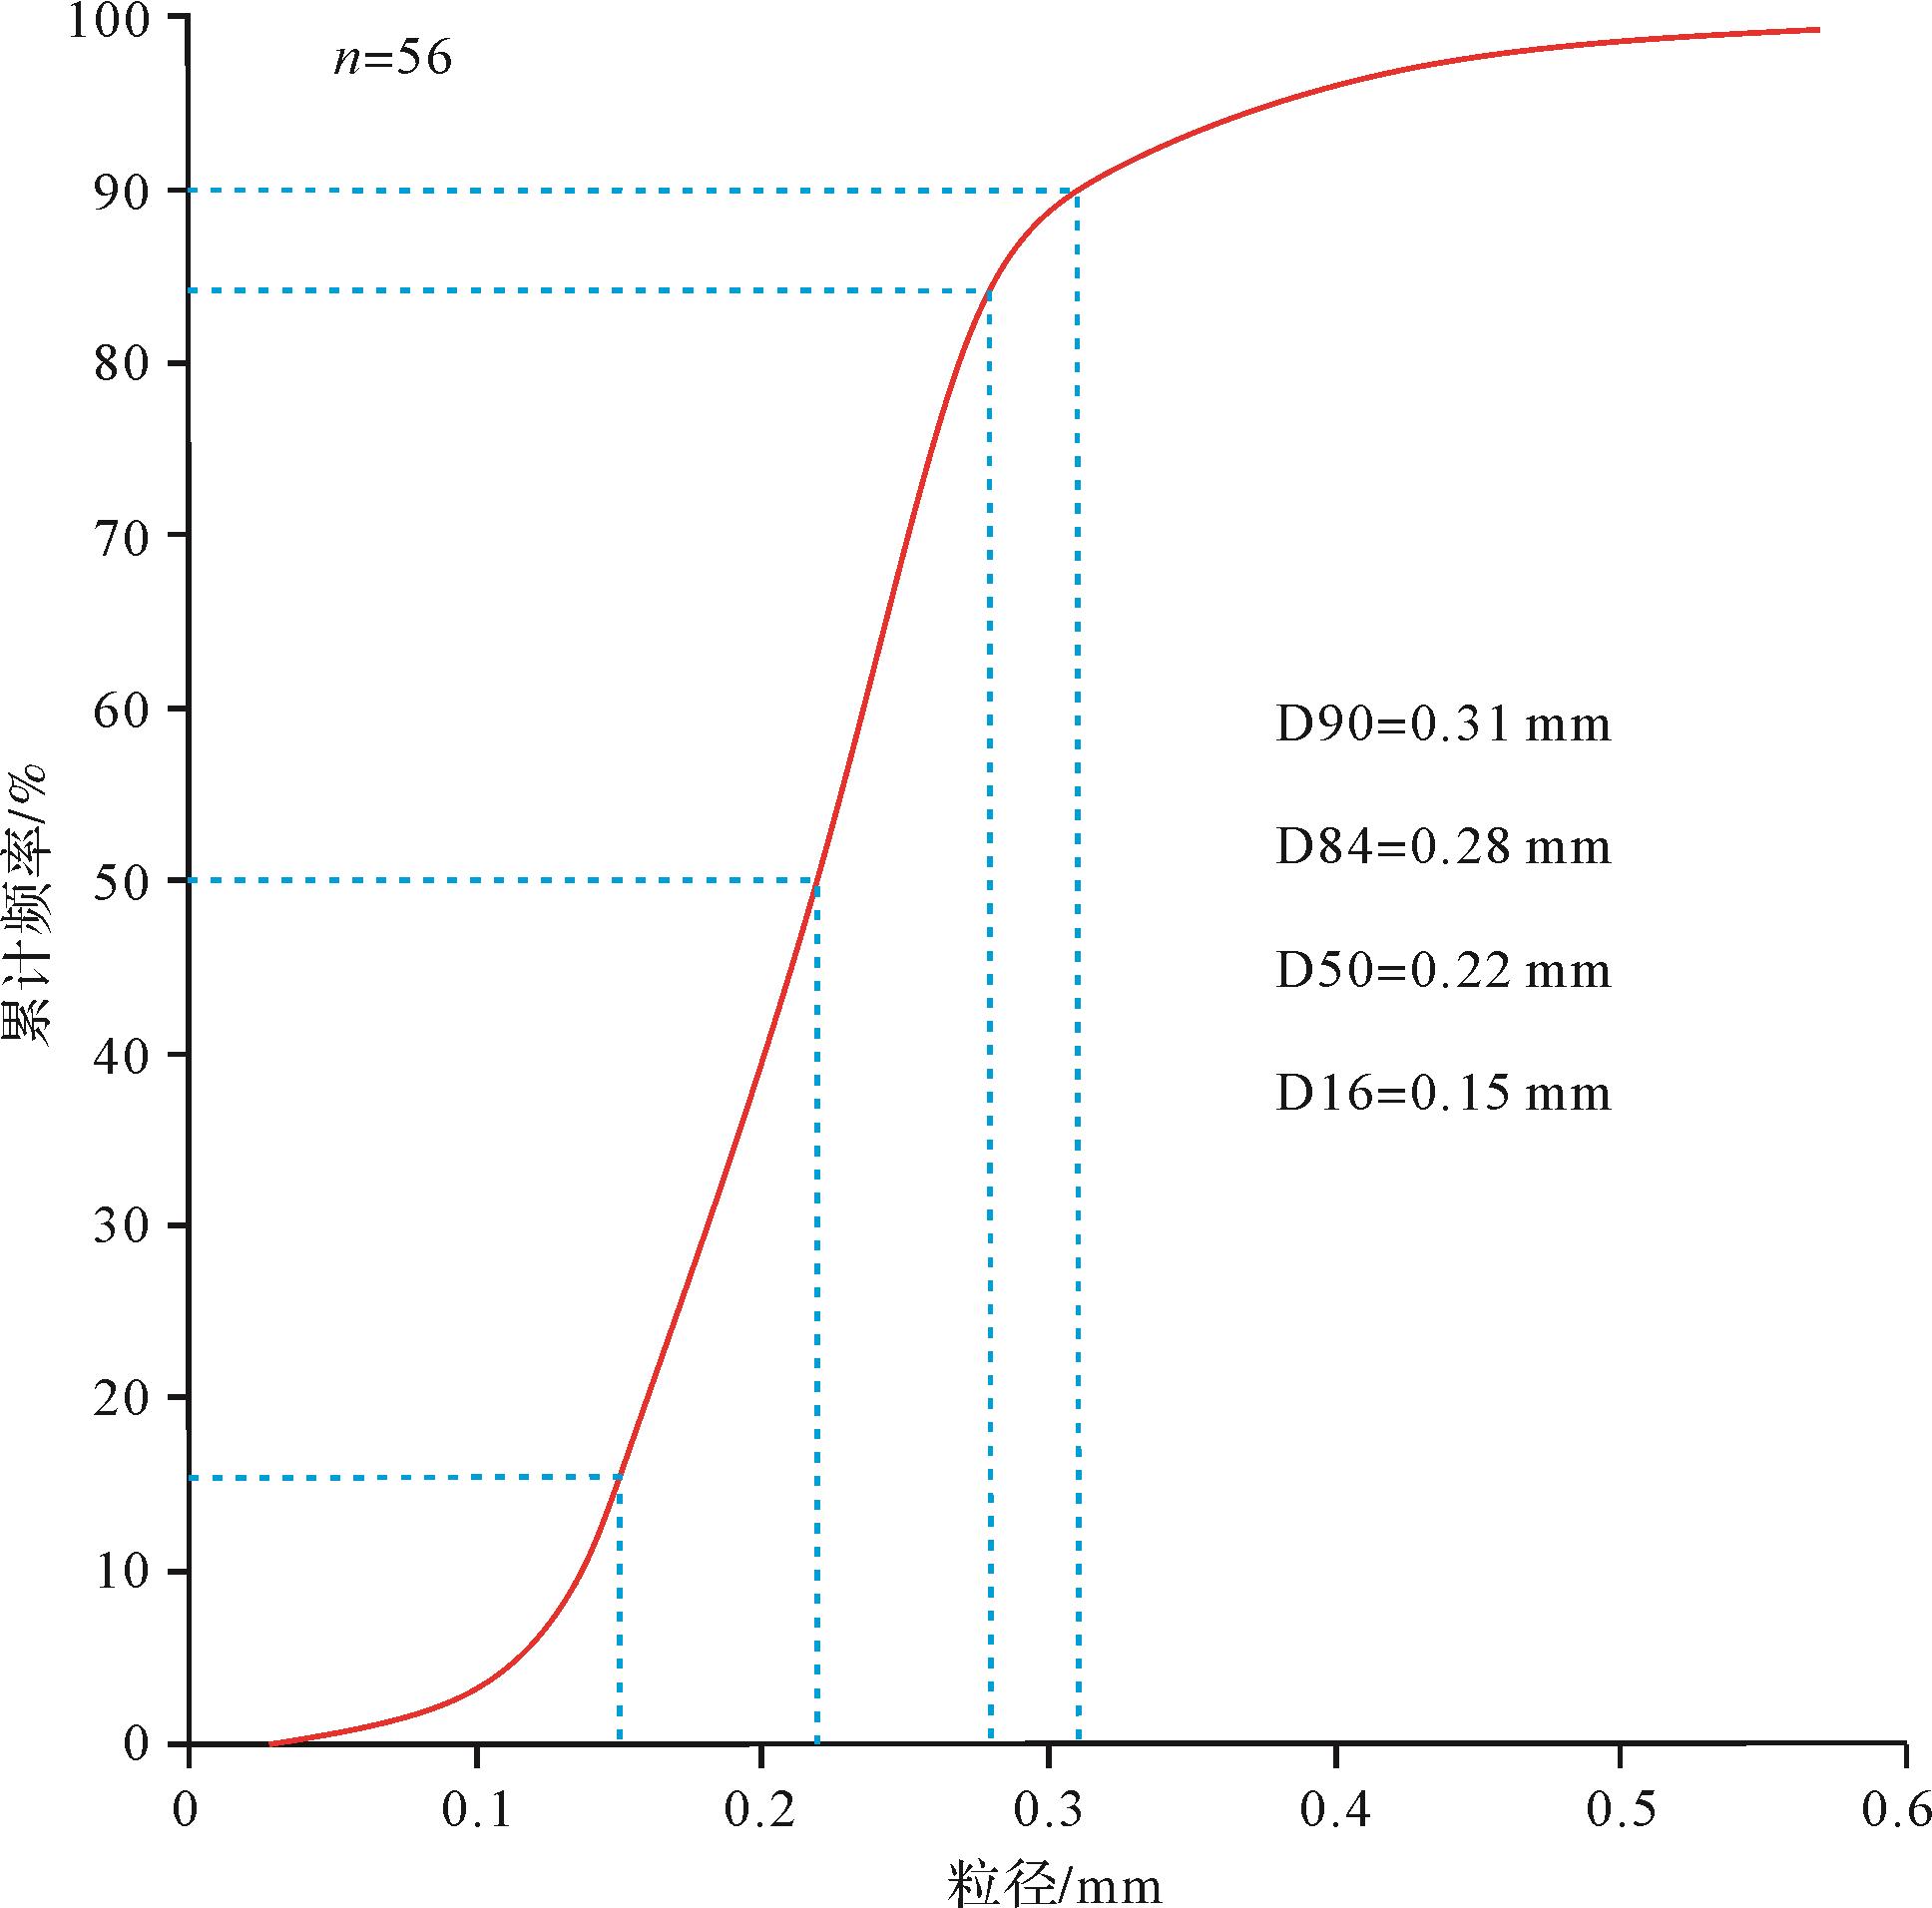
基于上述恢复的满岸深度数据,通过公式(2)可以评估柴北缘鱼卡地区层序S2的干流河道宽度,结果显示河道宽度主体介于69~77 m,平均值为73 m。依据柴北缘鱼卡地区层序S2的干流河道砂岩薄片粒度分析结果,绘制了粒度累计曲线,从而获得了沉积物粒度分布的总体趋势,关键粒径分布系列D16、D50、D84、D90分别为0.15 mm、0.22 mm、0.28 mm与0.31 mm(图13)。整体来看,细砂岩与中砂岩占比较高,粒径中值D50属于细砂岩范畴,砂岩成分成熟度与结构成熟度均较高。

Figure 13. Sediment grain⁃size distribution in sequence S2, Yuqia area, northern Qaidam Basin
-
柴北缘中侏罗世层序S2时期处于坳陷盆地演化阶段,整体沉降较为稳定,与早侏罗世相比曲流河与曲流河三角洲沉积体系明显增多,表明此时坡度应整体较缓。基于河道尺寸参数,应用公式(3)获得鱼卡地区层序S2时期的古坡度介于0.000 204 6~0.000 217 8,均值为0.000 211,中细砂为主的河道沉积也与该较缓的古坡度相对应。
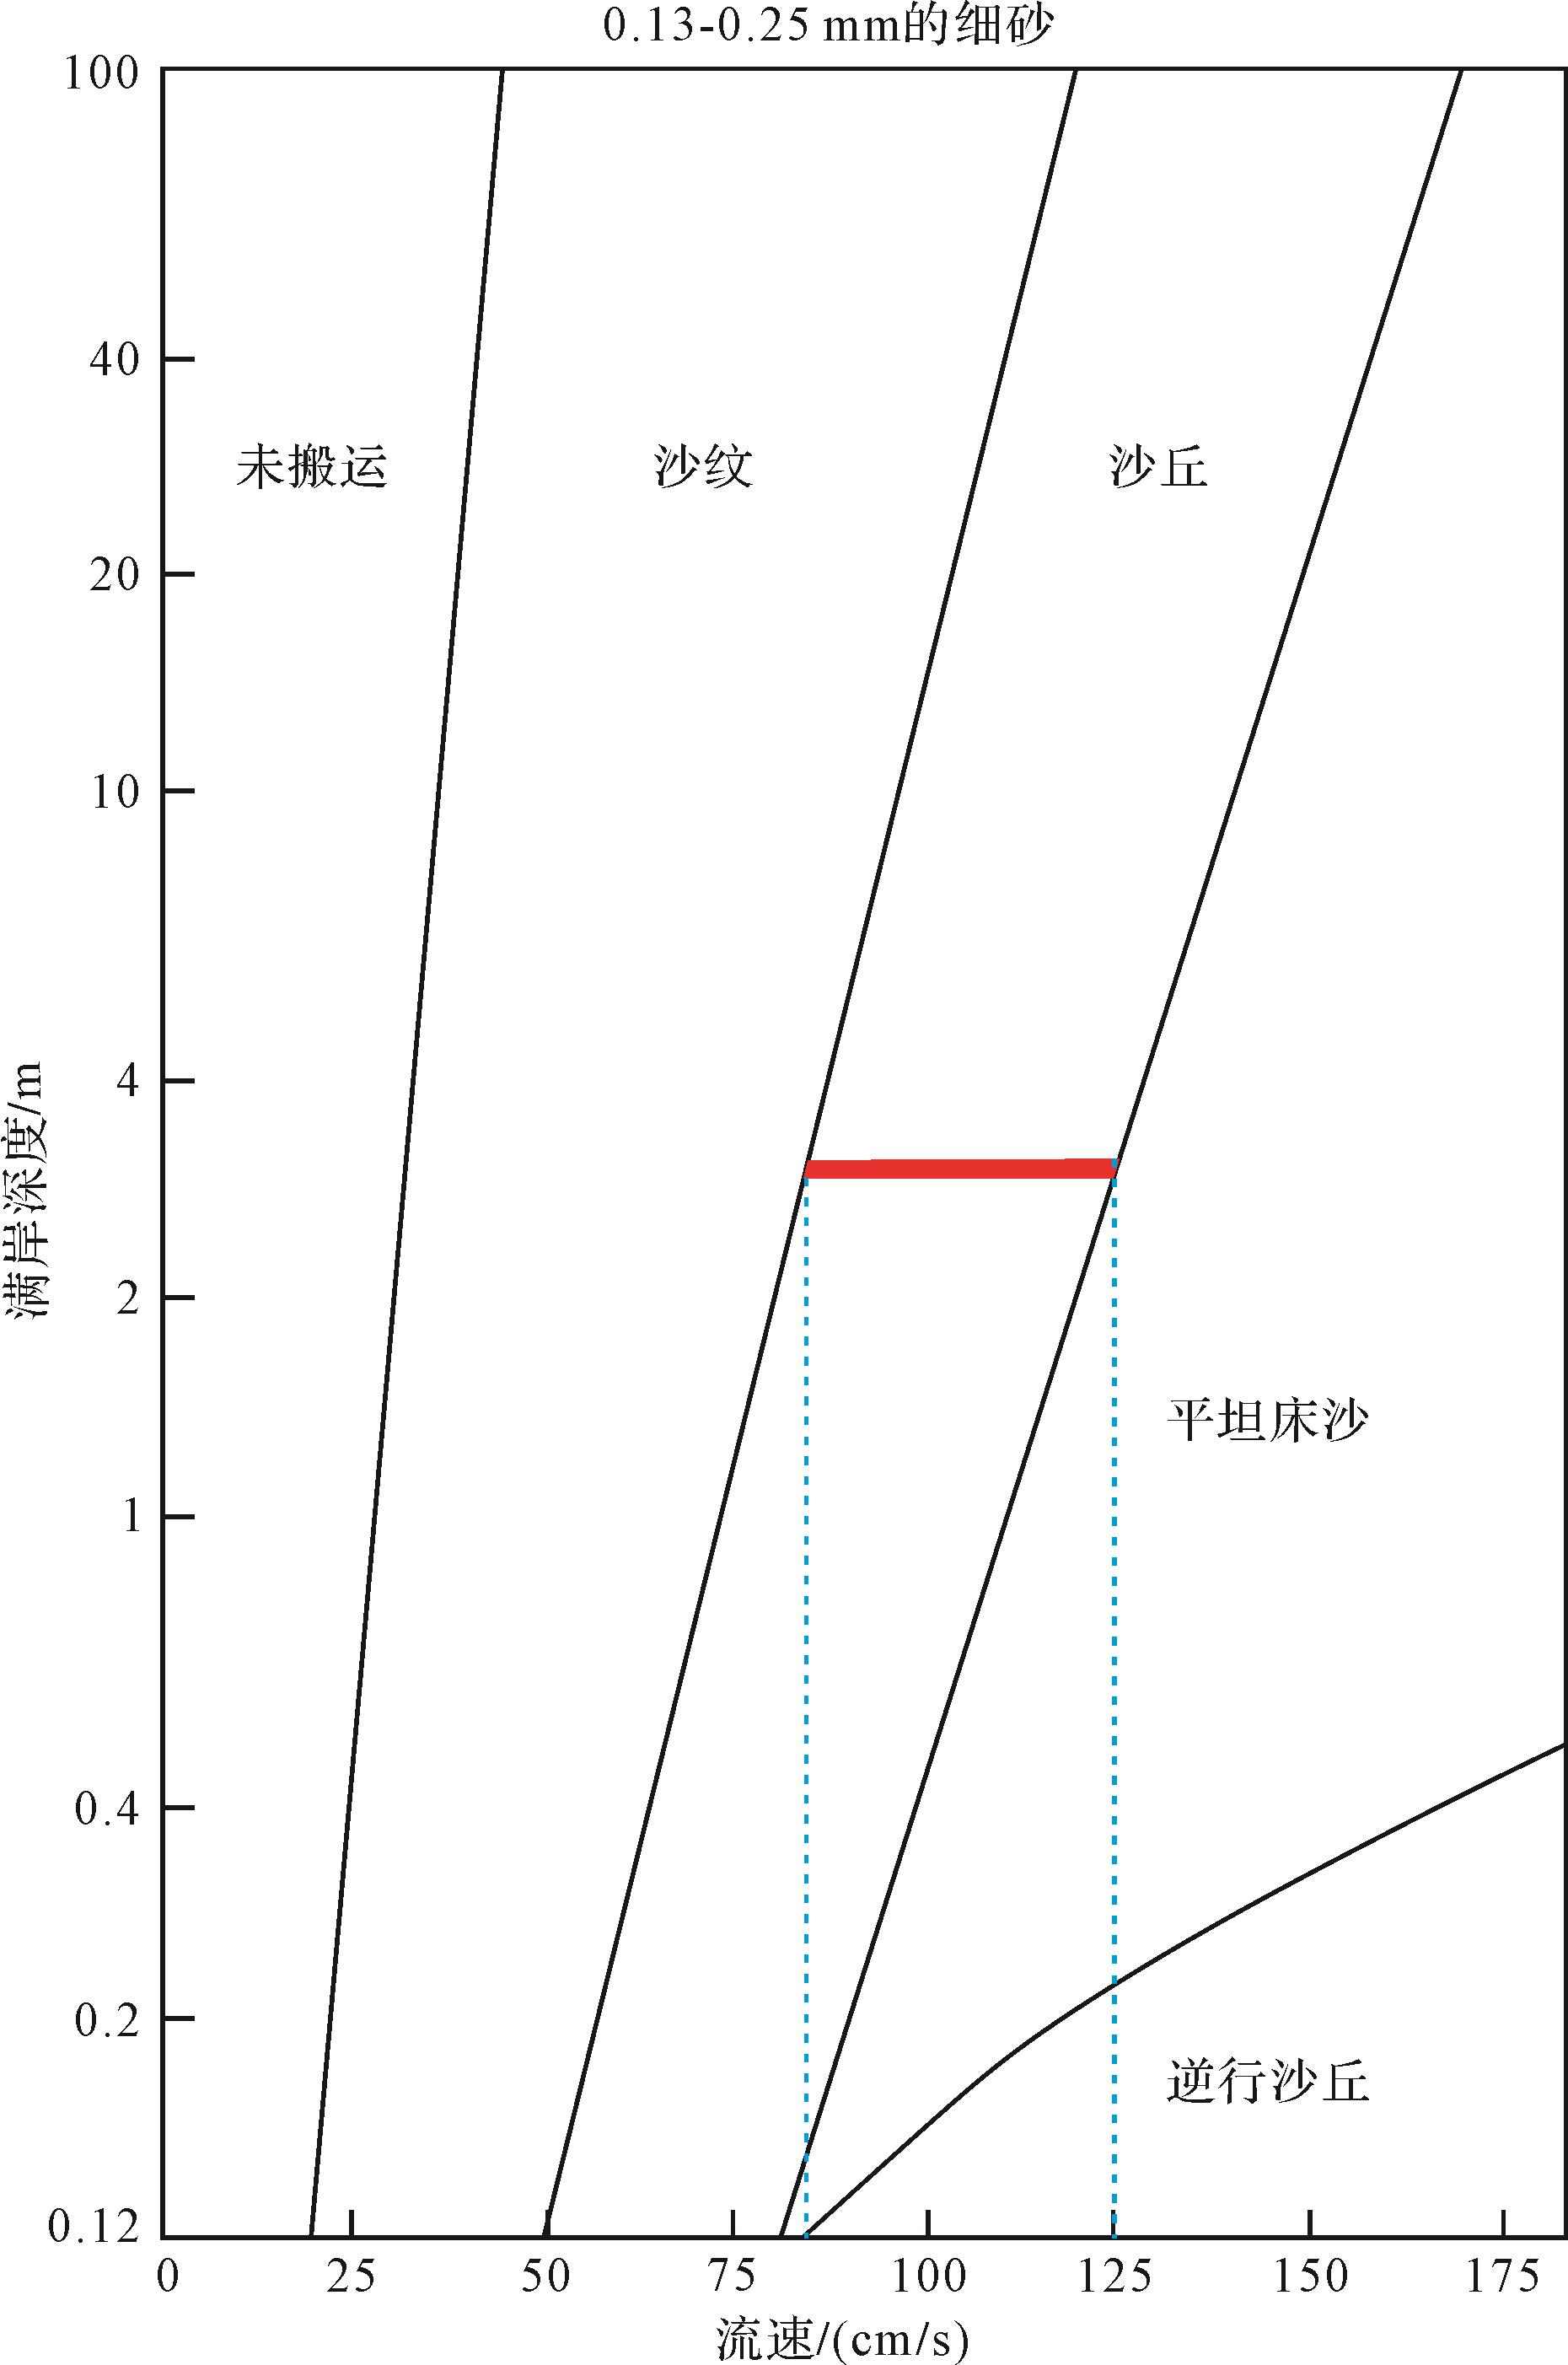
河流流速是河床剪切应力的函数,主要由坡度和水流深度决定。基于Chezy系数、水力半径和古坡度,通过公式(4)可以计算出河流流速范围,主要集中在1.046~1.048 m/s,平均流速为1.047 m/s。此外,流速也可以利用Rubin et al.[44]建立的底床形态相位图进行分析,从而提供了一种独立验证公式(4)计算结果准确性的方式。底床形态主要受流速、流动深度和颗粒大小的影响,沙丘尺度的交错层理是鱼卡地区钻孔岩心和露头剖面中最常见的沉积构造,而高流态的底床形态(如平坦床沙与逆行沙丘)则未被观察到。根据满岸深度、砂岩粒度以及底床形态三个参数,从底床形态相位图中可获得流速范围为0.85~1.25 m/s(图14)。由公式(4)计算出的流速(1.047 m/s)落入底床形态相位图得出的速度范围内,且大致处于中间的位置,因此两种独立评估水流速度的结果相互印证。

Figure 14. Bedform phase plot illustrating correlation between flow velocity and flow depth for various bedforms(after reference [44])
利用恢复的河道尺寸及古坡度,通过公式(5)可进行满岸水流量评估,结果显示满岸水流量介于239.9~286.2 m3/s,均值为262.4 m3/s。与此同时,基于前人建立的全球河道厚度、流域面积以及满岸水流量之间的经验比例模型,同样可以对满岸水流量进行分析。通过Blum et al.[16]建立的河道厚度与流域面积之间的比例关系模型(图8),可获得研究区干流河道对应的流域面积为3 209.8~3 781.6 km2,依据层序S2时期温暖潮湿的亚热带古气候条件,选取Syvitski et al.[17]建立的对应流域面积与满岸水流量之间的比例关系(图9),显示满岸水流量为239.4~273 m3/s,与公式(5)得出的满岸水流量范围十分接近,在误差范围内可认为两种独立的计算方法获得了基本一致的结果。
鱼卡地区北部山前地带地层因后期构造抬升,遭受剥蚀而未保存下来,因而相对于下游沉积区,其物源区与上游搬运区所知的信息甚少。研究区干流河道对应的流域面积范围对于源—汇系统重建十分重要,Sømme et al.[4]曾指出河流系统的最大长度与流域面积具有明显的正相关性,但在“深时”系统中河流长度的测量十分困难。在一定程度上,流域盆地长度可代表河流系统的最大长度,对于一般树枝状的对称流域,其长度可通过以下公式来评估[67]:
L =1.4(DA )0.6(10) 式中:L为流域长度,DA为流域面积。
基于已恢复的流域面积,通过公式(10)可得出流域长度介于177.8~196.2 km,均值为187 km。这表明鱼卡地区河流下游入湖处至当时北部物源区祁连山的距离接近200 km,远大于现今祁连山与鱼卡地区的距离,前文物源分析也显示层序S2时期鱼卡地区碎屑组分具有远源沉积的特点。
利用公式(6),将河道宽度乘以单位宽度的推移载荷流量,估算出满岸推移载荷流量为0.043~0.048 m3/s,平均值为0.046 m3/s。基于公式(8),满岸悬浮载荷流量由单位宽度悬浮载荷流量乘以河道宽度来进行评价,得出其范围为0.083~0.094 m3/s,平均值为0.088 m3/s(表1)。
满岸深度/m 河道宽度/m 粒度(D16,D50,D84,D90)/mm 坡度 流速/(m/s) 流域面积/km2 低值 3.1 69 0.15,0.220.28,0.31 0.000 204 6 1.046 3 209.8 均值 3.2 73 0.000 211 0 1.047 3 488.9 高值 3.3 77 0.000 217 8 1.048 3 781.6 流域长度/km 满岸水流量/(m3/s) 推移载荷流量/(m3/s) 悬浮载荷流量/(m3/s) 年均沉积物量/m3 累计沉积物量/km3 低值 177.8 239.9 0.043 0.083 158 862.4 349.5 均值 187 262.4 0.046 0.088 168 909.8 371.6 高值 196.2 286.2 0.048 0.094 179 242.3 394.3
-
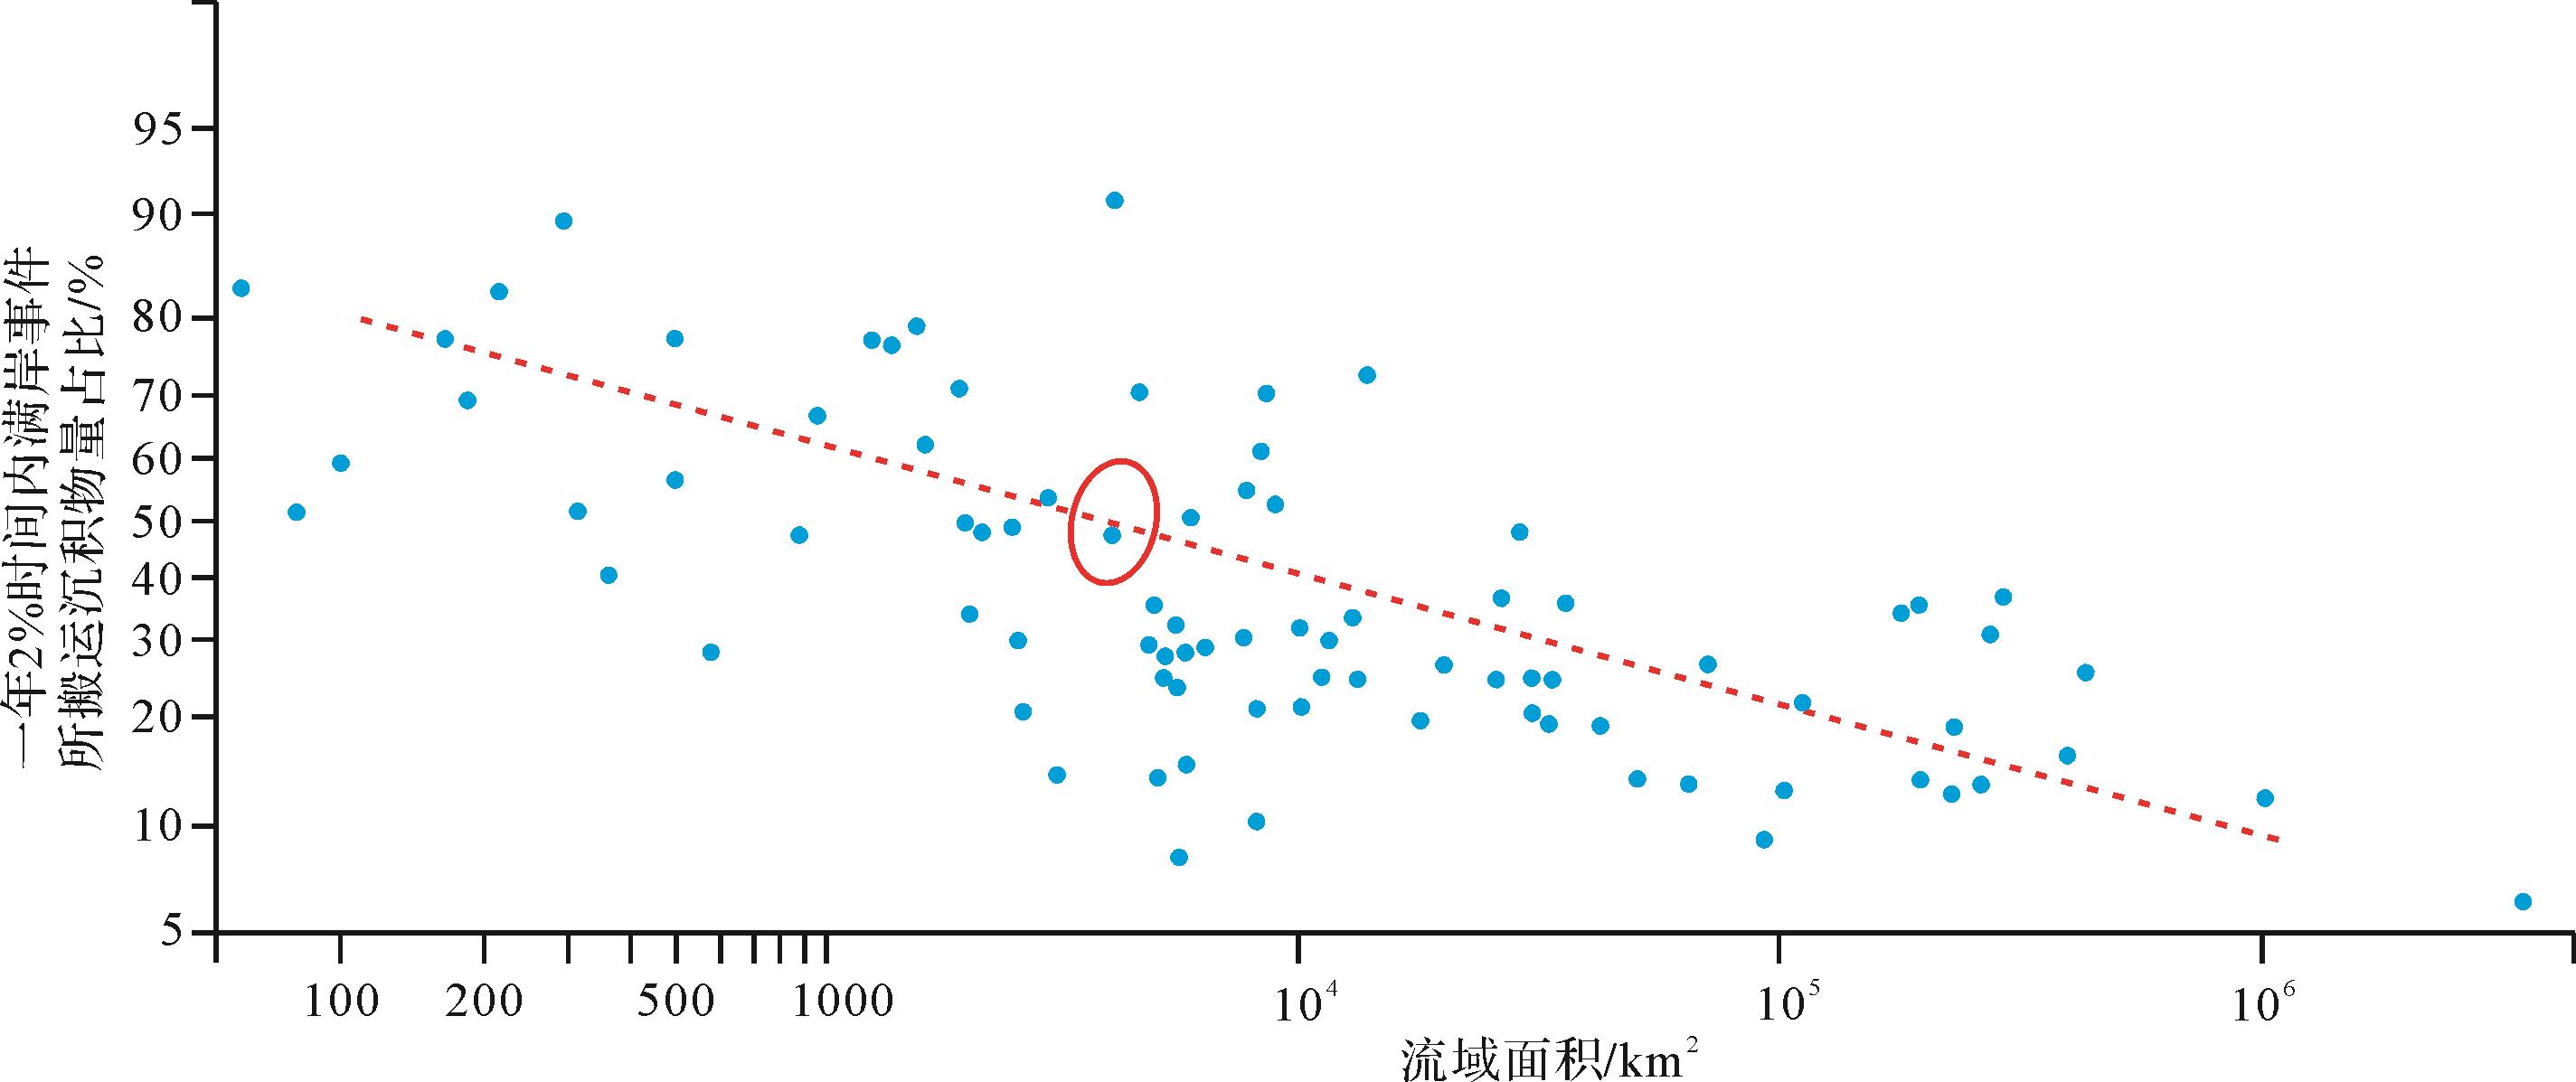
上面讨论的公式和方法推导出的推移载荷和悬浮载荷流量主要用来评估每秒通过河流截面的沉积物体积,定义为瞬时流量速率。这一速率有效地表征了底床形态迁移时的水流条件,主要用于反映河流满岸阶段的状态。然而,支点法的目的是在更长的地质时间内量化物质平衡,为了评估某一地质时期的总沉积物体积,首先需要获得年均沉积物量和对应的沉积持续时间。Meybeck et al.[55]综合不同地区和气候条件下的全球河流数据,讨论了沉积物流量变化和满岸洪水持续时间。研究表明,满岸事件持续时间一般占全年2%(7.3天),这2%时间内的满岸事件沉积物输入量,在总输入量中的占比与流域面积具有一定的关系[55]。鱼卡地区层序S2时期流域面积为3 209.8~3 781.6 km2,显示其干流在每年2%时间内的沉积物输入量约占总输入量的50%(图15)。通过公式(9)可获得年均沉积物量介于158 862.4~179 242.3 m3,均值为168 909.8 m3,其中年均推移载荷量为54 408.2~60 972.8 m3,悬浮载荷量为104 454.1~118 269.5 m3。

Figure 15. Percentage of total suspended solids discharged from cross⁃sections of rivers with differing drainage area and climate (after reference [55])
河流输送的累计沉积物量可通过年均沉积物量乘以所持续的时间进行恢复,其中年均沉积物量已通过水力学方法获得,层序S2所持续的时间则主要基于前文详细的层序地层学分析。结合柴北缘古生物及孢粉组合为代表的生物地层研究成果[35⁃36,46⁃51],层序S2对应于中侏罗统巴通阶,持续时间约为2.2 Ma。因而累计沉积物量范围介于349.5~394.3 km3,平均值为371.6 km3(表1)。
-
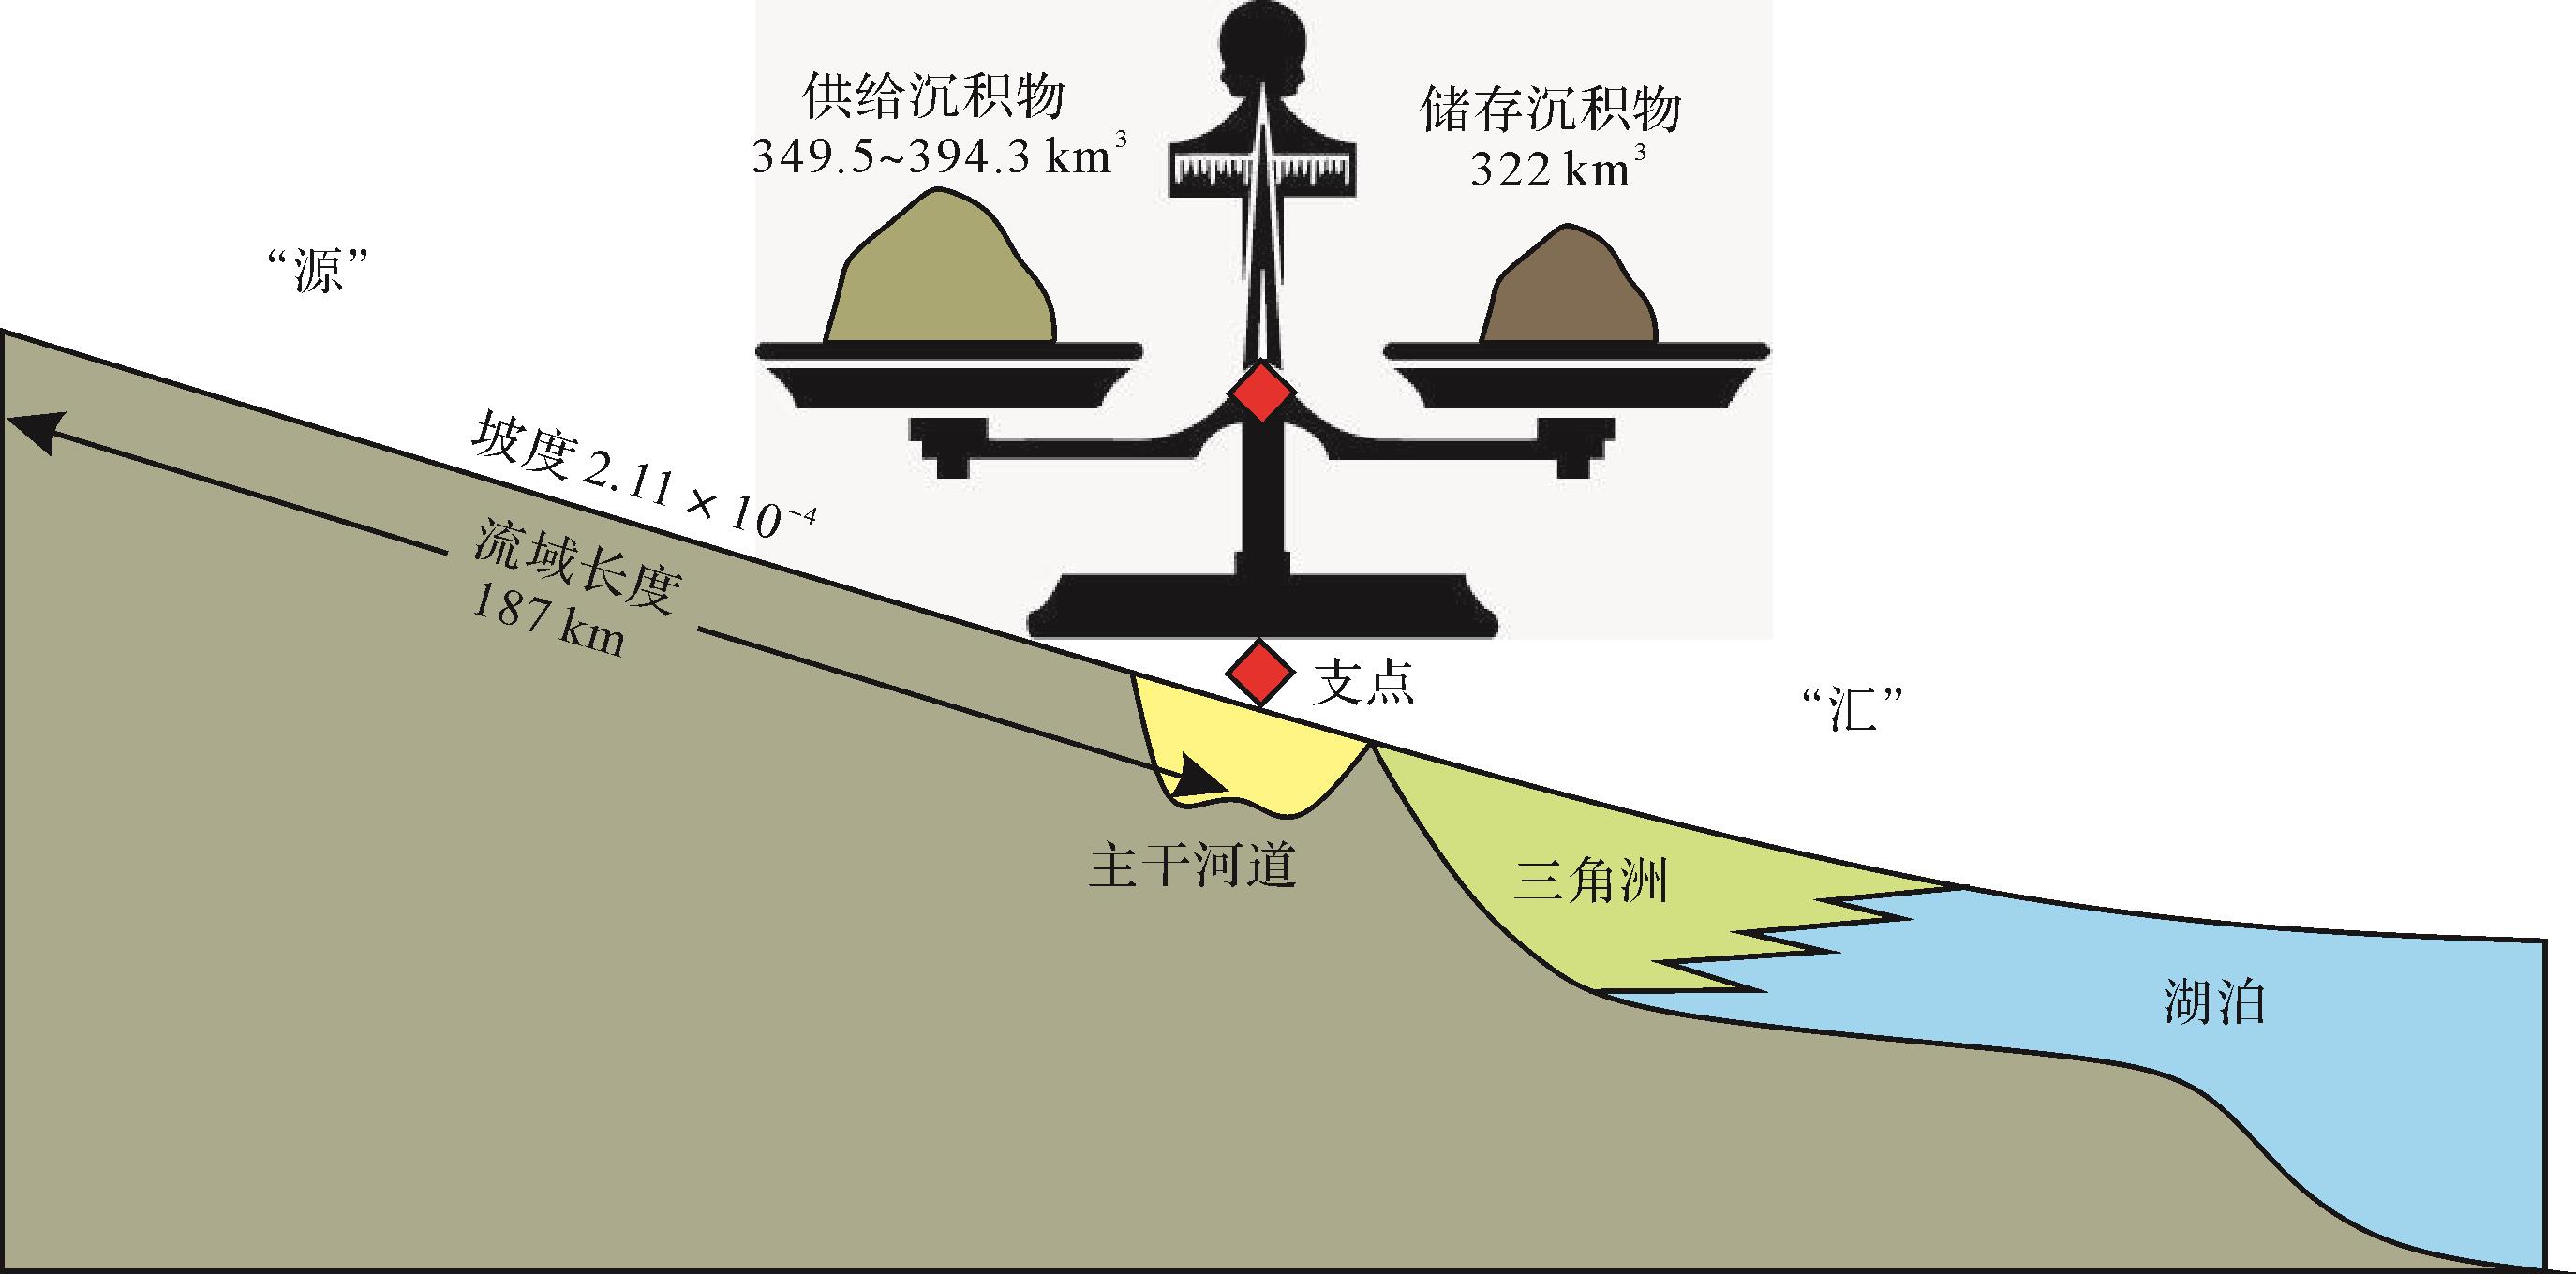
柴北缘鱼卡地区层序S2时期源—汇系统的收支状况,可以通过古水力学方程所计算出的河流累计搬运的沉积物体积与支点下游沉积区的沉积物体积来进行评估。沉积区的沉积物体积可以利用地层等厚线图统计(图10),本次重建的古地理图良好地约束了层序S2不同沉积单元的沉积物体积展布特征(图1)。支点下游三角洲以及滨浅湖沉积体系的沉积物主要由干流河道提供,统计结果显示体积约为290 km3,考虑到一般为10 %的后期沉积体积压实系数[25],原始未经压缩的体积应约为322 km3。通过古水力学方程所计算出的河流累计搬运的沉积物体积为349.5~394.3 km3,两种方式得出的结果处于同一数量级,但古水力学方程恢复的体积整体高于沉积区统计的体积,约为其1.09~1.22倍。在一定的误差范围内,可认为柴北缘鱼卡地区层序S2时期源—汇系统的收支大致处于平衡状态(图16),接下来可进一步探讨河流沉积物输入量大于对应沉积区沉积物量这一结果的原因。

Figure 16. Cross⁃section of S2S system and mass⁃balance diagram of S2 sequence,Yuqia area, northern Qaidam Basin
-
上述研究结果显示古水力学方程得出的河流沉积物输入体积的高值约为支点下游沉积区统计体积的1.22倍,如果这一分析结果准确,则表明存在一定程度的沉积物遗失现象。
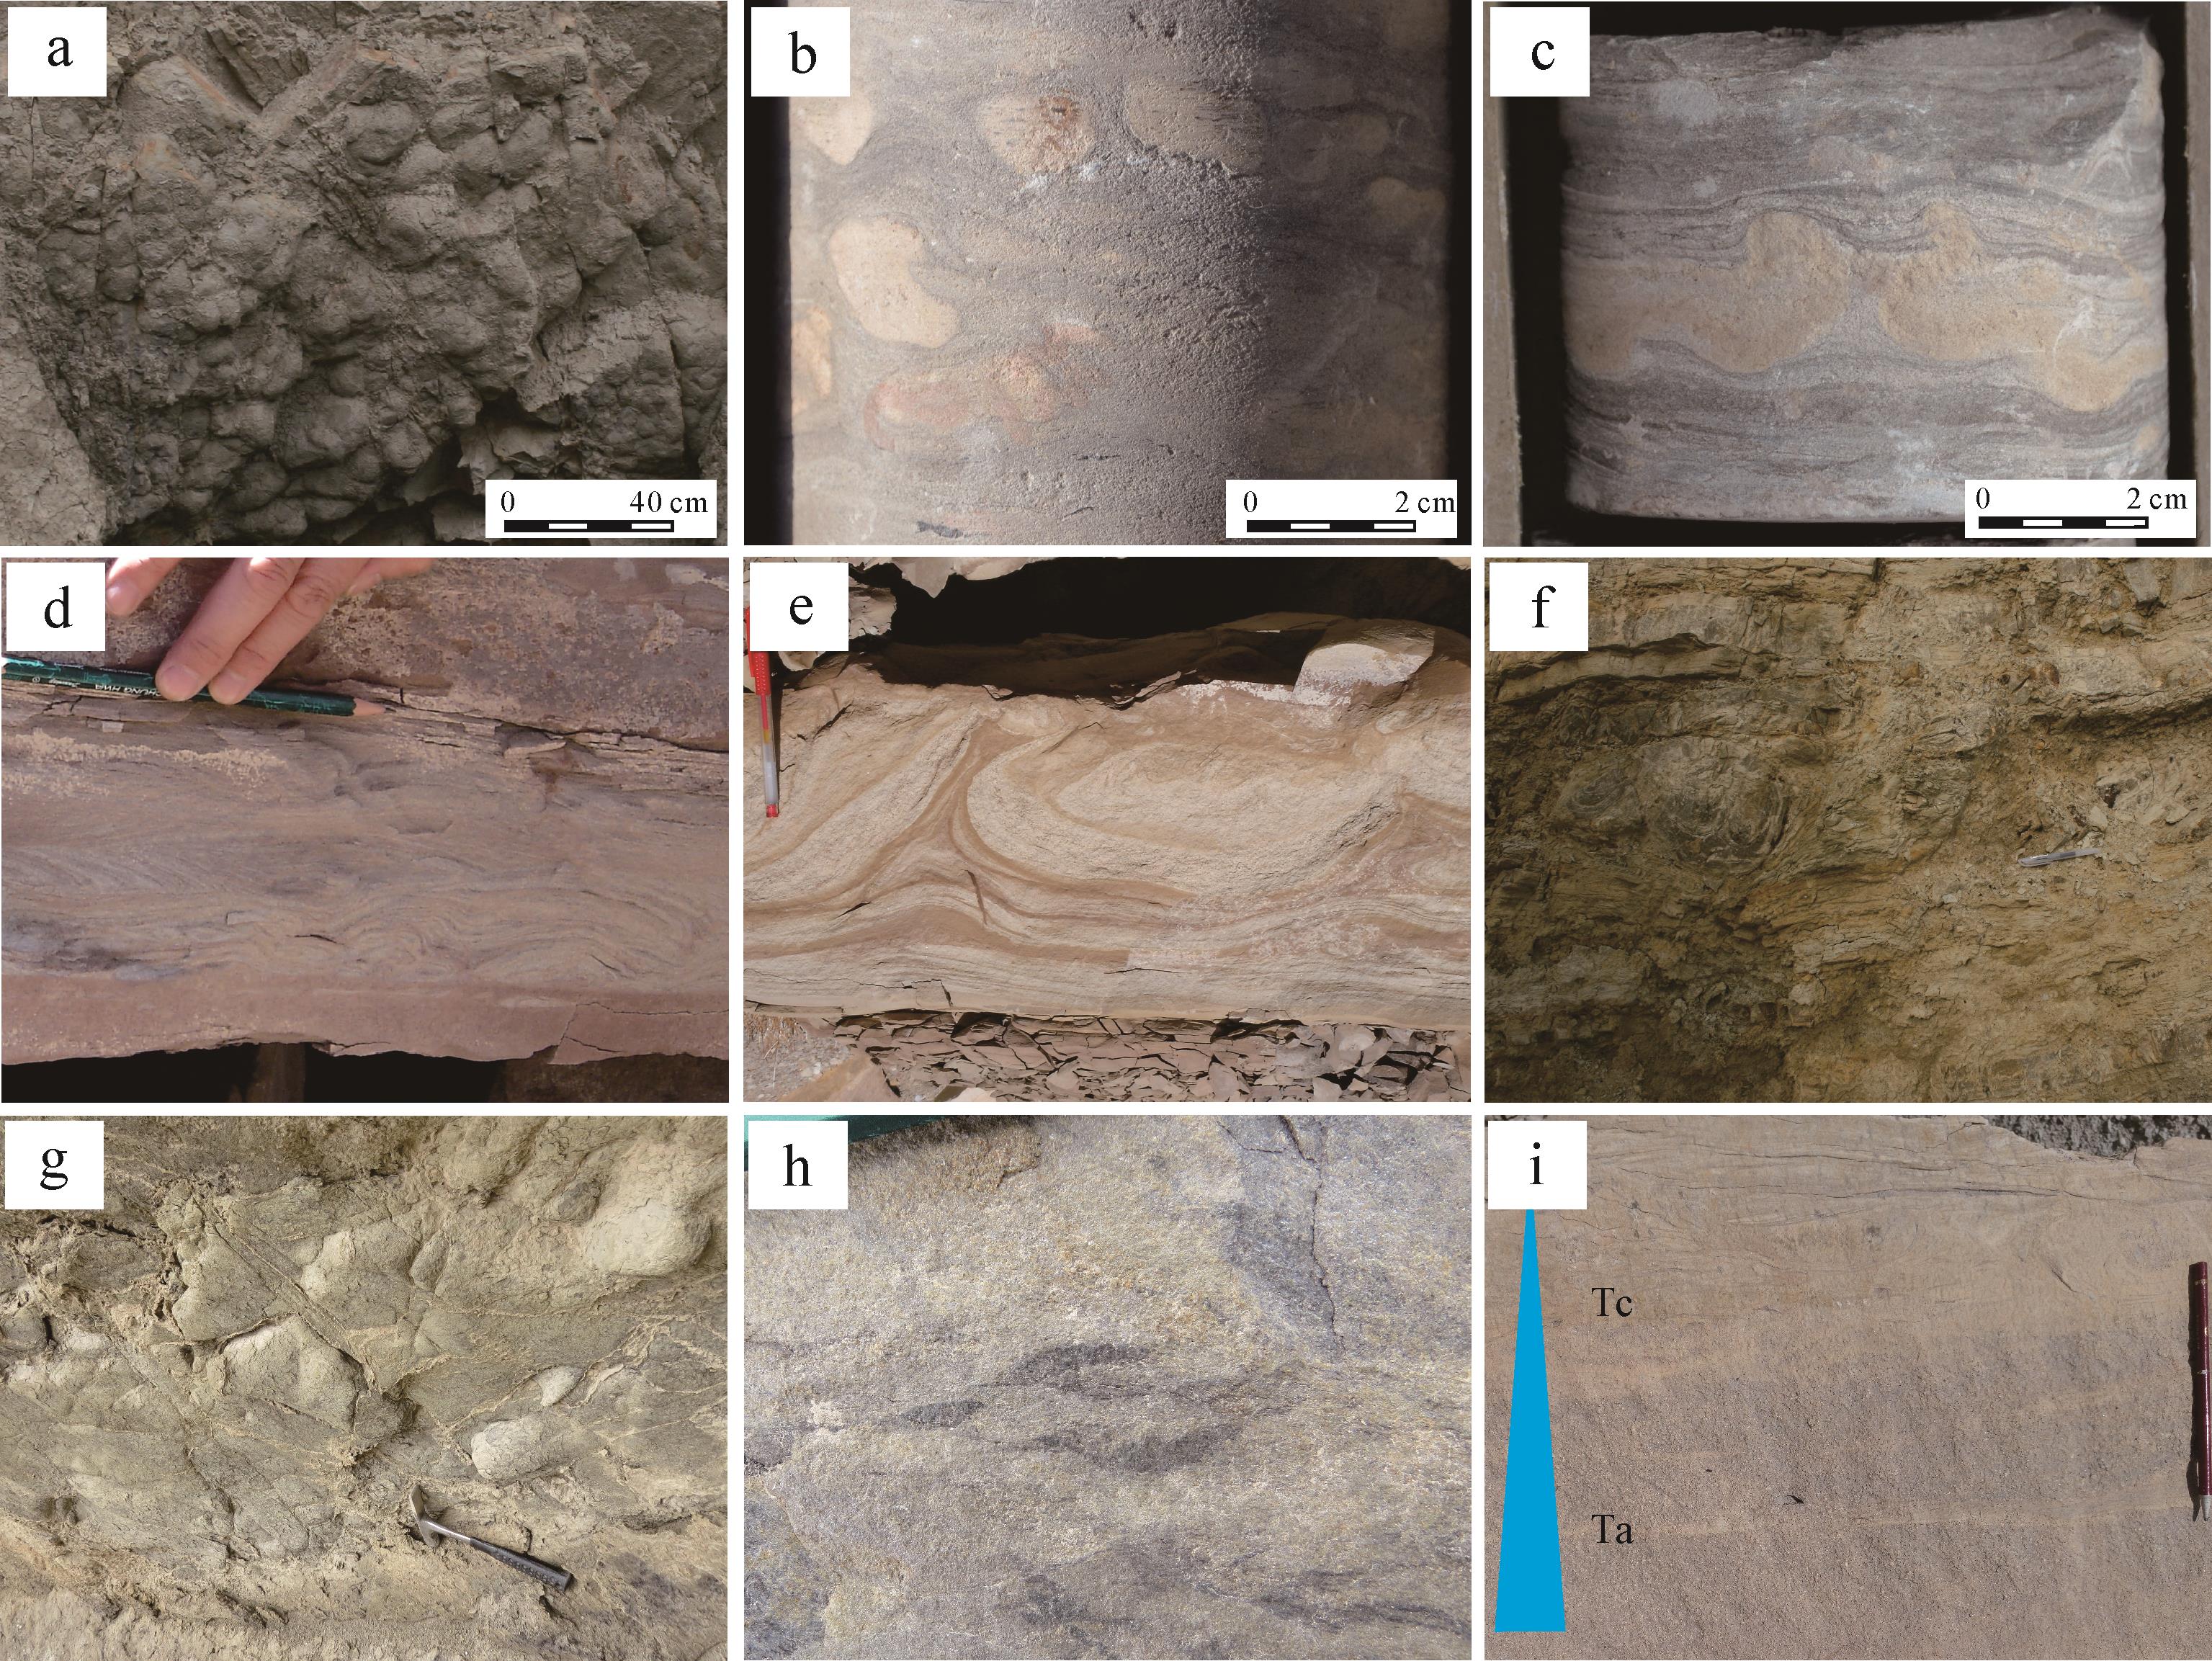
柴北缘鱼卡地区层序S2时期源—汇系统的坡度相对平缓,半深湖环境中未见大面积分布的湖底扇沉积,主要为深水原地沉积。但基于大量钻孔岩心以及野外露头的观察描述,层序S2偶见软沉积物变形构造发育,主要包括负载构造、球枕构造、包卷层理、泄水构造与滑塌褶皱(图17)。在沉积物密度倒置条件下,地震产生的震动会使未固结的、饱含水的砂质沉积发生液化作用,自身强度变低,密度较大的砂质沉积因重力作用向下陷入泥质沉积,形成负载构造[68⁃69](图17a,c)。随着液化作用的进一步进行,负载体可以完全陷入泥质沉积物,形成球枕构造(图17b)。包卷层理又称震褶层[70⁃72],是层内沉积物发生流体化作用后,在孔隙水剪切力作用下卷曲变形而成(图17d)。泄水构造的形成机制与包卷层理有部分相似之处,未固结而富含水分的沉积物受到震动后易发生流体化作用,孔隙流体向上泄出而导致沉积物颗粒的移动与重新排列,从而形成泄水构造[73⁃74],泄水通道两侧的纹层因受到向上牵引而弯曲变形为碟状(图17e)。滑塌褶皱局限于某一层内,上下岩层均未发生变形,滑塌层内岩性以细砂岩、粉砂岩和泥岩为主,常呈砂泥互层、揉皱变形的特征,变形程度较高的部位表现为砂泥混杂,泥质条带夹杂砂质团块,原始沉积层理被破坏(图17f)。部分深水沉积层段可见槽模与鲍马序列(图17g,i),其中鲍马序列主要显示了Ta段的正粒序层理与Tc段的沙纹层理,代表了浊流沉积(图17i)。由于浊流以紊流的形式向前运动,其头部具有较强的能量,因而会对下伏沉积物造成一定的侵蚀而形成底模构造[75⁃78](图17g),当其能量降低、流速减小时,颗粒在自身重力作用下以悬浮沉降的方式按大小先后沉积,因此常见正粒序层理[78⁃79](图17i)。此外也可见发育泥质撕裂屑的砂质碎屑流沉积(图17h),灰黑色的泥质撕裂屑代表了深水还原环境,为滑塌过程中下伏未固结或半固结的泥质沉积物受到搅动而混入砂质沉积,后整体转化为砂质碎屑流沉积。

Figure 17. Soft⁃sediment deformation structures and gravity flow deposits of sequence S2 in Yuqia area, northern Qaidam Basin
综上可知,软沉积物变形构造一般指示地震沉积,表明柴北缘鱼卡地区层序S2时期偶有地震发生,很可能是由于盆地性质转变为挤压坳陷之后,板块间相对挤压应力能量释放的结果。大量研究显示在一定触发机制下,较小的坡度同样可以产生重力流沉积[80⁃82],地震能够触发三角洲前缘沉积物滑塌,在沿斜坡向前运动过程中可逐步转化为砂质碎屑流与浊流,搬运较长距离至半深湖后沉积下来。因此,研究区局限发育的重力流沉积可能是沉积物遗失的一种方式,用来解释下游近端沉积区累计沉积物量与干流河道沉积物输入量之间的差距。
此外北半球水体的科里奥利偏转可能引起向西南方向的地转流[83],结合湖水的沿岸二次搬运,导致部分沉积物遗失至研究区之外。在源—汇系统中,虽然河流系统主要作为沉积物的搬运区,但其中侵蚀作用与沉积作用往往是同时存在的。对于曲流河而言,泛滥平原一般较为发育,因此一部分沉积物可以临时或者永久储存在河道以及广阔的泛滥平原之中[1,84⁃86],河流自身的这种沉积物储存可能是导致研究区“源”与“汇”之间体积差异的一种次要机制。
-
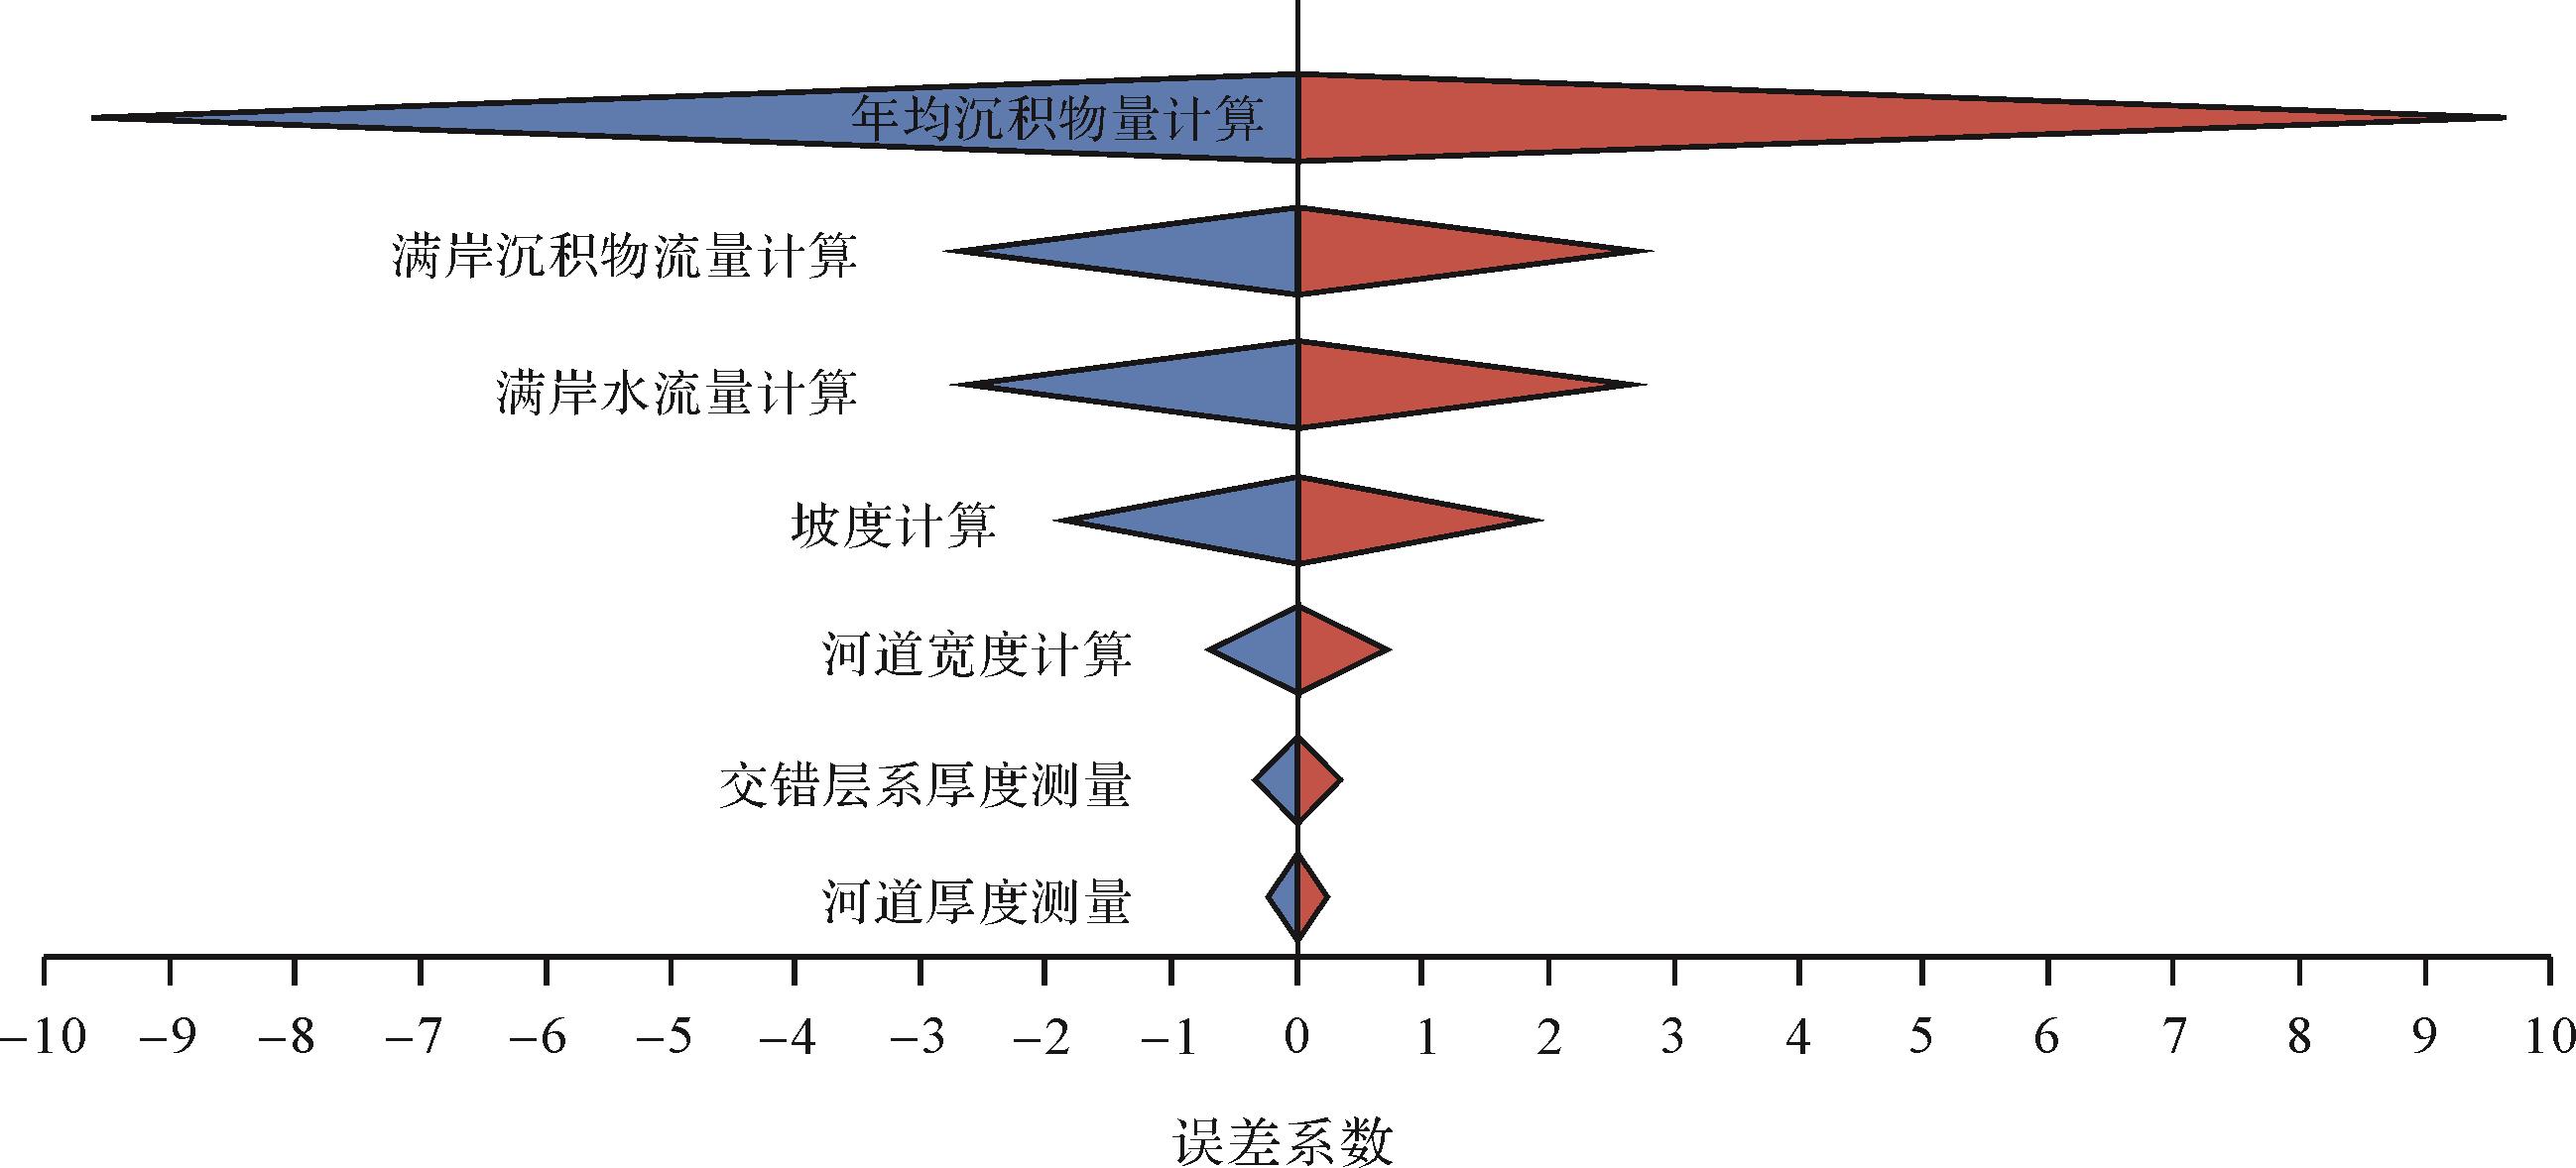
支点法涉及了多方面的不确定性,包括野外的测量、古水文参数的数值评估、经验公式的适用性、地层持续时间的限制。这些变量限制了沉积体积计算的精度,误差最高可达一个数量级[9,25,87](图18)。

Figure 18. Tornado diagram indicating uncertainty ranges for measurements and calculations adopting the fulcrum approach
误差与不确定性分析表明,与年满岸事件持续时间有关的年均沉积物量评估可能包含较大的误差,最高达到一个数量级。年均沉积物量是满岸事件持续时间、重现周期和沉积物搬运能力评估的函数,而这些参数在“深时”系统中仍然较难约束[56,85,88]。基于现代类似河流所获得的满岸事件持续时间与重现周期,往往有较大的变化范围,主要依赖于气候状况和构造地形。前人研究显示每年满岸事件持续时间大约占0.3%~6.6%,也就是1~24天[61⁃62,89],重现的时间间隔也从0.2年到2年不等[62,89]。满岸事件携带和搬运沉积物负载的比例也不尽相同,因为这是由满岸事件持续时间、沉积物供应、流域面积、河流发散性、每年洪水频率、河流正常流量、高流量频率和幅度等因素共同控制的,可能从25%到90%不等[55,62,90⁃92]。与大陆级别的大型河流系统相比,鱼卡地区干流由于沉积物搬运路径相对较短,流域面积较小而导致满岸事件在年输沙量中占比较高[55]。
支点法只考虑了通过支点的沉积,未考虑支点向陆方向的沉积存储,因而不可避免地带来了不确定性。沿着干流纵向剖面进行多个支点的评估,有助于了解河流系统中不同位置的沉积存储[25]。本次研究中鱼卡地区河流上游的地层已被后期剥蚀,难以进行纵向多支点的评估,但该方法对于河流纵向地层保存完整的案例研究具有一定的指示意义。古地理重建显示鱼卡地区主要存在一条干流提供沉积物供给,因而仅需在该干流上进行支点分析即可。若之后其他研究案例中存在多条水系并存的情况,可以通过划分不同的水系分别进行分析,综合多条补给河流的沉积物输入量,将其与“汇”中保存的沉积量进行对比。如果单个支点干流的沉积物输入量小于“汇”中保存的沉积量,则可以推断出具有多个干流[25]。
本次河道厚度数据来自于野外露头、钻孔岩心以及对应测井曲线的直接测量,交错层系的测量同样结合了野外露头与钻孔岩心,粒度分析基于镜下砂岩薄片观察,因此误差相对较低。基于经验公式所计算的河道宽度相误差则会变大,变动范围一般在50%~100%[93]。河道厚度测量的过程中,多层叠置的河道仅有最上部的河道是完整的,下部河道往往被上覆河道冲刷侵蚀而保留部分沉积厚度;若没有明确区别出多期河道而将其作为一期河道,则会得出过高的测量值。河道沙坝上部因粒度较细,有可能与堤岸或河漫沉积混淆而未被剔除,则会得出过低的测量值[94⁃95]。此外,支流河道、三角洲分流河道沉积同样可能未被准确识别而影响干流河道厚度测量的真实值,因此河道厚度测量可能存在20%左右的误差[22,25],尽管本次已对数据进行校正来减小这些误差影响。
坡度评估的误差主要取决于满岸阻抗参数τ* bf 50,满岸阻抗参数1.86的取值代表了具有砂质底床河流的一般经验近似值,误差范围在200%之内[25]。Paola et al.[96]认为,在控制磨圆和坡度的其他变量已知的情况下,可以针对特定的河流计算出更具体的参数(τ* form ),从而获得更高的精度。
有针对性地选择现代河流进行类比,运用更符合实际地质背景的古水力学方程,并尽可能多地直接测量源—汇系统基本参数(如在地震资料允许的条件下直接对河道宽度进行测量),将会显著降低支点法使用过程中的上述不确定性与误差。
了解从“源”到“汇”的物质供给,对于盆地演化模型的建立以及“深时”流域条件的推断是至关重要的。沉积通量评估可应用于多方面的研究,包括预测盆地中储层砂的供应、古流域的重建、古气候的重建、流域内气候或构造变化的物质响应以及预测盆地的沉积速率等。建立准确评估源—汇系统收支平衡的方法,是推进下一代“深时”沉积模型的关键[25]。支点法与之前的源—汇系统分析手段有所不同,它侧重于直接利用河道古水力学参数来获得收支评估,因而提供了一种可以与其他方法相互验证的独立手段。尽管支点法应用过程中存在一些误差,但相对于之前以定性分析为主的研究具有一定的先进性,在柴北缘进行源—汇系统收支定量分析也尚属首次。与此同时,该方法可进一步推广应用于陆相河流—湖盆沉积组合的源—汇系统分析。
-
(1) 柴北缘鱼卡地区中侏罗世发育典型的陆相盆地源—汇系统,可进行干流河道沉积识别,测量或计算河道尺寸,结合粒度分析、古气候与流域分析,获取多种古水力学参数,进而重建源—汇系统关键组成要素。
(2) 源—汇系统收支定量分析显示,鱼卡地区干流满岸深度在3.1~3.3 m,河道宽度为69~77 m,流经较缓的坡度(0.000 204 6~0.000 217 8),流速一般为1.046~1.048 m/s,搬运中—细砂为主的沉积物。该时期流域面积约为3 209.8~3 781.6 km2,流域长度介于177.8~196.2 km,满岸水流量介于239.9~286.2 m3/s,满岸推移载荷流量为0.043~0.048 m3/s,满岸悬浮载荷流量范围为0.083~0.094 m3/s。基于现代类似河流的对比,得出鱼卡地区干流年均沉积物搬运量介于158 862.4~179 242.3 m3,在层序S2所持续的2.2 Ma共向沉积区输入349.5~394.3 km3的沉积物,与沉积区所统计的沉积体积(322 km3)大致相符。
(3) 柴北缘鱼卡地区中侏罗世河流沉积物输入体积的高值约为支点下游沉积区统计体积的1.22倍,如果这一分析结果准确,则表明存在一定程度的沉积物遗失现象,研究区局限发育的重力流沉积可能是沉积物遗失的主要方式。

 DownLoad: