
-
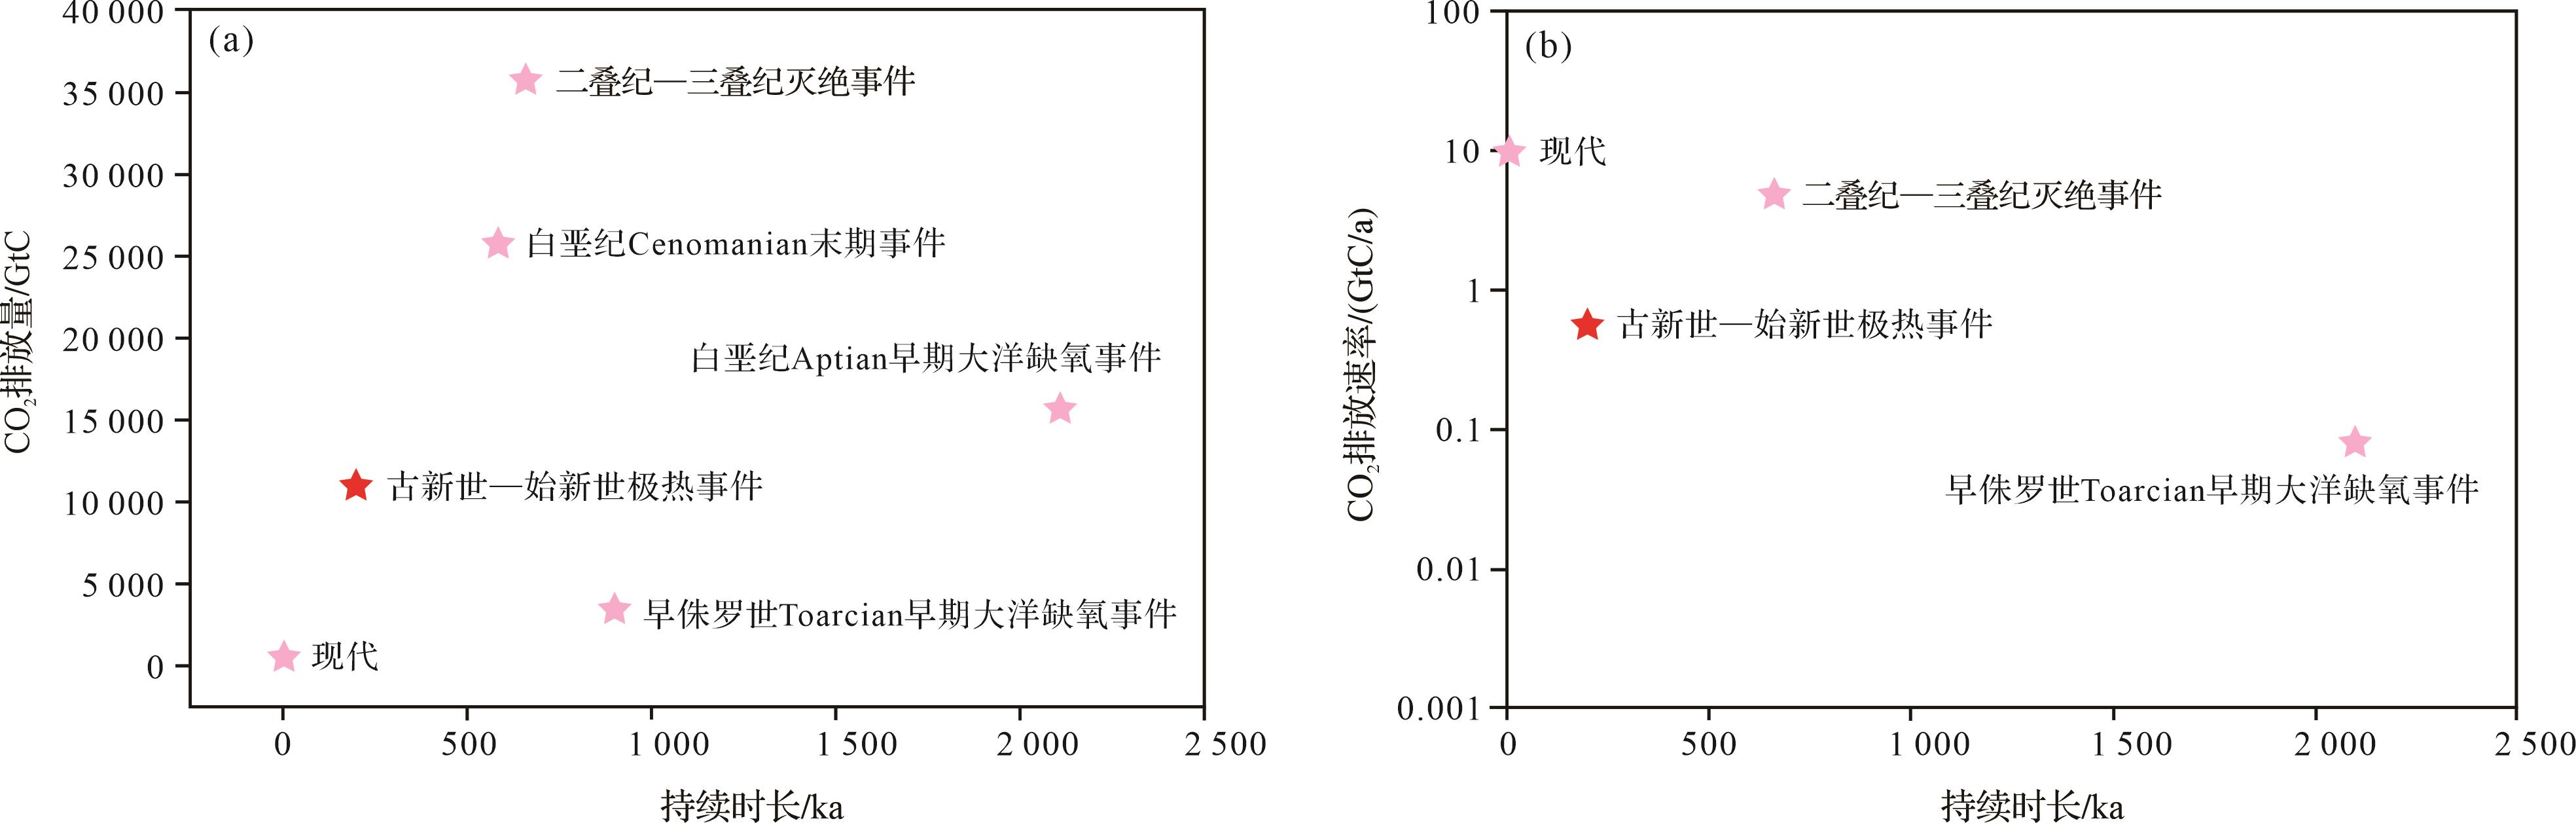
工业革命以来,人类燃烧化石燃料,释放了大量的CO₂等温室气体到大气中,导致地球的平均气温相比工业革命之前显著升高[1⁃2]。其引起了前所未有的气候系统巨变,包括海平面的显著上升、极端天气事件(如极端热事件、干旱、强降水等)的频繁发生、海冰的快速消融以及生物物种的快速消亡等[1],给人类生存和发展带来了严峻的挑战。在地质历史时期发生了多次大气中CO2浓度升高导致的气候变化事件,例如二叠纪—三叠纪灭绝事件[3]、早侏罗世Toarcian早期大洋缺氧事件[4]、白垩纪Aptian早期大洋缺氧事件[5]、白垩纪Cenomanian末期大洋缺氧事件[6]、古新世—始新世极热事件等[7⁃8](图1)。然而,由于海陆分布格局、生物面貌和气候变化速率与当今存在巨大差异,只有少数地质事件能够为现今的全球变化进程提供有益的参考。其中,古新世—始新世极热事件(Paleocene-Eocene Thermal Maximum, PETM, ~56 Ma)被认为是由巨量轻碳(富含12C)注入大气系统所引发的快速升温事件[9⁃11],这一过程释放的CO2总量和速率与工业革命以来人为排放最为接近[12](图1)。因此,深入探索PETM事件的碳排放触发机制进行,对人类预估地球气候未来变化趋势、了解宜居地球的演化历史具有重要的意义。

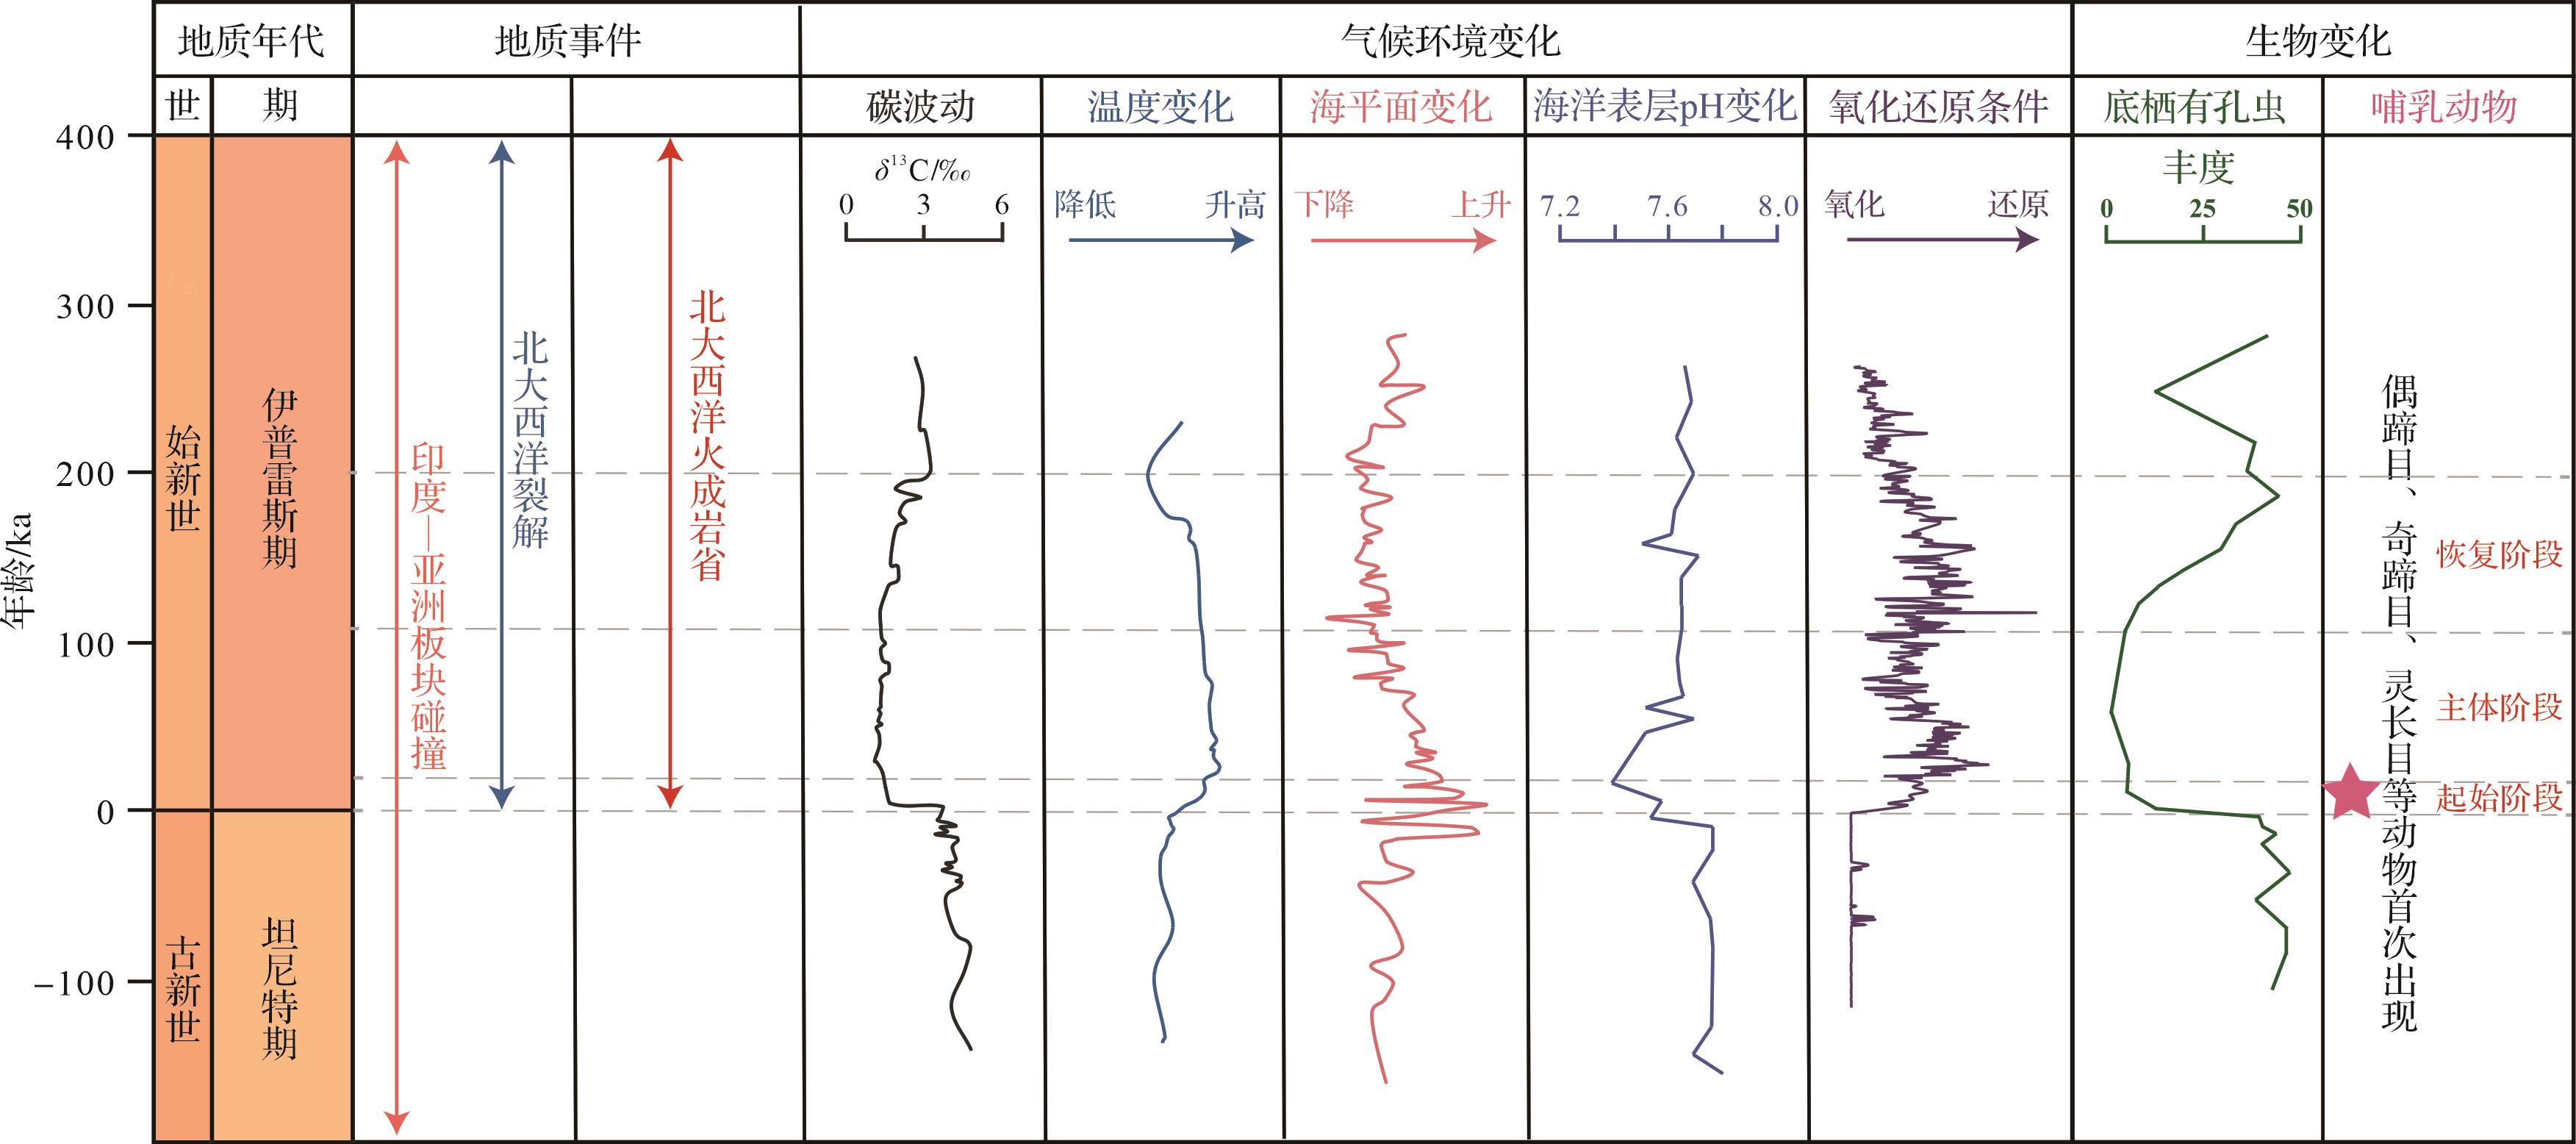
古新世—始新世极热事件[13⁃14]是新生代中引人注目的一次极端地球宜居性扰动事件,主要以碳同位负偏约3‰~4‰为特征[9⁃11],持续时间在150~200 ka[15⁃16]。该时期全球平均地表温度升高了4 ℃~6 ℃[17],对地球的生态、气候和环境产生了巨大的影响[18⁃24](图2)。在生态系统方面:部分底栖有孔虫灭绝[25];浮游有孔虫多样性普遍增加[26];出现偶蹄目、奇蹄目、灵长目等动物[24],哺乳动物在此期间快速演化[9]。在气候环境方面:海平面发生变化[27];极端降水事件频繁,气候的季节性加强[28⁃29];大洋酸化[30];海洋脱氧、部分海洋水体达到缺氧程度[31]等。该转折期内气候、环境和生物演变剧烈扰动,被认为是大量轻碳(富含12C)输入地表所致。所以,该事件是探究深时碳循环扰动对地球宜居性演变影响的典型案例。

目前对于该转折期轻碳的来源仍存在争议。首先,部分研究认为海底天然气水合物的热分解是巨量轻碳的来源,海底天然气水合物广泛分布于陆源外围的深海沉积物中,海洋环流的变化可能导致海底温度的升高,进而引发天然气水合物的分解和释放,导致碳同位素的负偏[12,32⁃33]。其次,一些学者认为高纬地区冻土层融化,使得有机质分解,分解的有机物质也会以二氧化碳和甲烷的形式释放巨量的轻碳[34]。有研究认为天文轨道控制的气候变化可能触发了这一碳排放进程[13,35⁃37]。再者,有学者提出了地外成因说。例如,Kent et al.[38]通过分析大西洋滨海平原的钻孔样本,发现在PETM过渡期高岭土等黏土矿物富集的大陆架沉积物中存在异常富集的磁性纳米颗粒,认为富12C的彗星撞击地球是这一时期巨量碳的来源[38⁃39];有研究发现,大西洋边缘的三个海相古新世—始新世界线剖面地层中存在硅酸盐玻璃微珠,也被认为是外星撞击地球的地质证据[40]。最后,大量研究证明北大西洋火成岩省(North Atlantic Igneous Province, NAIP)的岩浆活动[8,41⁃44]或热液喷口复合体与有机质围岩的接触热变质作用[45⁃46],可能是PETM时期巨量碳的来源。然而,目前火山活动与该时期气候环境变化的因果关系还不明确,其主要的瓶颈在于环境和生物信息保存丰富的沉积岩中缺乏火山活动记录。
沉积物中火山活动可以利用特殊元素及其同位素指标进行识别,如汞浓度、汞同位素、锇同位素、硫同位素等。在示踪海底火山活动时,锇(Os)同位素可以作为一项重要的指标[47]。沉积物中Os同位素向非放射性Os的转变可能是由于火山活动或陨石撞击产生的非放射性Os的输入增加引起的。然而,仅凭Os同位素的数据,不能完全排除陨石撞击事件发生的可能性[48],并且其不能示踪不同圈层(如陆地系统)和大范围(如全球范围)的火山活动记录。此外,硫(S)同位素常被用于区分平流层和对流层的火山喷发[49],然而,现有的Δ33S指标与火山灰层之间的对应关系并不完全吻合[50],因此需要进一步的研究和评估。
近来研究表明,沉积物中汞元素含量及其同位素比值可以有效示踪古火山活动[51⁃52],因此被广泛用于对包括PETM事件在内的多次环境扰动事件研究之中[44,52⁃54]。对于PETM事件,研究人员发现汞含量的分布具有空间不均一性,即距离NAIP越近,沉积物中的汞含量越高;相反,距离NAIP越远,汞的浓度则相对较低[44,55⁃56]。此外,Jin et al.[44]依据PETM时期Δ199Hg的变化验证了NAIP火山活动与PETM存在因果关系。目前,有关PETM时期火山沉积汞的研究主要集中于Hg元素含量异常的研究,而关于Hg的标准化研究等还存在一些问题,且缺少不同沉积环境剖面的汞同位素研究。因此,本文对PETM事件火山沉积汞的研究现状进行阐述,并对存在的问题及发展前景进行了评述。
-
在地质历史时期中,大规模的火山活动往往与较大的环境气候扰动事件有关[57]。在晚古新世,发生了大规模火山喷发——北大西洋火成岩省[58]。20世纪90年代,Eldholm et al.[59]提出了PETM期间的气候变化与NAIP之间存在联系,随后研究人员开始深入研究火山去气对气候演变的影响,并探索这些因素是否可能触发PETM。大量地质年代学证据表明,NAIP与PETM事件在时间上有着密切联系[43,60⁃61]。东格陵兰岛地区沉积的年龄介于56.0~55.5 Ma、厚度介于5 000~6 000 m的溢流玄武岩可为此提供证据支撑[42⁃43,62]。PETM事件开始及之前,北欧地区沉积的多层火山灰也可为NAIP的剧烈活动提供直接证据[55,63]。此外,基于反射地震剖面及相关钻孔资料,研究人员提出,大量地幔来源的熔融物质上涌并侵入北大西洋底部富含有机质的沉积层,导致有机质受热迅速分解并产生大量的温室气体(CO2、CH4),最终导致了PETM事件的发生[41,64⁃65]。除了上述研究外,前人基于Os同位素的研究认为,部分地区187Os/188Os比率的变化是由北大西洋火成岩省喷发出的大量玄武岩经过风化作用后向环境中输入非放射性Os元素所引起的[66⁃68],这也为北大西洋火成岩省与PETM事件的联系提供了支撑证据。
-
北大西洋火成岩省的熔岩面积为1.3×10⁶ km2,岩浆体积约为5×10⁶~10×106 km3,主要由拉斑质玄武岩组成[43,58]。其岩浆活动主要分为两个阶段进行:第一阶段发生约在62~58 Ma,这阶段被认为与地幔柱柱头热点初始到达有关;第二阶段发生在57~53 Ma,其中56~55 Ma岩浆活动较为活跃,这一阶段与PETM事件在时间上存在耦合[60]。北大西洋火成岩省的剧烈活动主要以火山去气的方式向大气中注入大量CO2,从而使得碳循环系统扰动。基于硼、碳同位素数据和地球系统模型的反演模拟,Gutjahr et al.[8]提出PETM碳同位素和海水pH的协同变化需要至少10 000 Gt(十亿吨)碳(C)注入海—气系统才能实现。另一项估算研究认为,玄武质岩浆中CO2含量约在0.2%~0.6%[69⁃70],假设岩浆CO2含量为0.5%和岩浆脱气效力约为3.5 Mt C km-3[71](百万吨碳/立方千米),则NAIP火山去气过程可以将21 000~35 000 Gt碳注入海气系统之中[46],满足上述反演模拟的碳排放需求量。这些研究表明,北大西洋火成岩省的喷发和火山去气可能会形成巨量的碳源。
-
除了上述火山喷出作用向大气释放大量CO2之外,富有机质沉积地层的接触热变质作用也可提供巨量的碳源[41,45]。岩浆侵入富含有机质沉积地层,加热产生的温室气体的快速释放可以触发PETM[41]。有研究发现,位于挪威海的Vøring和Møre盆地存在数以千计的热液喷口[45],Svensen et al.[64]对Vøring盆地的侵入体进行锆石U-Pb定年分析,结果显示岩浆侵入Vøring盆地的时间为55.6±0.3 Ma和56.3±0.4 Ma,这与PETM发生时间相吻合。据估计,挪威大陆边缘的热液喷口会释放225~2 250 Gt碳[41],而NAIP岩浆侵入区域内的有机质地层发生接触热变质作用可能释放约13 000 Gt碳[46]。如果许多侵入体—火山通道同时喷发,能够具有在短时间内(<100 ka)释放巨量碳的潜力[68]。这也为富有机质沉积地层的接触热变质作用触发PETM事件的发生提供证据。此外,热液喷口复合体会多次喷发[72],因此,挥发物质会随着多次喷发被释放到外界环境中[73]。
-
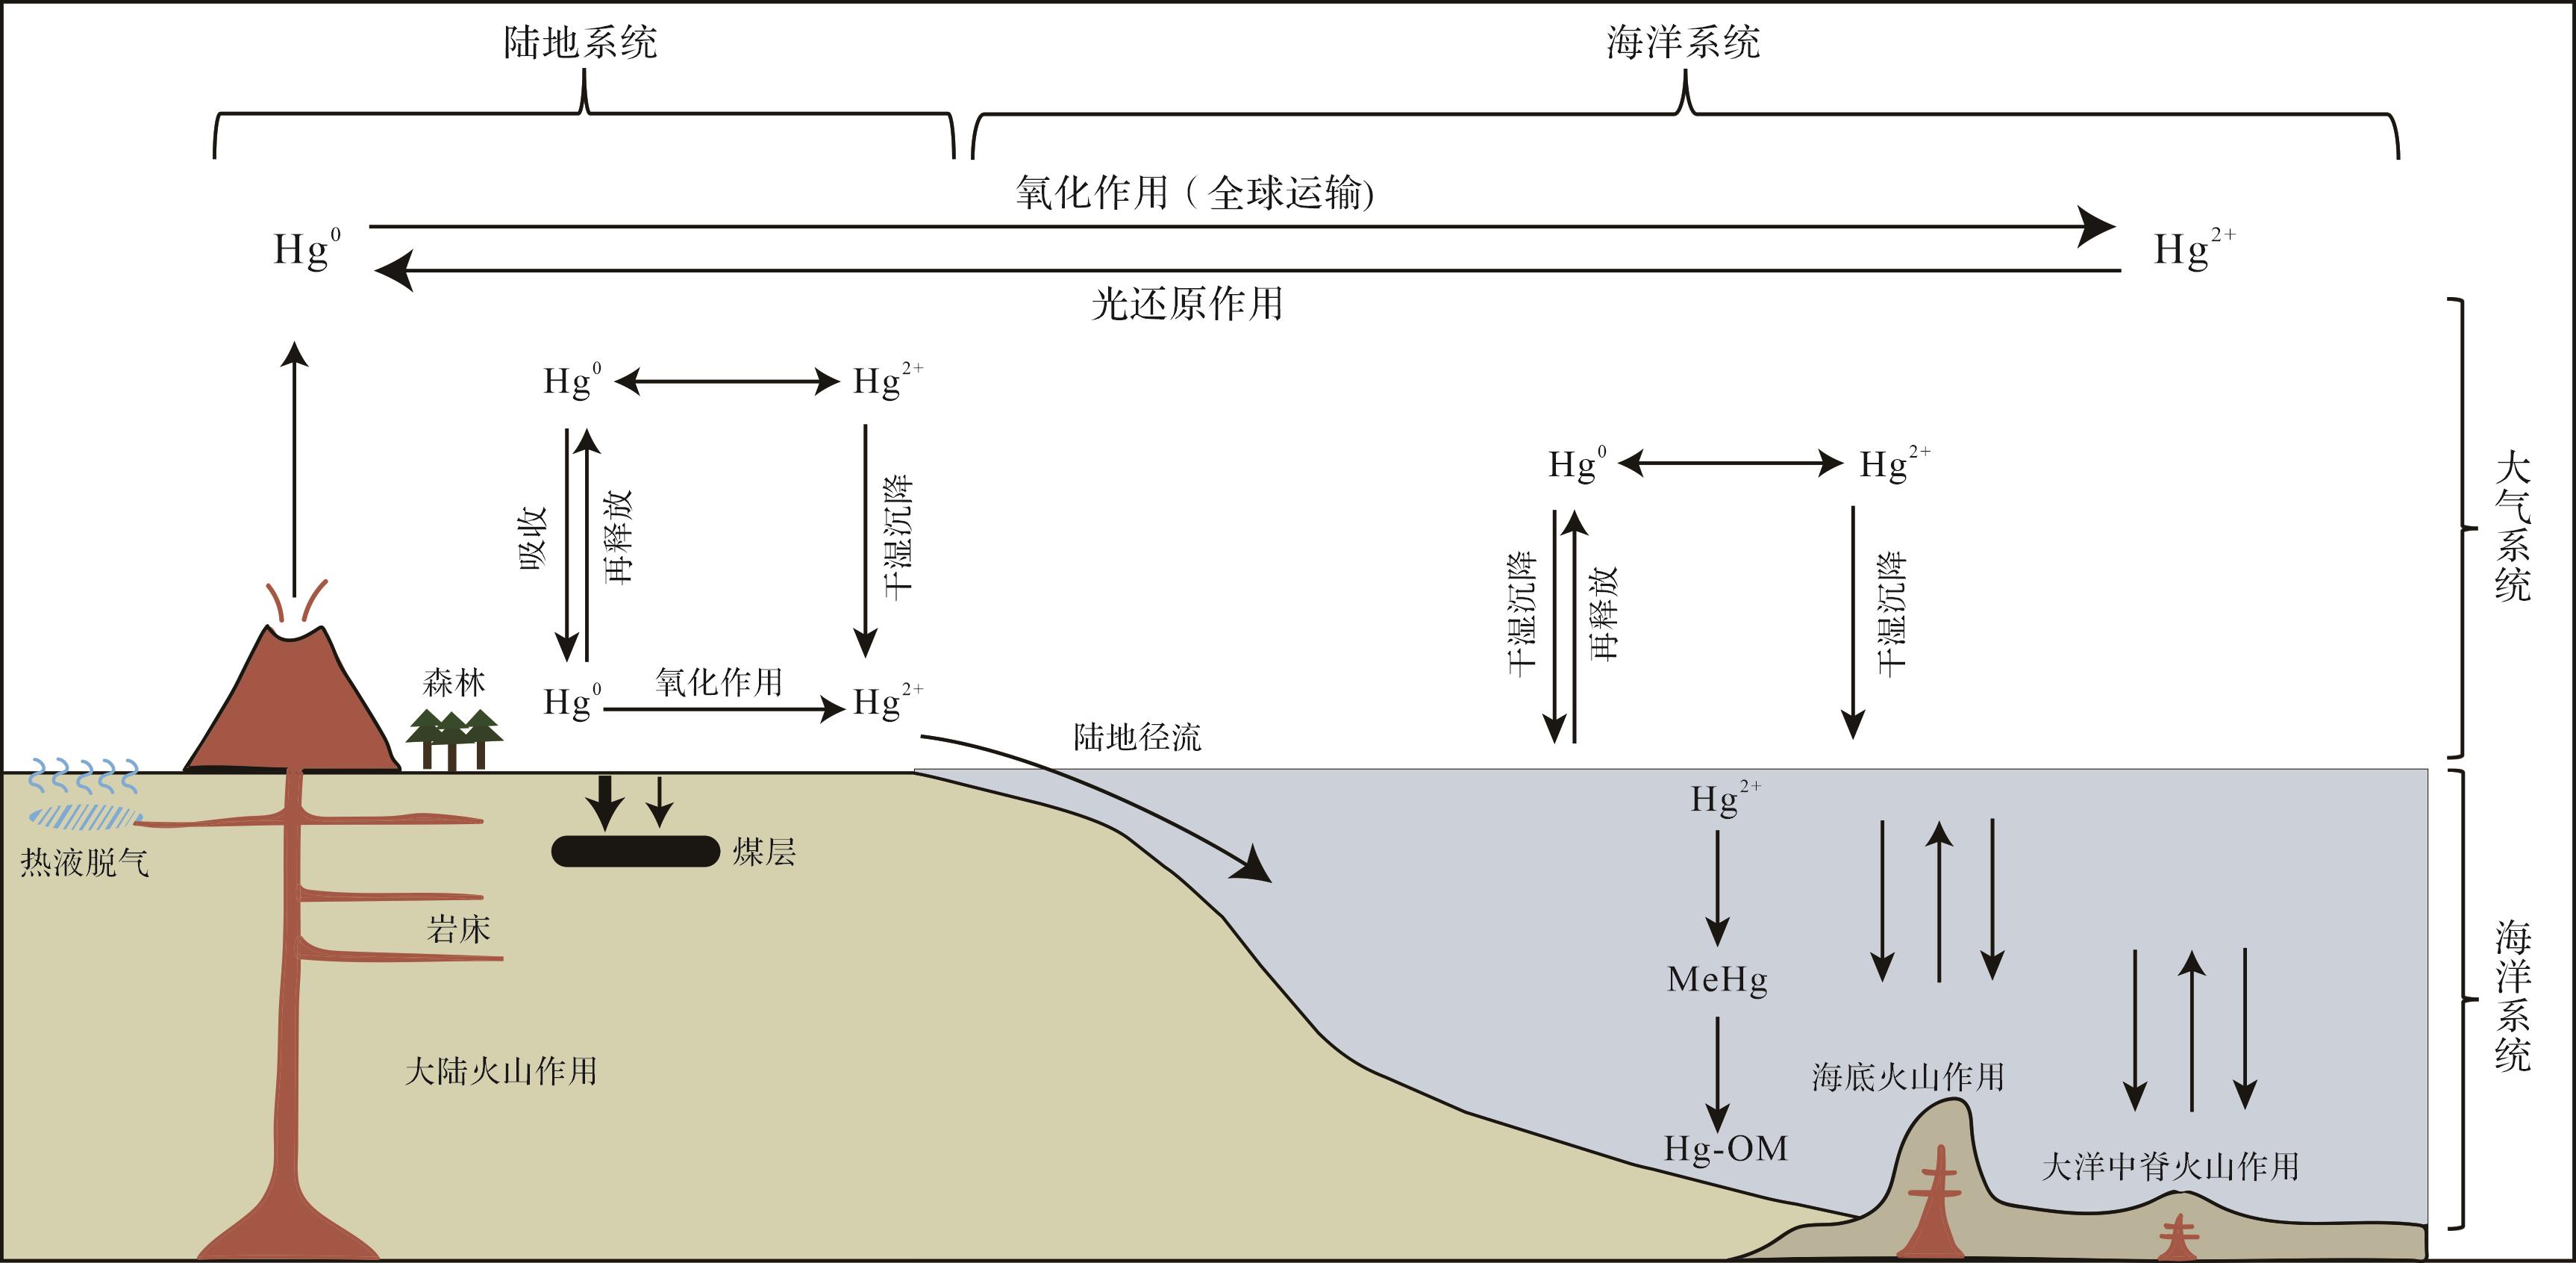
汞,俗称水银,为常温常压条件下唯一呈液态的金属[74],在常温常压下会蒸发,主要以气态形式存在于大气之中。汞在大气环境中主要有三种存在方式:(1)气态单质汞(Hg0);(2)气态氧化汞(Hg2+);(3)颗粒汞(Hgp)[74]。地质历史时期,火山活动和海底热液排放被认为是海洋—大气系统中天然汞的主要来源[75⁃78]。此外,森林野火和陆地风化作用增强也可以使得陆地系统中的汞释放到大气之中。火山释放的汞大多以气态单质汞(Hg0)的形式存在,并在短时间内(0.5~2.0年)通过大气循环运输到全球范围[74,79]。Hg0通过光化学反应经臭氧、卤素或羟基自由基氧化为活性Hg2+,随后经过干湿沉降于大陆和海洋环境中,汞在海洋中停留时间较短(几百年),容易被捕获至海洋沉积物中[80⁃81]。也有部分Hg0转化为Hgp,Hgp通常在大气中停留时间极短(天至周尺度),通过干湿沉降被移出大气系统[76,78]。
陆地环境中汞的主要来源为大气,Hg0被植物叶片吸收或被赋存于土壤有机质之中[82],随后被氧化,赋存于有机质或黏土等成分之中[83],通过河流径流携带至湖泊、海洋之中[84]。水生环境中汞以Hg0aq、Hg2+aq、甲基汞(MeHg)、二甲基汞(DMHg)以及颗粒汞(Hgp)和胶体汞的形式存在[76,85]。海洋表面的汞交换较为快速并延长了大气中汞的停留时间,沉积到海洋中的Hg2+经过一些生物或光化学作用可以被还原为Hg0吸附在颗粒上或直接形成甲基汞(MeHg),最终这些MeHg会转化为有机汞复合物(Hg-OM),被固存在海洋沉积物中,完成汞的循环[86⁃90](图3)。
-
在自然界中,汞有7种稳定同位素,其自然丰度分别为:196Hg=0.16%,198Hg=10.04%,199Hg=16.94%,200Hg=23.14%,201Hg=13.17%,202Hg=29.73%,204Hg=6.82%[91]。汞在循环过程中会产生独特的同位素分馏,主要方式为:质量分馏(mass dependent fractionation,MDF,常用δ202Hg表示)和非质量分馏(mass independent fractionation,MIF,常用Δ199Hg表示)。汞同位素的质量分馏可以发生在各种物理(如蒸发)、化学(如化学还原)和生物过程中,而其非质量同位素,特别是奇数非质量分馏同位素(如Δ199Hg)主要在光化学还原作用下发生明显分馏,其他地表的生物化学过程则对其分馏影响不大[92]。因此,汞同位素的非质量分馏可以很好地示踪地质历史时期汞的来源。汞的同位素组成常用δ值表示,具体公式[92]如下所示:
δ xxxHg(‰)=[(xxxHg/198Hg)样品/(xxxHg/198Hg)标准‒1]×1 000(1) 式中:XXX为汞同位素的质量数(199、200、201、202和204)。
汞同位素的MIF值用ΔxxxHg(‰)表示,为实测的δxxxHg值与以δ202Hg为参考值所得的理论值的差值[92]:
ΔxxxHg= δ xxxHg–β×δ 202Hg(2) 式中:XXX为汞同位素的质量数(199、200、201和204),β为描述质量相关分馏的参数,其具体值为:0.252 0、0.502 4、0.752 0、1.493 0[92]。
对大气不同形态汞的同位素分析表明,气态单质汞(Hg0)具有偏负的Δ199Hg值,气态氧化汞(Hg2+)具有偏正的Δ199Hg值[93]。现代火山直接排放的Δ199Hg值接近于0‰[94]。地质历史时期,Hg通过火山和热液活动从地球的深层储层释放到大气中,此来源的Hg不发生非质量分馏,Δ199Hg值接近零[82]。在陆地体系中,植被或土壤中汞以大气Hg0为主,这使得陆相沉积物所记录的Δ199Hg值以负值为主[92]。因此,在浅海近岸环境中,陆地径流所输入的汞元素会使得沉积物中记录的Δ199Hg为负值[95]。此外,火山输入的Hg在长距离运输时会被氧化为Hg2+,通过干湿沉降至环境之中,在远洋环境或深海环境中,沉积物中以Hg2+为主,因此,Δ199Hg的记录趋于正值[92]。
-
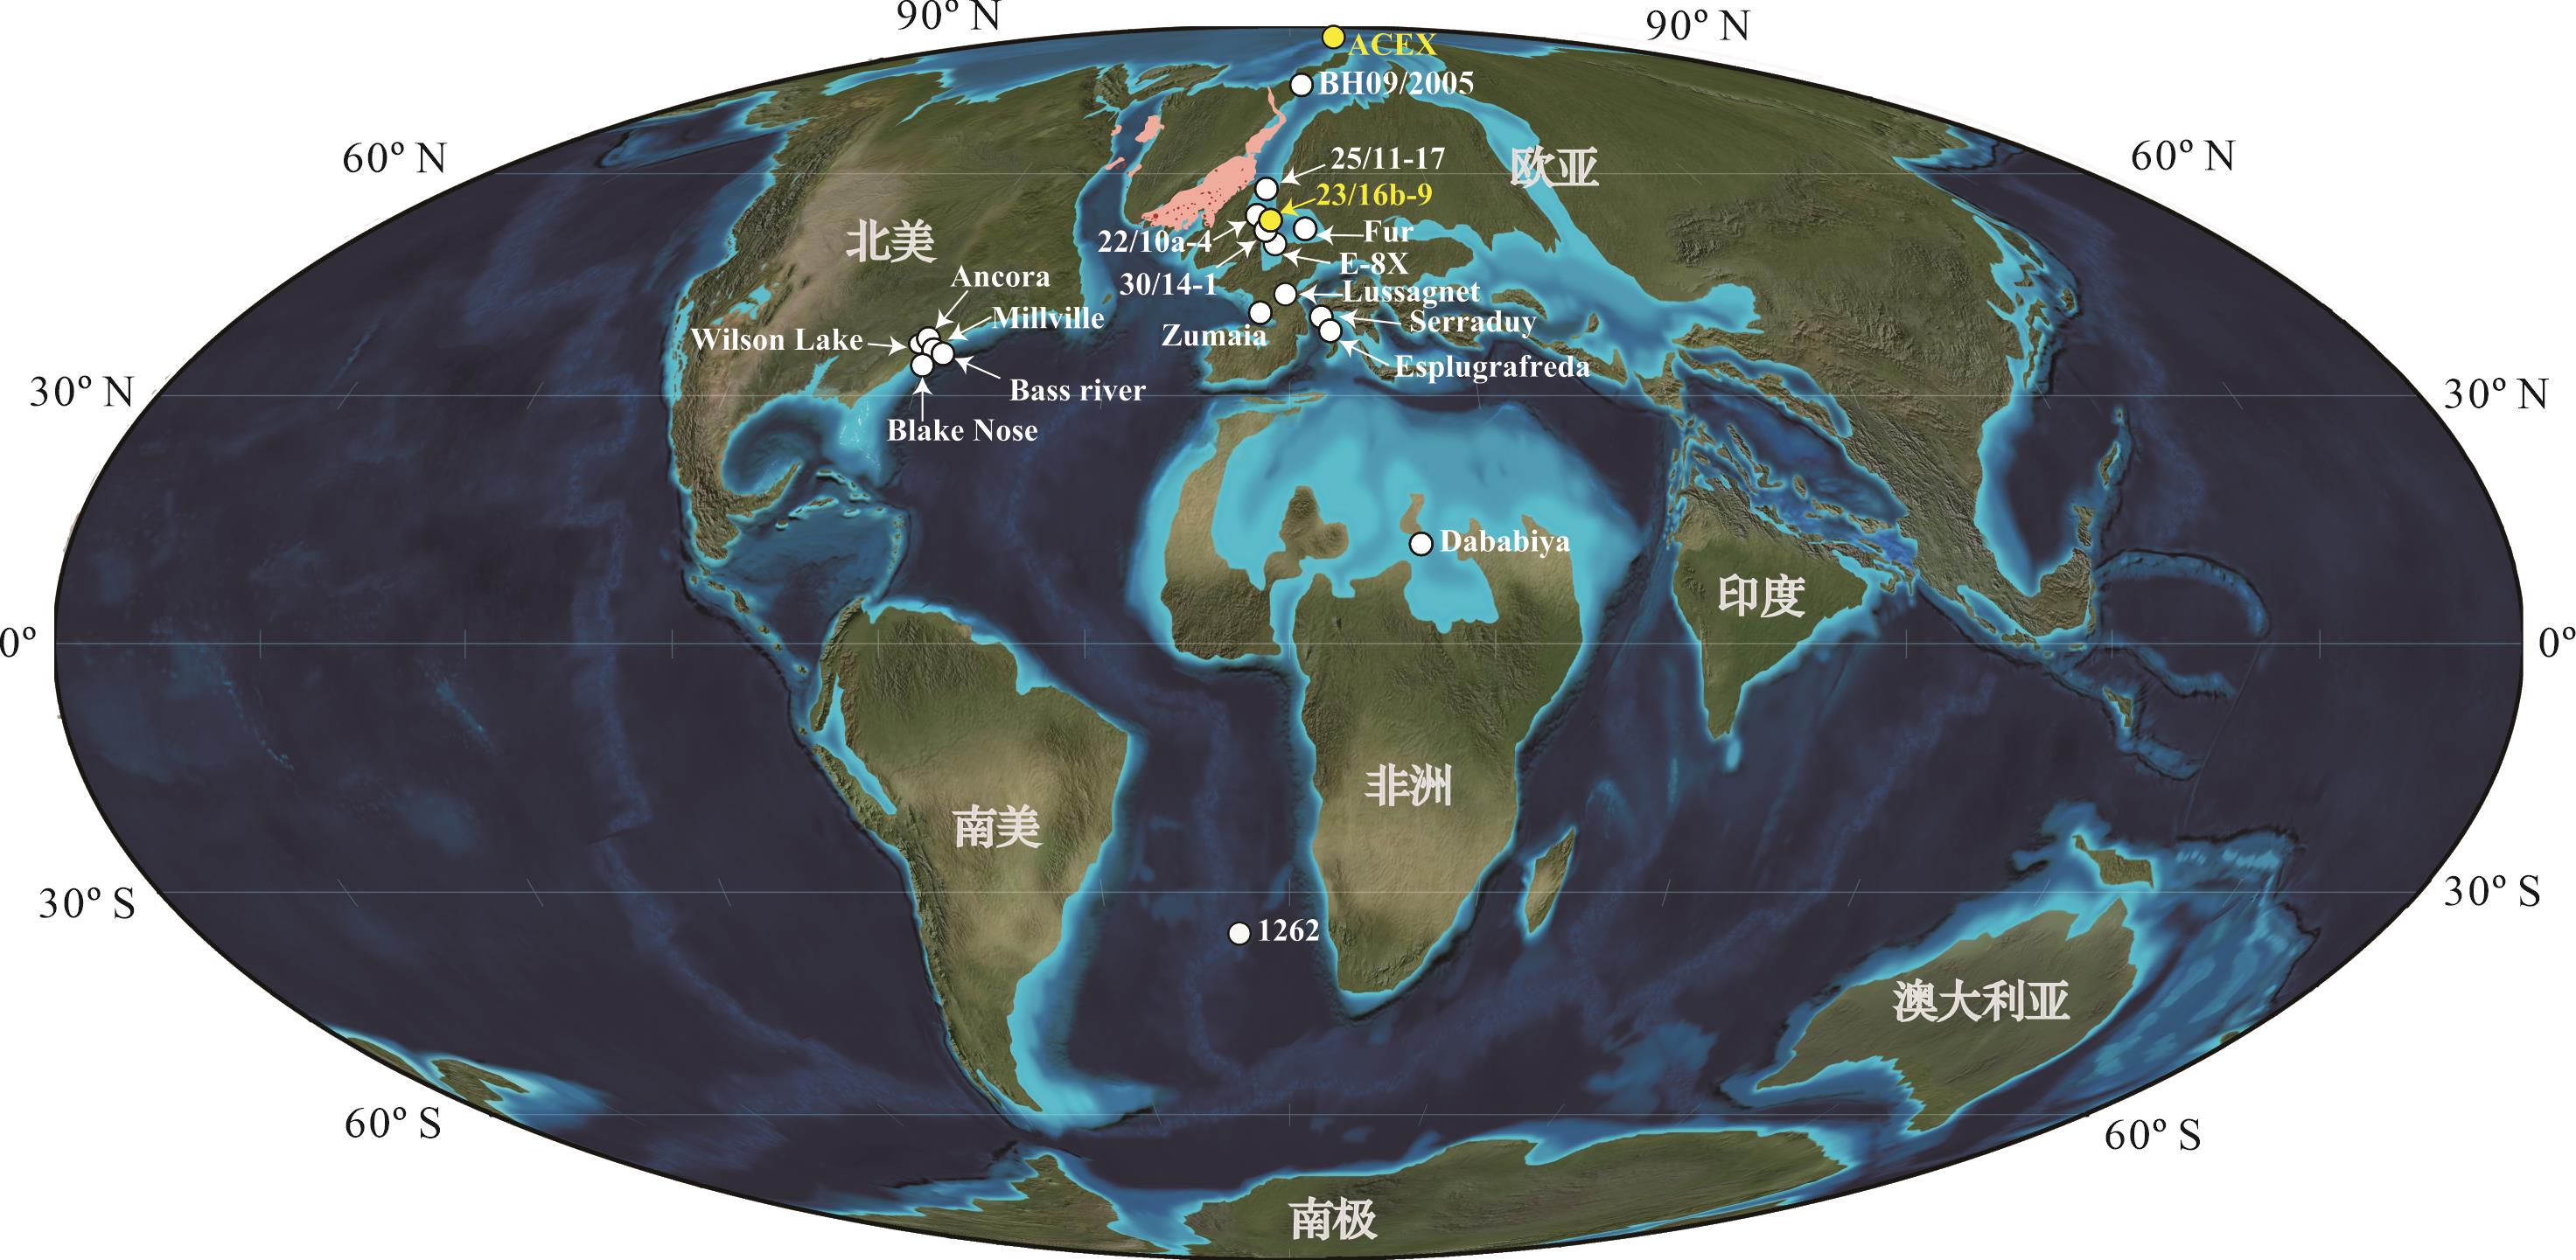
迄今为止,已在全球分布的19个PETM剖面或钻孔中有汞浓度的报道[44,55⁃56,68,96⁃99](图4),上述剖面或钻孔的信息和数据[100⁃108]如表1所示。大部分研究点位在PETM界线附近地层中有汞异常值的出现,这支持北大西洋火成岩省的火山活动为PETM事件的触发机制。

图 4 PETM转折期北大西洋火成岩省及研究地区分布
Figure 4. Regional map of the location of the North Atlantic Igneous Province (NAIP) and study area at 56 Ma
表 1 PETM汞研究地区信息表
Table 1. PETM Hg records
研究点位 位置 经纬度 古环境及古水深 氧化还原状态 氧化还原变化发生时间 25/11-17[55] 北海盆地 59°3′27″ N,2°29′7″ E 深海盆地 / / 22/10a-4[56] 北海盆地 57°44'8.47″ N,1°50'26.59″ E 深海盆地 / / 23/16b-9[44] 北海盆地 57°26′50.208″ N,02°08′27.624″ E 深海盆地 / / 30/14-1[99] 北海盆地 56°33′37″ N,2°38′08″ E 深海盆地 / / Fur Island[55] 北海盆地 56°49′51″ N,8°58′45″ E 浅海 缺氧[100](生物标志化合物) CIE期间 E-8X[56] 北海盆地 55°38′13.42″ N,04°59′11.96″ E 深海盆地 硫化[21](Mo同位素) CIE起始—主体期间 BH09/2005[55] 北冰洋 77°54′09″ N,16°12′59″ E 近岸盆地 缺氧[101](Th/U) CIE期间 ACEX[55] 北冰洋 87°52′12″ N,136°12′41″ E 浅海近岸[102](0~200 m) 硫化[102](Mo同位素) CIE主体阶段 Zumaia[98] 比利牛斯前陆盆地 43°18′4.5″ N,02°15′31.2″ W 深海盆地[103](1 000 m) 缺氧[103](遗迹化石) CIE期间 Lussagnet[98] 比利牛斯前陆盆地 43°46′4″ N,00°13′12″ W 浅海(碳酸岩台地) / / Serraduy[98] 比利牛斯前陆盆地 42°19′25″ N,00°34′ 20′ ′E 冲积平原—海岸平原 / / Esplugafreda[98] 比利牛斯前陆盆地 42°14′50″ N,00°45′13″ E 冲积平原 / / Ancora[99] 美国东部新泽西州 39°41′32″ N,74°50′56″ W 大陆架[104](110 m) 缺氧[105](底栖有孔虫) CIE起始—主体期间 Wilson Lake[99] 美国东部新泽西州 39°39′21″ N,75°02′52″ W 大陆架[104](90 m) 缺氧[106](氧化还原敏感细菌) CIE期间 Bass River[55] 美国东部新泽西州 39°36′42″ N,74°26′12″ W 大陆架[104](145 m) 缺氧[105](底栖有孔虫) CIE起始—主体期间 Millville[97] 美国东部新泽西州 39°24'0.00" N,75°4'48.00" W 大陆架[104](120 m) / / Blake Nose[97] 北大西洋 30°03.1860′ N,76°21.4712′ W 深海(1 500 m) / / Dababiya[96] 埃及 25°30′ N,32°31′ E 浅海(150~175 m) 缺氧[107](氧化还原敏感元素) CIE主体阶段 1262[99] 南大西洋 27°11′9″ S,1°34′37″ E 深海[108](3 600 m) 次氧化[108](MnEF) CIE开始约80 kyr -
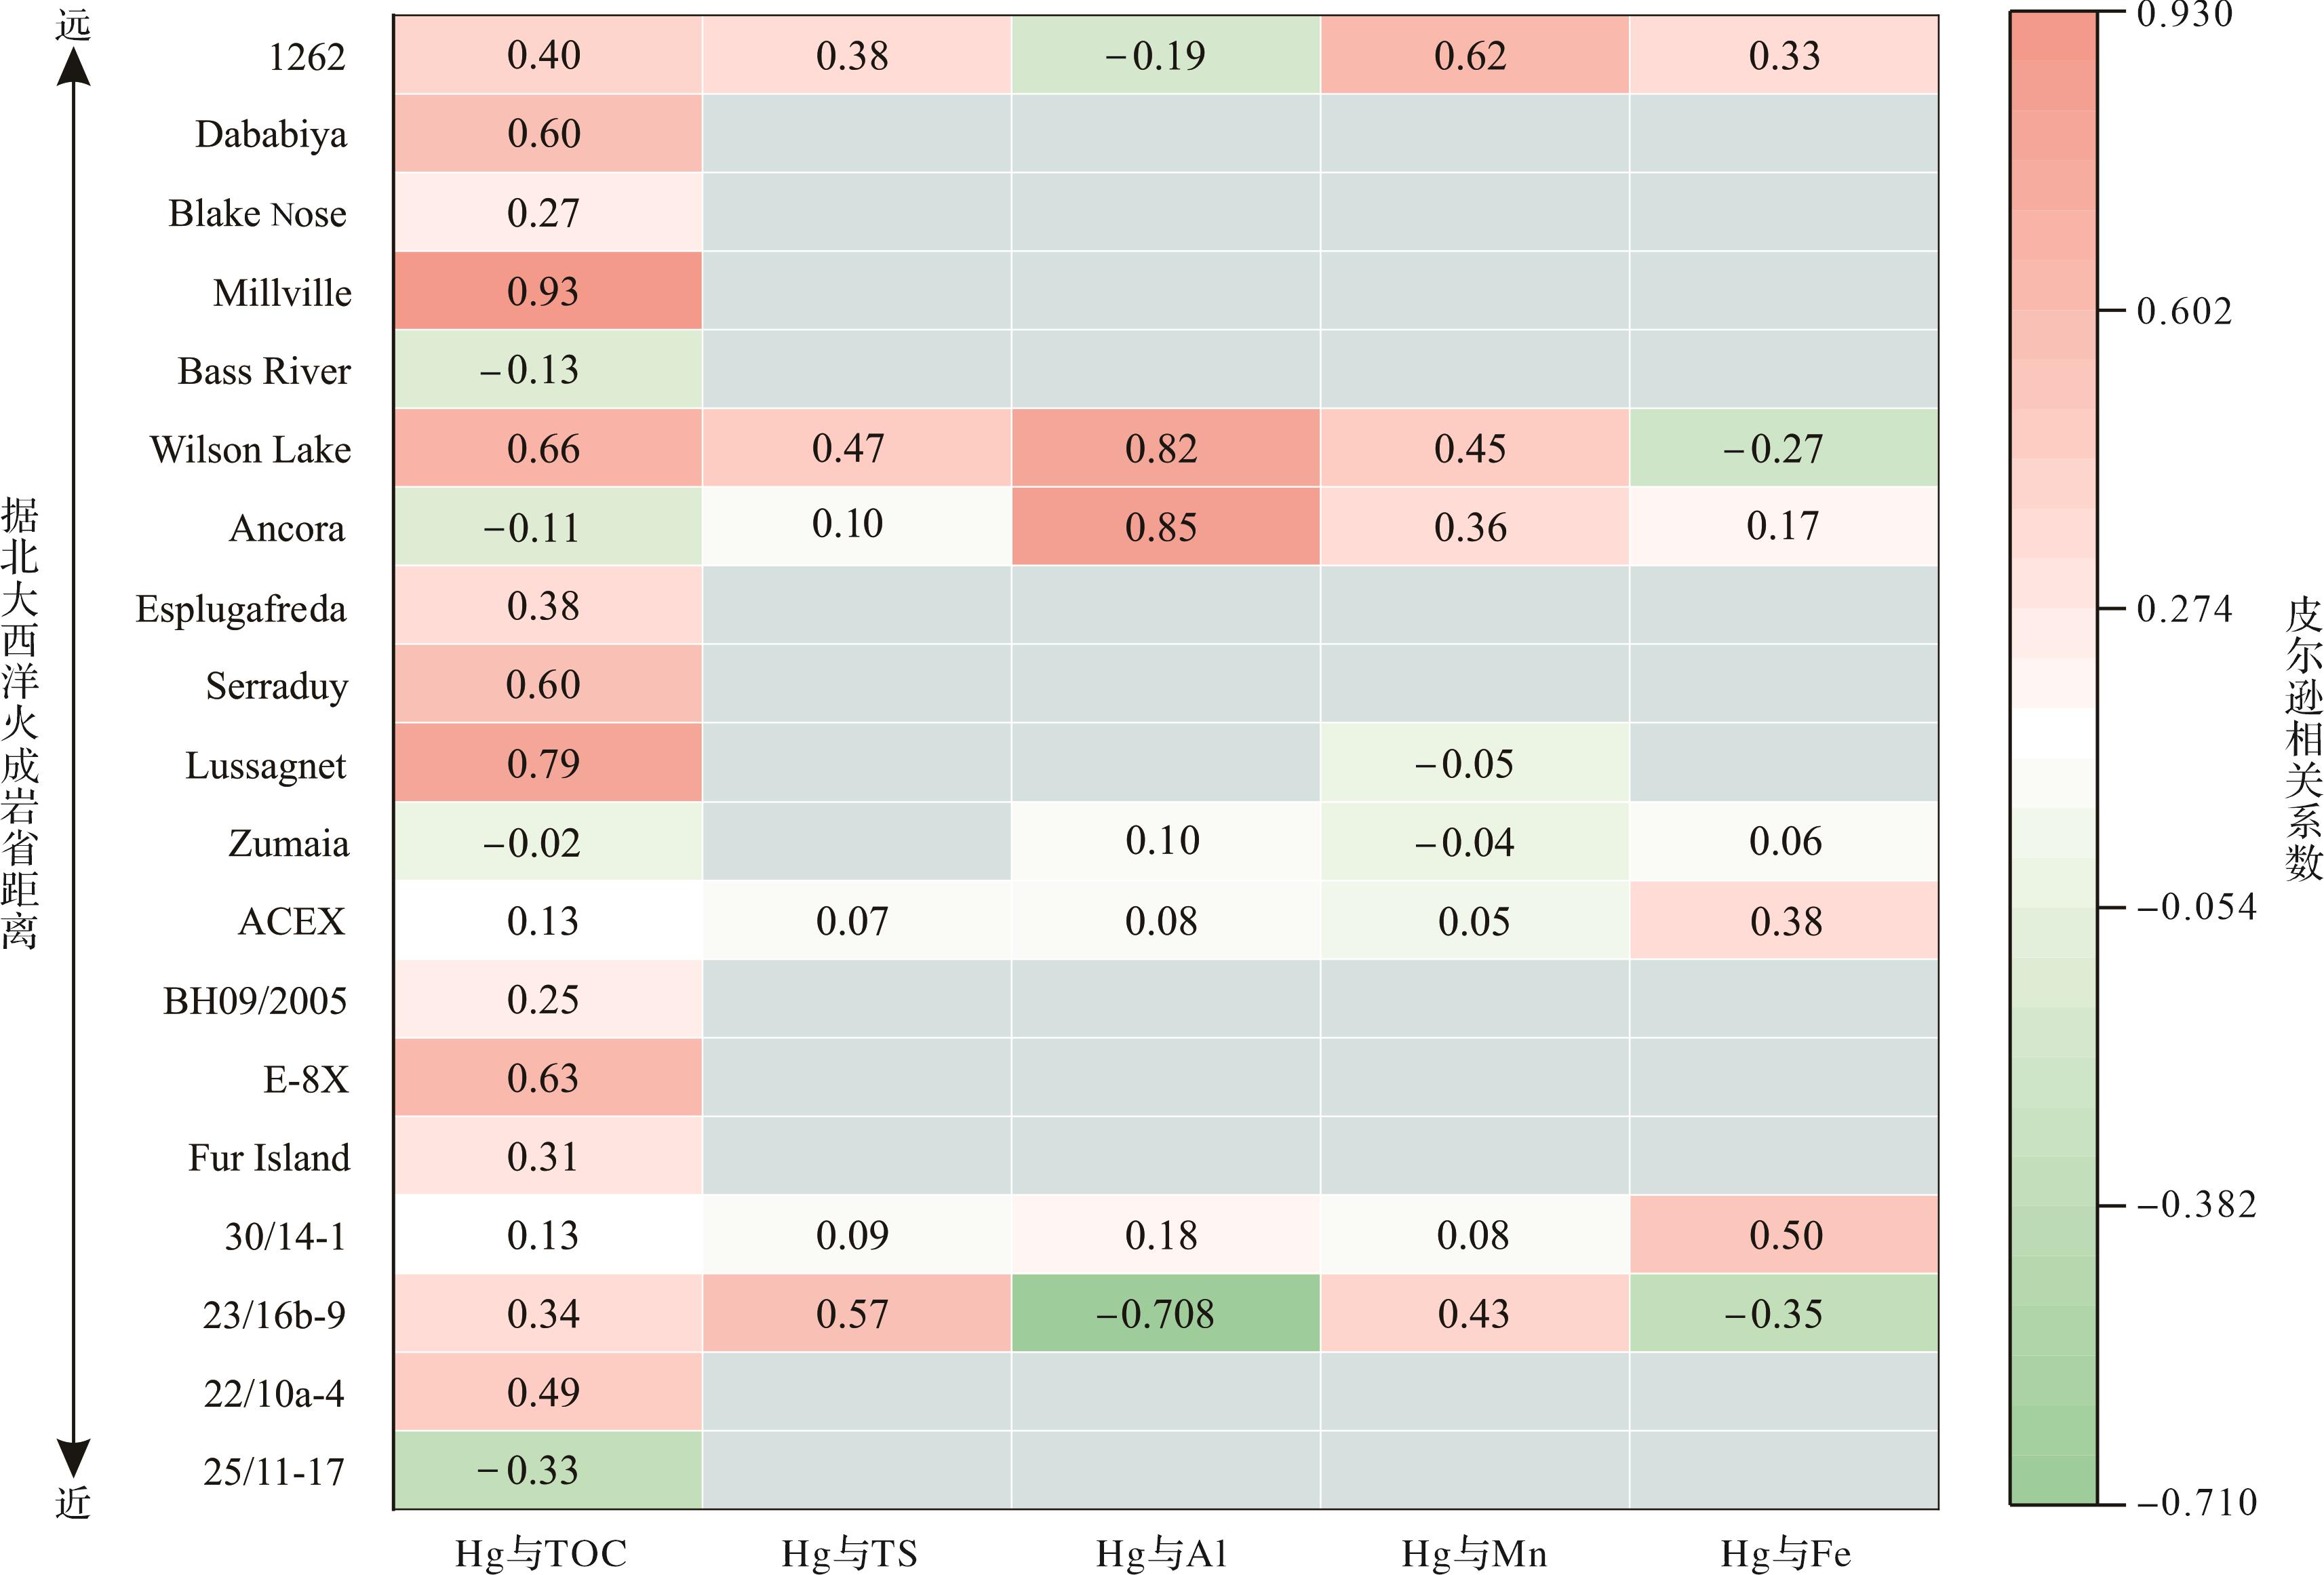
沉积物中Hg主要赋存于有机物、硫化物、黏土矿物等矿物相。Hg含量与表示赋存相的总有机碳(TOC)含量、总硫(TS)含量、铝(Al)含量、铁(Fe)含量及锰(Mn)含量进行标准化(计算汞/赋存相比值),可以评估沉积物中的Hg富集程度及其异常机制探究[51⁃52,109⁃110]。此外,Hg与TOC、TS、Al、Fe和Mn之间的相关性强度可以用来表示Hg的主要赋存相。
不同沉积环境(氧化还原变化)会影响Hg的循环和赋存矿物相。在氧化条件下,有机质通常是地质历史时期和现代海相或湖相沉积物中较为重要的赋存相,其主要以Hg-OM络合物形式存在[87,111]。在这种情况下,沉积记录中的汞浓度通常需要与沉积物中的TOC含量进行标准化处理,标准化后Hg/TOC高值可以排除有机质增加导致的沉积物中汞赋存增加的情况,从而可以作为指示火山活动的指标[112],但当TOC小于0.2%时,Hg/TOC比值不再适用[51]。在大部分PETM站点中,前人只报道了Hg和TOC的数据,且在大部分地点两者呈适中至较强的相关性(图5),而Zumaia、Lussagnet、Serraduy、Esplugafre da、Black Nose等研究区域记录大部分样品的TOC小于0.2%,使得Hg/TOC的值存在很大的不确定性。在PETM时期,Bass River地区处于缺氧环境[105],且Bass River剖面的Hg与TOC相关性较差,不能简单地将其赋存矿物认定为有机物。位于深海盆地环境的25/11-17站点,Hg与TOC之间的相关性较弱,且不显著,可能与钻孔中汞浓度极高有关[99]。此外,在缺氧及硫化条件下,Hg可能会逃逸,使得沉积物中的Hg信号减弱;同时,水体中存在游离的硫化物,汞更有可能通过形成汞—硫化物络合物或被铁硫化物吸收的方式与硫化物相结合[113],从而使汞吸附在硫化物之中[52,114]。例如,位于北海盆地的深海盆地23/16b-9(图5),Hg与TS的相关性较高,但标准化后的Hg/TOC与Hg/TS呈相同的变化趋势,有机物和硫化物可能均为Hg的赋存相。在静海环境下,局部地区黄铁矿埋藏增加,可能会导致局部汞含量下降[51,109]。在有机质和硫化物含量较低的情况下,由于黏土矿物具有较高的表面反应性,汞也会吸附在黏土矿物表面[84,115⁃116],位于新泽西州的大陆架Ancora和Wilson Lake剖面(图5)。在氧化环境中的铁锰氧化物也可能吸附汞[52,117⁃118],如30/14-1和1262(图5)。此外,ACEX站点较为特殊,其在PETM时期为缺氧—硫化环境[102],处于浅海近岸环境,沉积物中的Hg与TOC、Al等元素相关性较差,不能确定其赋存相。

图 5 研究点位沉积汞的主要赋存相分析
Figure 5. Dominant host phases of Hg at the study site
-
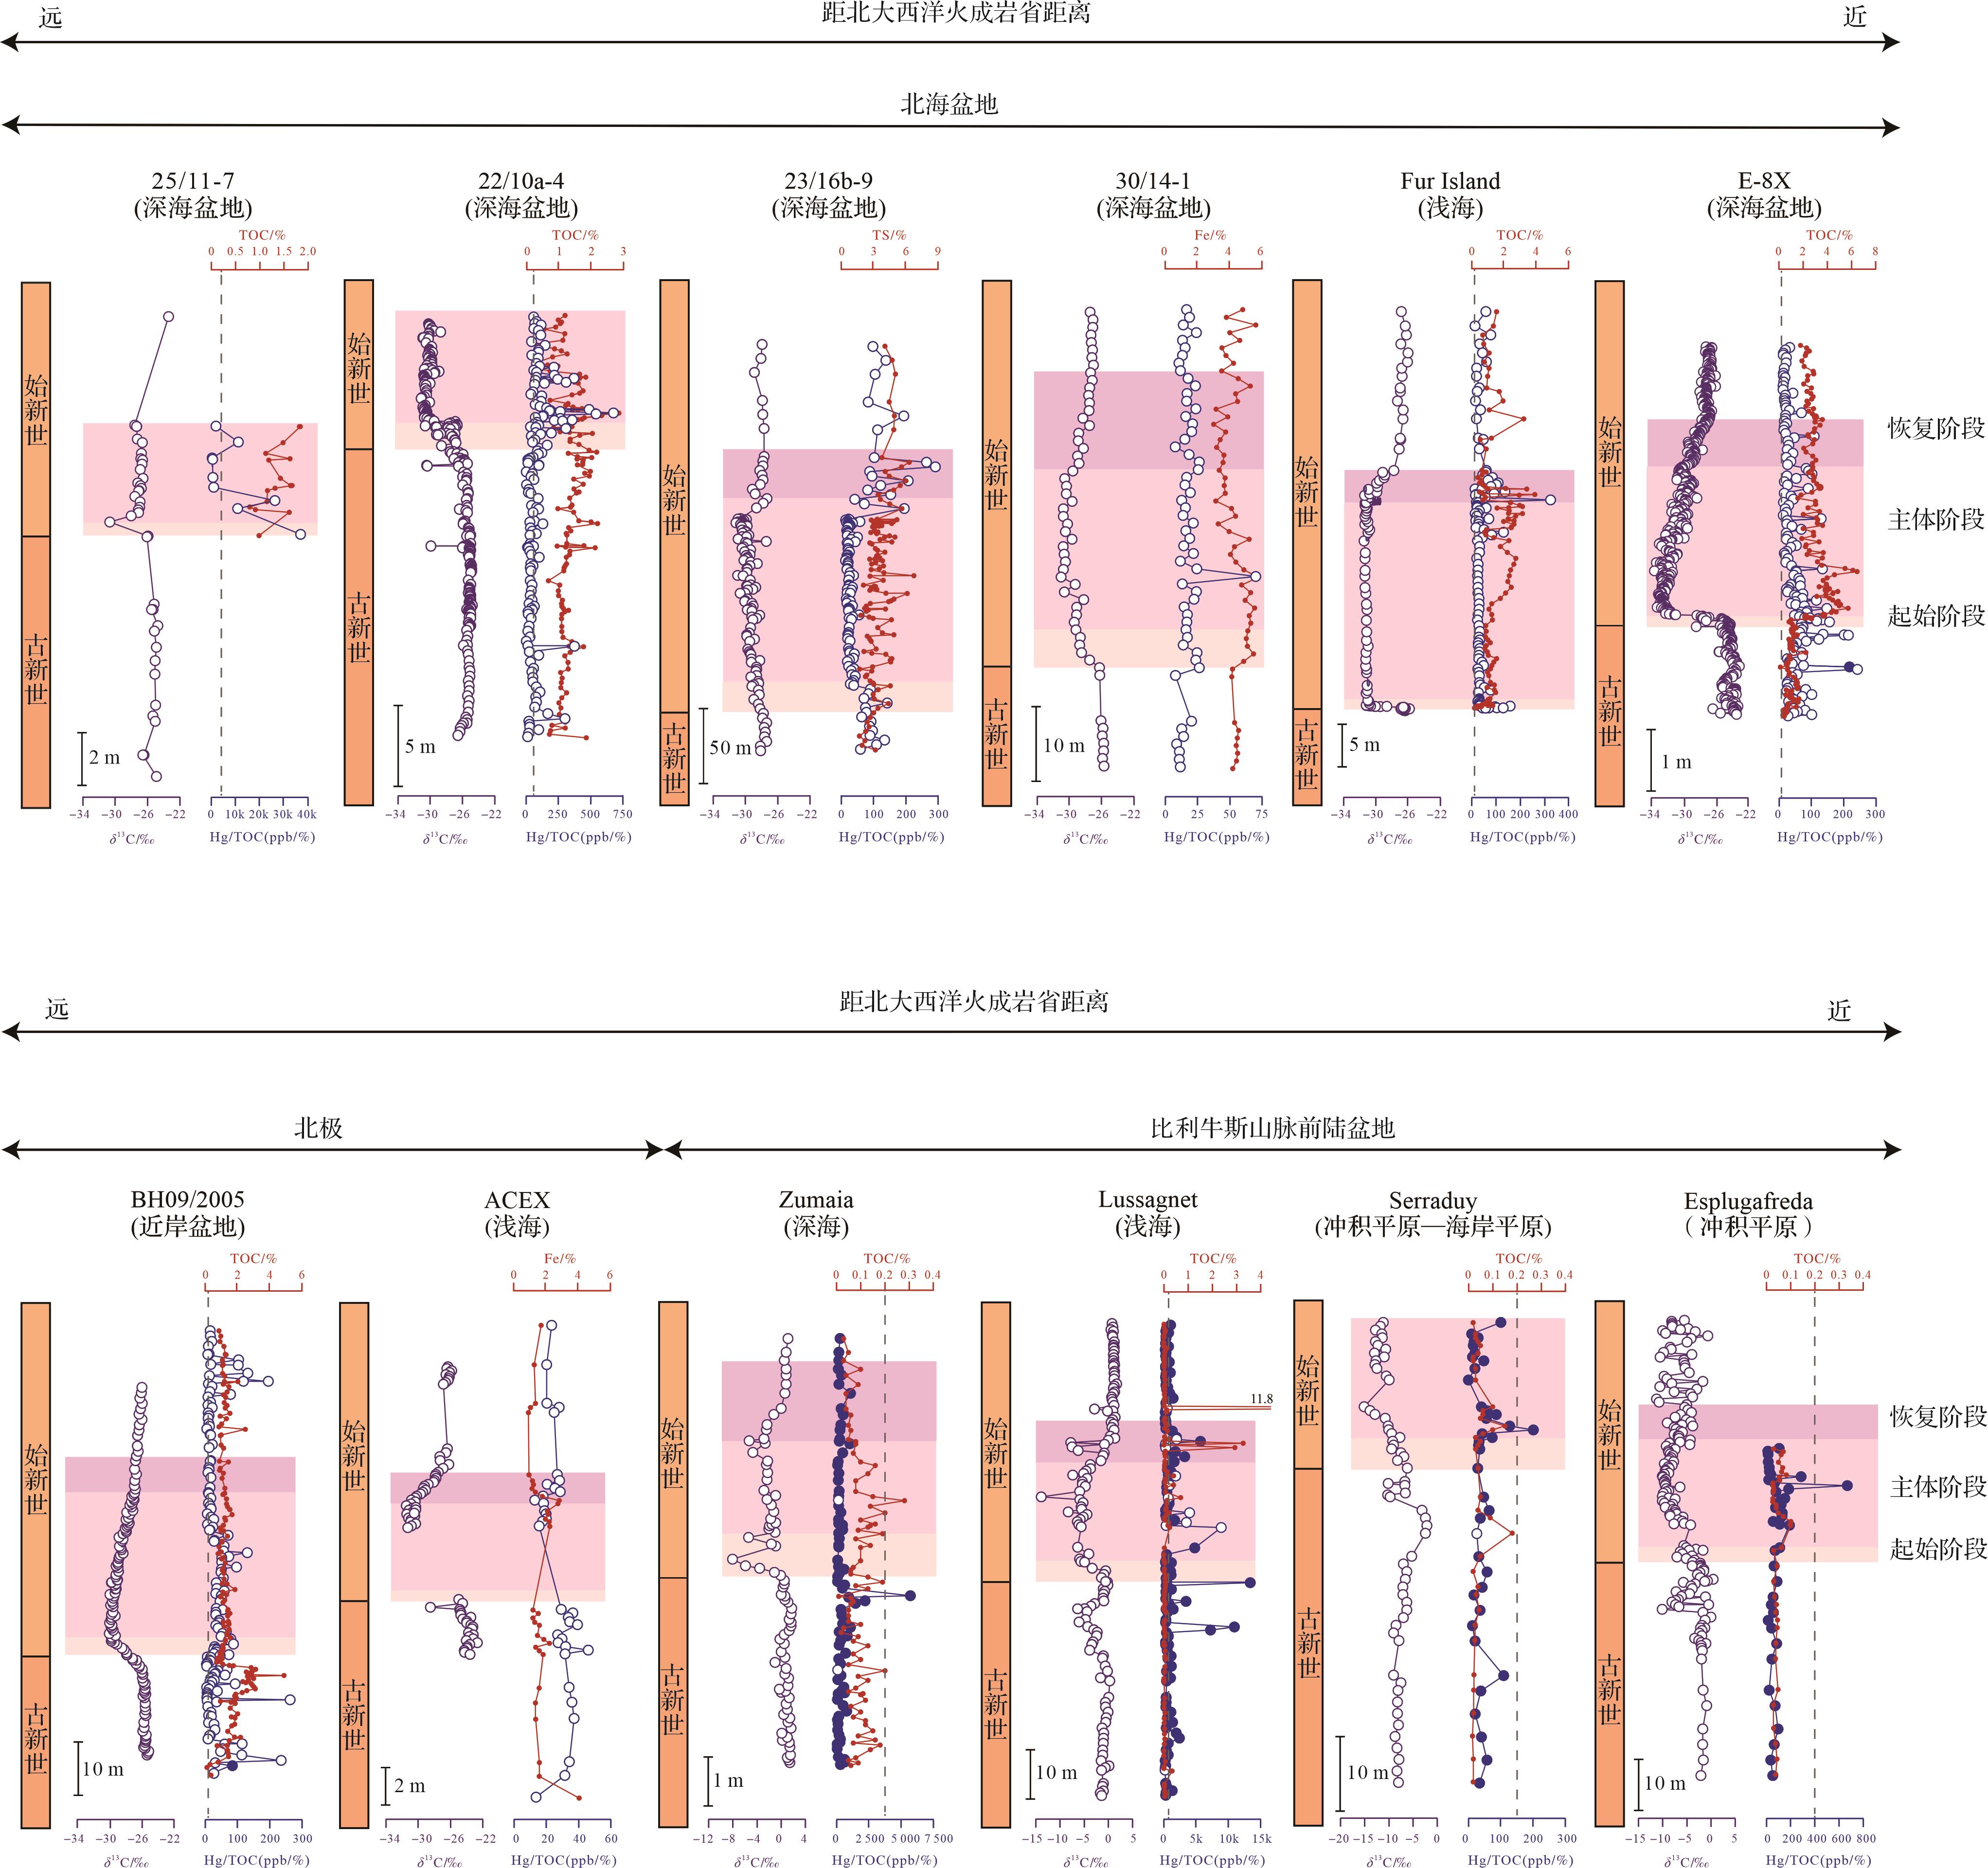
依据Jin et al.[99]将北海盆地、北极和比利牛斯前陆盆地等地划分为邻近NAIP地区(距NAIP 4 000 km以内)。位于北海盆地的25/11-17、22/10a-4、23/16b-9在PETM期间以泥岩与砂岩沉积为主[44,55,119],而E-8X(北海盆地)与丹麦北部的Fur Island剖面以泥岩与火山灰层互层沉积为主[55⁃56]。ACEX钻孔位于北冰洋中部的罗蒙诺索夫海岭,其主要岩性为富含有机物的泥岩[99]。钻孔BH09/2005位于斯瓦尔巴群岛的中央盆地,以页岩沉积为主,在古新世—始新世期间陆源碎屑输入增加[120]。Zumaia、Lussagnet、Serraduy、Esplugafreda位于比利牛斯前陆盆地,Serraduy、Esplugafreda为陆相剖面,以粉砂质泥岩沉积为主[98]。Zumaia、Lussagnet在PETM时期处于海洋环境,其中Lussagnet地区主要为灰岩沉积,在PETM时期可见陆源输入的砂岩及泥岩扰乱Lussagnet的碳酸盐岩沉积[98];Zumaia在PETM前后以泥灰岩与灰岩互层沉积为主,在PETM时期转变为泥岩,说明在此期间陆地径流增加[121]。
在碳同位素负漂(Carbon Isotope Negative Excursion,CIE)开始之前,北海盆地及北冰洋的钻孔(22/10a-4、23/16b-9、E-8X、Fur Island、BH09/2005、AECX)Hg浓度及Hg/TOC(Hg/TS)值开始剧烈波动,整体高于背景值(图6)。在Zumaia、Lussagnet、Esplugafreda等研究区域也出现了不同程度的Hg异常。随后在CIE期间,大部分地区均出现了Hg的异常。在CIE之后,仅有23/16b-9、BH09/2005、E-8X存在Hg异常。

图 6 PETM事件邻近NAIP地区的碳同位素、汞浓度及TOC(TS、Fe)数据
Figure 6. Carbon isotope, Hg concentration and TOC (TS, Fe) data from neighboring NAIP areas during the PETM
-
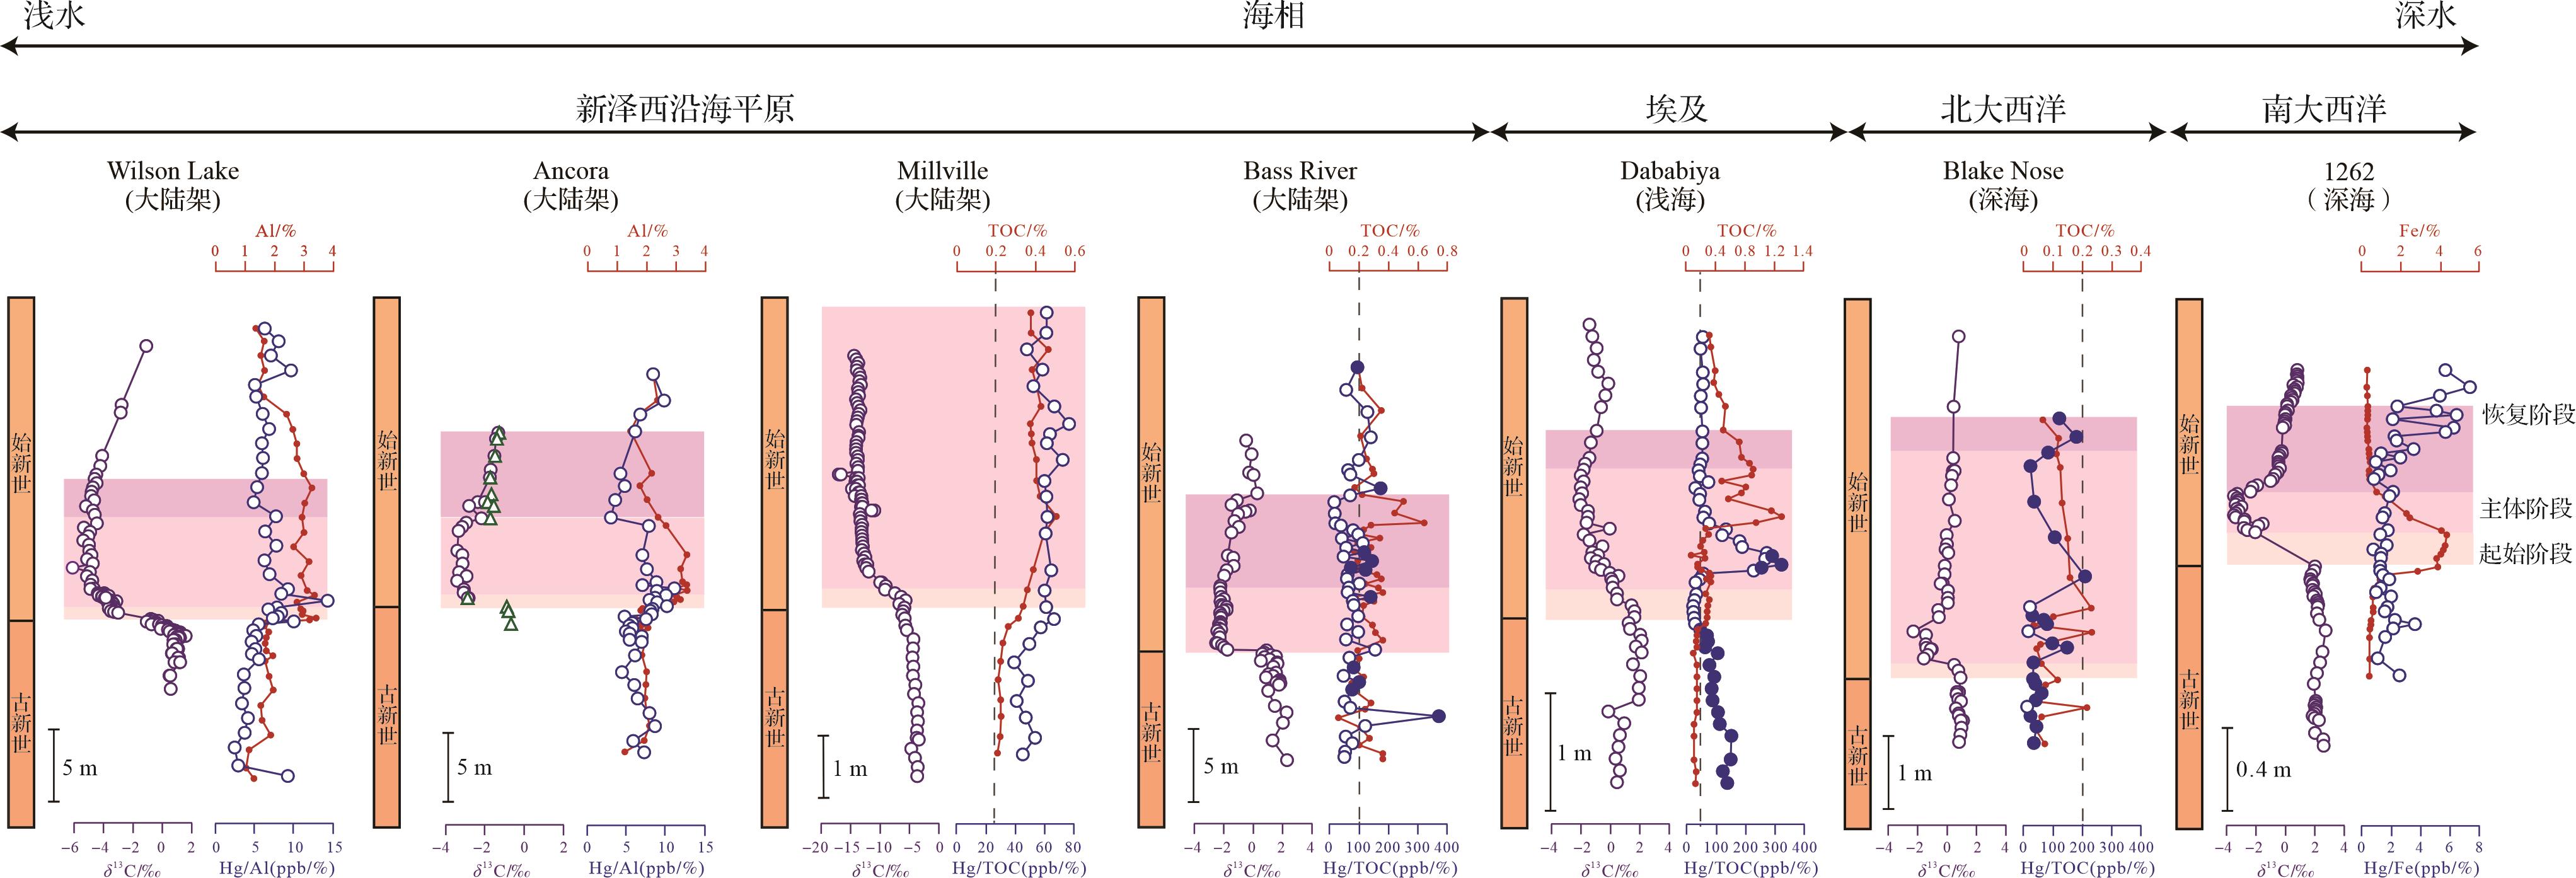
位于新泽西沿海平原的Bass River、Wilson Lake、Ancora在PETM之前以富含海绿石的砂岩沉积为主,Wilson Lake在PETM期间粒径逐渐变细转化为泥岩(从中—细砂,到粉砂,再转变至黏土),而Bass River、Ancora地区没有这种过渡段沉积记录[105]。Millville(新泽西沿海平原)以富含有机质的粉砂岩沉积为主[97]。位于北大西洋的Blake Nose钻孔主要岩性为富含碳酸盐岩的远洋沉积物[97]。ODP 1262(南大西洋)在PETM事件发生期间由碳酸盐岩突变为泥岩[99]。位于埃及的Dababiya在PETM期间主要由泥灰岩及灰质页岩转变为含磷结核的泥灰岩[122]。
CIE之前,Wilson Lake、Ancora、Millville、Dababiya及Blake Nose地区的Hg浓度相对较低(图7),而在CIE期间Hg含量保持相对较高,然后下降至CIE之前的值,而Bass River地区是在CIE之后Hg含量升高。1262钻孔Hg浓度在整个PETM区间变化较小。

图 7 PETM事件远离NAIP地区的碳同位素、汞浓度及TOC(Al、Fe)数据
Figure 7. C isotope, Hg concentration and TOC (Al, Fe) data for PETM remote from the NAIP area
-
汞浓度异常的产生往往归因于沉积物中汞含量的增加[52,124]。然而,并不能轻易地将沉积物中汞浓度的增加解释为火山活动的结果[109,125]。沉积物中汞浓度变化受到多个因素的控制,如陆源输入、火山排放、海水氧化还原等[126]。PETM时期各个地区沉积物中汞浓度变化的模式不同,这可能与上述影响因素有关。
-
北大西洋火成岩省的火山活动主要通过火山喷发及热液喷口复合体的喷发来影响汞循环。火山喷发主要有两种方式:第一种为苏特赛式(Surtseyan-type)喷发,这种喷发方式以在浅海海底的一个火山口反复爆发式喷发为特征,当玄武质岩浆与海水接触时会再次发生爆炸,产生大量细粒物质(火山灰),此时会释放出CO2、Hg等挥发性物质至大气,也会有部分Hg保留在海水之中[55];第二种为玄武岩溢流式喷发,即岩浆沿一个方向的大断裂(裂隙)或断裂群上升,喷出地表,此时CO2、Hg会随之释放至大气之中。而热液喷口复合体则是由岩浆侵入至有机质盆地,在其边缘位置所形成的。热液喷口复合体的喷发会将Hg等挥发性组分传输到海洋之中,CO2、CH4及部分Hg也会随之被释放至大气系统[55]。
上述两种方式都会对汞富集模式产生影响,火山的间接性喷发可能形成单个的汞/赋存相比值峰值,如30/14-1钻孔在CIE期间仅存在一个异常峰值,这可能为火山间接性喷发所致。而连续喷发可能会使汞/赋存相比值持续异常(如E-8X、Fur Island、BH09/2005等)。在CIE之前,Fur Island地区Hg异常峰值出现的层位与地层记录中的NAIP火山灰层相对应[55],E-8X钻孔内也存在少量薄层火山灰的沉积记录[56]。在这一阶段,BH09/2005钻孔Hg异常峰值与187Os/188Os比值大幅下降[67]相对应。这说明PETM开始之前,NAIP连续喷发所释放的汞可能已部分注入附近的海水中,从而使得NAIP邻近海域沉积记录中的汞浓度出现异常。NAIP的连续喷发也会向大气注入大量CO2,从而促使PETM事件的发生。在CIE恢复阶段,Fur Island地区汞富集层位与多层火山灰层位相对应[55],说明在此期间NAIP也发生了火山活动。
热液喷口复合体产生的汞异常变化主要表现为在岩浆侵入后出现较大的汞/赋存相比值异常,由此产生的汞异常可能是区域性的,如25/11-17站点报道的特殊Hg异常值(Hg/TOC=95 700 μg/kg)。Jones et al.[55]认为这可能是热液喷口复合体喷发致使大部分Hg转移到水体中,导致局部Hg浓度升高,但该钻孔缺少岩心记录,PETM阶段划分不确定,且有油砂沉积,油气迁移也可能导致地层中汞分布不均匀[55],因此,并不能简单地将其解释为热液喷口复合体喷发。
-
深海环境中,沉积物中的Hg主要来自大气的直接沉降。大陆环境中,火山活动释放的Hg通过降雨直接沉积在土壤之中或被植物叶片吸收。相比之下,在浅海近岸环境中,沉积物中的Hg既可以来源于大气沉降,也可以来源于陆源输入,从而使得浅海近岸环境中的汞富集程度高于深水环境[52]。位于比利牛斯前陆盆地的Lussagnet剖面在PETM时期主要为浅海近岸环境,PETM之前以碳酸盐岩沉积为主,在PETM时期可见陆源输入的砂岩及泥岩扰乱碳酸盐岩沉积[98],可能有大量的汞从陆源输入,从而使得Lussagnet地区汞富集程度远高于邻近地点深海Zuamia剖面及陆相Serraduy、Esplugafreda剖面[98]。此外,Zuamia剖面在PETM时期岩性由灰岩转变为泥岩,可能是区域水循环加强所致陆地径流增多[121],从而使PETM期间Hg含量增加。BH09/2005、ACEX及新泽西沿海平原等研究区域在PETM时期也处于浅海近岸的沉积环境,有证据证明上述研究区域在PETM期间陆地径流增多[20,107,120,127],陆源输入增多,使得BH09/2005、Wilson Lake、Ancora、Dababiya研究区域沉积物中的Hg浓度在PETM期间升高。PETM时期,北海处于局限盆地环境,在CIE主体阶段,钻孔22/10a-4的C/N比值及古生物变化可指示陆源输入增多[119],与此同时,邻近钻孔E-8X钻孔沉积了少量薄层火山灰[56],说明CIE期间22/10a-4的Hg异常可能是火山输入与陆地径流混合形成的。
因此,不能将浅海近岸环境沉积物中汞异常简单地解释为火山来源,需借助其他指标进一步研究。
-
仅仅根据沉积物中汞元素浓度来追踪火山活动记录还存在极大的不确定性。而汞同位素可以有效地示踪沉积物中汞元素的来源(汞同位素示踪汞来源原理见上文)。迄今为止,PETM只有两个研究地区测定了汞同位素数据[44,128],其中AECX地区仅报道了一个汞同位素数据点[128]。
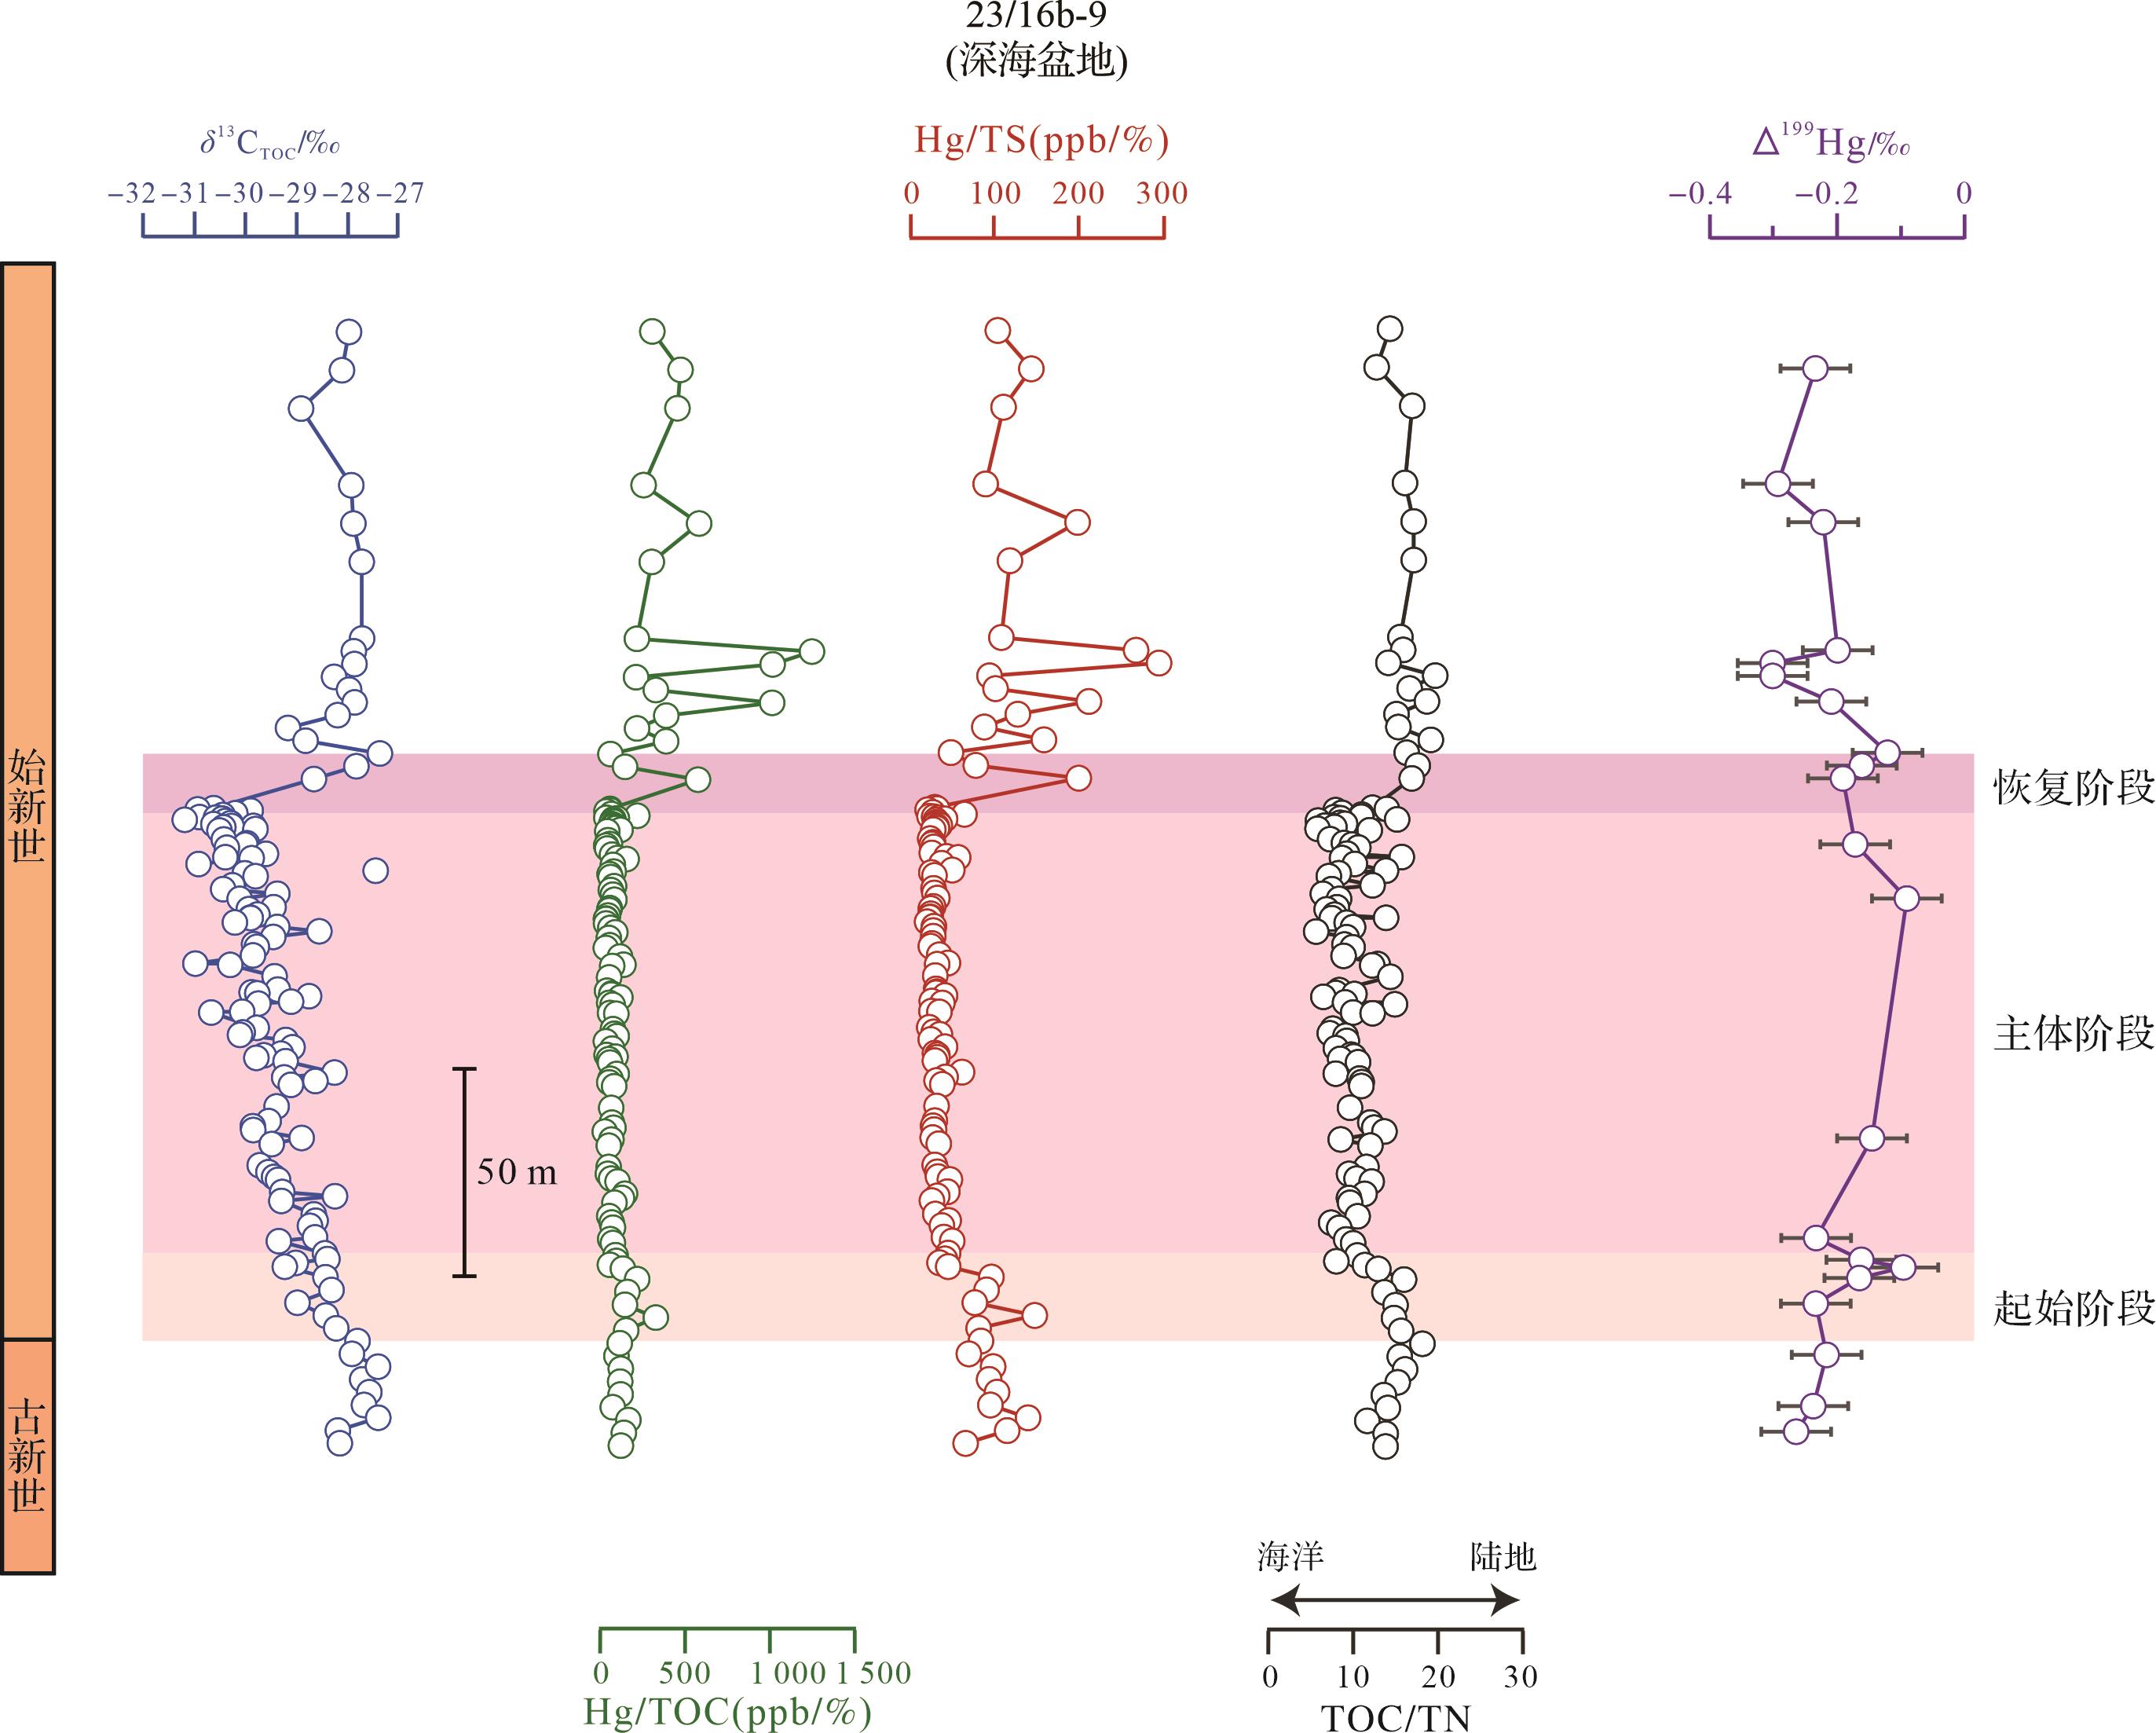
在23/16b-9站点,Δ199Hg的变化范围为-0.3‰~-0.09‰(图8)[44]。在PETM开始之前Hg/TS值出现峰值(从60.35 μg/kg至134.65 μg/kg),Δ199Hg为负值,趋于-0.3‰,结合邻近钻孔22/10a-4Cerodinium depressum和Senegalinium spp.丰度变化,表明在PETM开始之前,北海盆地地表水盐度降低和营养水平升高,陆源输入有所增加[119],使得23/16b-9站点沉积了大量陆源输入的汞,从而使CIE之前的Δ199Hg为负值。在CIE起始阶段,Δ199Hg发生正偏趋于0,23/16b-9站点在此期间出现两次Hg/TS峰值,Δ199Hg在第一次峰值出现后开始正偏。与此同时,北海盆地邻近站点E-8X、22/10a-4、30/14-1及斯瓦尔巴群岛的BH09/2005钻孔也出现汞异常峰值,说明火山Hg输入短暂增加。此外,Os同位素数据也可为这一阶段火山活动的爆发提供证据[68]。在CIE恢复阶段,Hg浓度与Hg/TS值出现峰值,Δ199Hg值发生正偏,表明在此阶段可能存在火山活动。同时,TOC/TN比值也有所升高,说明陆源输入有机质增多[129],这可能反映火山来源Hg多于陆地输入的Hg。而CIE过后,Δ199Hg开始负偏且有Hg峰值的出现,TOC/TN比值与CIE恢复阶段变化较小,说明这一阶段的Hg可能源于陆地输入,或为火山来源Hg少于陆地输入的Hg。此外,岩浆侵入至富有机质沉积物所释放的汞也可能呈现负的Δ199Hg[126],但在23/16b-9站点缺乏与PETM时期相对应的热液喷口沉积记录。因此,23/16b-9站点汞同位素仅能确定CIE起始阶段的Hg为火山来源,但无法确定负Δ199Hg值所指示Hg的确切来源。

此外,PETM碳同位素负偏主体阶段,23/16b-9汞浓度的变化与汞同位素波动不能完全对应。在主体阶段,23/16b-9的Hg浓度与Hg/TS值基本保持不变,且TOC/TN比值无明显下降趋势,但Δ199Hg发生正偏,已有的数据不能完全解释在此阶段Δ199Hg的变化[44]。归根结底,仅凭单个研究区域的汞同位素数据很难区分汞的确切来源。
-
利用汞富集及其同位素示踪PETM时期NAIP的火山活动,可以为探究大火成岩省与PETM之间因果关系提供有力证据。现有的工作发现沉积物中汞的富集情况主要呈空间分布且受沉积环境影响,与NAIP距离越近,汞富集程度越高,这支持了汞富集事件与NAIP火山活动之间的联系[55⁃56,98]。此外,已发表的汞同位素数据也为PETM期间存在火山活动提供了证据[44],但目前仍存在许多未解决的问题。
1) 使用汞浓度及汞同位素指示古火山活动
对于大部分站点,研究人员仅利用汞与总有机碳标准化,未考虑氧化还原等条件的影响。而沉积物中汞的含量变化受陆源输入、火山排放、氧化还原条件及汞的赋存情况等的影响,若仅考虑汞赋存于有机质的情况可能会低估了汞的富集程度。此外,仅有少部分研究站点有火山灰或Os同位素等证据证明汞为火山来源[55,97]。但并非所有的汞富集都来自火山的输入,仅根据沉积物中汞元素浓度不能确定汞元素的来源。此外,汞同位素示踪PETM时期沉积物中汞元素的来源仍存在很多问题。前人研究将接近于零的Δ199Hg值解释为火山来源[44]。但对于负Δ199Hg值的解释还存在争议,在陆地体系(土壤、植被和沉积物)中Δ199Hg值以负值为主[92],而岩浆侵入富有机质盆地发生接触热变质作用时,Δ199Hg值也可能偏负[126],所以在使用汞元素及其汞同位素示踪火山时,需从多方面进行考虑。
2) 对NAIP侵位的认识尚不明确
目前的研究认为NAIP发生的剧烈岩浆活动,火山去气或岩浆侵入富含有机质的沉积物,向大气释放了大量温室气体(CO2、CH4),导致全球范围的持续升温,使得碳循环系统不稳定性增加,最终突破系统临界点,诱发巨量还原性碳库(天然气水合物、冻土)分解释放,从而使得PETM事件的发生[56]。然而,靠汞含量及汞同位素仅能为北大西洋火成岩省的火山活动与PETM存在时间联系提供证据,尚不能确定轻碳的来源及北大西洋火成岩省的侵位机制。
3) 缺乏全球范围的研究
想要了解北大西洋火成岩省的喷发规模及强度,需要在不同的环境和不同的沉积相背景下对全球范围展开研究。目前已发表的汞数据主要集中在靠近NAIP喷发区域的北半球,特别是汞同位素数据相对较少,部分地区汞富集的时期与已有的汞同位素所指示的不完全相同。此外,沉积汞研究区域较为局限,主要集中于邻近NAIP的浅海或深海盆地。还需要对全球范围内其他沉积环境(如开阔海环境及陆地环境)地区展开汞含量及其同位素研究。
-
总体来说,对于PETM时期沉积物中Hg元素记录和火山活动的关系研究还处于起步阶段,仅靠Hg元素含量变化不能准确地示踪火山活动记录,需要借助汞同位素和其他指标综合示踪火山活动记录。此外,还需借助地球系统模型等工具来定量研究汞同位素所指示的火山活动的碳排放量,以便进一步研究火山活动对气候环境变化的影响,从而更好地预估地球未来气候的变化趋势。
A Review of Mercury as Proxy for Volcanism During the Paleocene-Eocene Thermal Maximum
-
摘要: 意义 自工业革命以来,人类在使用化石燃料的过程中不断向大气排放CO2等温室气体,引起了剧烈的气候环境扰动和严重的生物危机。古新世—始新世极热事件(Paleocene-Eocene Thermal Maximum,PETM, ~56 Ma)转折期发生了巨量的碳排放事件,碳排放速率与当前的排放进程最为接近,探索PETM时期的碳排放对地球宜居性影响的过程和机制,可以为预估地球未来气候变化趋势提供地质案例,具有重要的科学意义。 【进展】 关于PETM碳排放的触发机制问题目前仍存在争议,已有研究证实北大西洋火成岩省(North Atlantic Igneous Province,NAIP)的岩浆活动与PETM之间存在时间耦合性,表明NAIP可能触发了这一地球宜居性扰动事件,但是目前该转折期火山活动和气候环境波动的因果关系尚不明晰,其最大的难点在于如何在沉积岩中示踪火山活动记录。近年来,沉积物中的汞元素浓度及其同位素已被广泛用于示踪地质历史时期的火山活动。但是,目前对PETM事件的汞记录研究主要集中在靠近NAIP喷发区域的近岸地区,缺乏对远离喷发中心的开阔海地区的研究,制约了对NAIP活动影响范围和环境效应的认知。 【结论与展望】 本文针对PETM事件汞沉积示踪古火山活动的研究现状进行了系统的回顾,梳理了NAIP与PETM之间的联系,强调未来需借助汞同位素等其他指标踪及地球系统模型等进一步准确示踪火山活动,以深化对 PETM 的认知并为预估未来气候趋势提供依据。
-
关键词:
- 古新世—始新世极热事件 /
- 北大西洋火成岩省 /
- 汞浓度及同位素 /
- 海洋缺氧
Abstract: Significance Since the beginning of the Industrial Revolution, human activities have resulted in the sustained release of greenhouse gases, including carbon dioxide (CO2) into the atmosphere. This has been primarily driven by the combustion of fossil fuels, and threatens profound climatic disturbances, environmental transformations and widespread biological crises. Similarly, the Paleocene-Eocene Thermal Maximum (PETM, ~56 Ma) represents a period of massive carbon release into the atmosphere, occurring at a rate strikingly comparable to current anthropogenic carbon emissions. It is of paramount importance to gain a comprehensive understanding of the processes and mechanisms that regulated carbon release during the PETM. Such knowledge can provide valuable insights into the impact of these emissions on the Earth’s habitability. Furthermore, these findings have significant implications for our attempts to gain an understanding of present-day and future climate change. It is consequently of the highest scientific importance to study this ancient climatic event, as it offers a natural experiment for evaluating the potential consequences of contemporary carbon emissions on global climate dynamics and ecological stability. Progress The trigger of the PETM has been the subject of considerable debate among scholars in the past few decades. Despite extensive research, the exact mechanism that instigated the massive carbon release during the PETM remains unresolved, although the findings of recent studies have indicated a temporal correlation between magmatism in the North Atlantic Igneous Province (NAIP) and the PETM. This evidence suggests that volcanic activity in NAIP was likely to be have been the trigger of the climatic perturbation. While this hypothesis adds to our insights into the triggering mechanisms of PETM events, our understanding of the exact cause-and-effect relationship between volcanic activity and climate fluctuations during this transition period remains incomplete. A significant challenge to a full establishing this relationship is the difficulty of accurately tracing volcanic activity in the sedimentary record during this period, due to the complex nature of volcanic products and their subsequent alteration over millions of years and the problem of identifying and distinguishing between different volcanic events. Recently, mercury (Hg) concentrations and their isotopic compositions in sediments have emerged as promising tools for tracing volcanic activity throughout geological history. However, in the present study, the focus on the Hg record of the PETM was largely limited to near-shore areas proximal to the NAIP eruption sites. Few studies have explored the Hg concentrations in sediments from open-ocean regions located at a considerable distance from the eruption centers, leaving a significant gap in our understanding of the broader extent of the influence of the NAIP. The spatial limitations of this study restricted our ability to fully assess the global impact of volcanic emissions on the Earth’s climate and ecosystems during the PETM. Conclusions and Prospects This paper provides a comprehensive review of the current state of research on the use of mercury deposition as a tracer of ancient volcanic activity during the PETM. It identifies existing research limitations and suggests key directions for future studies. It also reviews the possible relationship between the volcanic activity of the NAIP and the climatic events of the PETM, emphasizing the need for further interdisciplinary research to resolve outstanding issues and refine our understanding of this critical period in the Earth’s history. -

图 4 PETM转折期北大西洋火成岩省及研究地区分布
Geo⁃map adapted from Ron Blakey© 2016 Colorado Plateau Geosystems Inc. https://deeptimemaps.com/ (white circles. sites with Hg and associated data; yellow circles. Hg isotopes and associated data)
Figure 4. Regional map of the location of the North Atlantic Igneous Province (NAIP) and study area at 56 Ma
Fig.4
图 5 研究点位沉积汞的主要赋存相分析
The numbers are Pearson’s correlation coefficients (red. positive correlation; green. negative correlation); data from reference [99]
Figure 5. Dominant host phases of Hg at the study site
Fig.5
图 6 PETM事件邻近NAIP地区的碳同位素、汞浓度及TOC(TS、Fe)数据
Dashed lines indicate TOC=0.2 wt.%[51], Data for 25/11⁃17, Fur Island, BH09/2005, AECX from reference [55]; 22/10a⁃4, E⁃8X data from references [56,119]; 23/16b⁃9 data from reference [44]; 30 /14⁃1 data from reference [99]; Zumaia, Lussagnet, Serraduy, Esplugafreda data from reference [98]
Figure 6. Carbon isotope, Hg concentration and TOC (TS, Fe) data from neighboring NAIP areas during the PETM
Fig.6
图 7 PETM事件远离NAIP地区的碳同位素、汞浓度及TOC(Al、Fe)数据
Dashed lines indicate TOC=0.2%[51]; Hg, Al, Fe data for Wilson Lake, Ancora and 1262 from reference [99]; Hg and TOC data for Bass River from reference [55]; Hg and TOC data for Millville and Blake Nose from reference [97]; C isotope, Hg and TOC data for Dababiya from reference [96]; C isotope data for Ancora from reference [105]; for Millville, Wilson Lake from reference [123]; for Bass River from reference [20]; for Blake Nose from reference [86]; for 1262 from reference [11]
Figure 7. C isotope, Hg concentration and TOC (Al, Fe) data for PETM remote from the NAIP area
Fig.7
表 1 PETM汞研究地区信息表
Table 1. PETM Hg records
研究点位 位置 经纬度 古环境及古水深 氧化还原状态 氧化还原变化发生时间 25/11-17[55] 北海盆地 59°3′27″ N,2°29′7″ E 深海盆地 / / 22/10a-4[56] 北海盆地 57°44'8.47″ N,1°50'26.59″ E 深海盆地 / / 23/16b-9[44] 北海盆地 57°26′50.208″ N,02°08′27.624″ E 深海盆地 / / 30/14-1[99] 北海盆地 56°33′37″ N,2°38′08″ E 深海盆地 / / Fur Island[55] 北海盆地 56°49′51″ N,8°58′45″ E 浅海 缺氧[100](生物标志化合物) CIE期间 E-8X[56] 北海盆地 55°38′13.42″ N,04°59′11.96″ E 深海盆地 硫化[21](Mo同位素) CIE起始—主体期间 BH09/2005[55] 北冰洋 77°54′09″ N,16°12′59″ E 近岸盆地 缺氧[101](Th/U) CIE期间 ACEX[55] 北冰洋 87°52′12″ N,136°12′41″ E 浅海近岸[102](0~200 m) 硫化[102](Mo同位素) CIE主体阶段 Zumaia[98] 比利牛斯前陆盆地 43°18′4.5″ N,02°15′31.2″ W 深海盆地[103](1 000 m) 缺氧[103](遗迹化石) CIE期间 Lussagnet[98] 比利牛斯前陆盆地 43°46′4″ N,00°13′12″ W 浅海(碳酸岩台地) / / Serraduy[98] 比利牛斯前陆盆地 42°19′25″ N,00°34′ 20′ ′E 冲积平原—海岸平原 / / Esplugafreda[98] 比利牛斯前陆盆地 42°14′50″ N,00°45′13″ E 冲积平原 / / Ancora[99] 美国东部新泽西州 39°41′32″ N,74°50′56″ W 大陆架[104](110 m) 缺氧[105](底栖有孔虫) CIE起始—主体期间 Wilson Lake[99] 美国东部新泽西州 39°39′21″ N,75°02′52″ W 大陆架[104](90 m) 缺氧[106](氧化还原敏感细菌) CIE期间 Bass River[55] 美国东部新泽西州 39°36′42″ N,74°26′12″ W 大陆架[104](145 m) 缺氧[105](底栖有孔虫) CIE起始—主体期间 Millville[97] 美国东部新泽西州 39°24'0.00" N,75°4'48.00" W 大陆架[104](120 m) / / Blake Nose[97] 北大西洋 30°03.1860′ N,76°21.4712′ W 深海(1 500 m) / / Dababiya[96] 埃及 25°30′ N,32°31′ E 浅海(150~175 m) 缺氧[107](氧化还原敏感元素) CIE主体阶段 1262[99] 南大西洋 27°11′9″ S,1°34′37″ E 深海[108](3 600 m) 次氧化[108](MnEF) CIE开始约80 kyr  下载: 导出CSV
-
[1] IPCC. Intergovernmental Panel On Climate Change (IPCC). Climate change 2022-impacts, adaptation and vulnerability: Working group II contribution to the sixth assessment report of the intergovernmental panel on climate change[M]. UK: Cambridge University Press, 2023. [2] Le Quéré C, Andrew R M, Friedlingstein P, et al. Global carbon budget 2018[J]. Earth System Science Data, 2018, 10(4): 2141-2194. [3] Cui Y, Li M S, van Soelen E E, et al. Massive and rapid predominantly volcanic CO2 emission during the end-Permian mass extinction[J]. Proceedings of the National Academy of Sciences of the United States of America, 2021, 118(37): e2014701118. [4] McElwain J C, Wade-Murphy J, Hesselbo S P. Changes in carbon dioxide during an oceanic anoxic event linked to intrusion into Gondwana coals[J]. Nature, 2005, 435(7041): 479-482. [5] Adloff M, Greene S E, Parkinson I J, et al. Unravelling the sources of carbon emissions at the onset of Oceanic Anoxic Event (OAE) 1a[J]. Earth and Planetary Science Letters, 2020, 530: 115947. [6] Kuroda J, Ogawa N O, Tanimizu M, et al. Contemporaneous massive subaerial volcanism and Late Cretaceous Oceanic Anoxic Event 2[J]. Earth and Planetary Science Letters, 2007, 256(1/2): 211-223. [7] Foster G L, Hull P, Lunt D J, et al. Placing our current 'hyperthermal' in the context of rapid climate change in our geological past[J]. Philosophical Transactions of the Royal Society A: Mathematical, Physical and Engineering Sciences, 2018, 376(2130): 20170086. [8] Gutjahr M, Ridgwell A, Sexton P F, et al. Very large release of mostly volcanic carbon during the Palaeocene-Eocene Thermal Maximum[J]. Nature, 2017, 548(7669): 573-577. [9] McInerney F A, Wing S L. The Paleocene-Eocene Thermal Maximum: A perturbation of carbon cycle, climate, and biosphere with implications for the future[J]. Annual Review of Earth and Planetary Sciences, 2011, 39(1/2): 489-516. [10] Zachos J C, Dickens G R, Zeebe R E. An Early Cenozoic perspective on greenhouse warming and carbon-cycle dynamics[J]. Nature, 2008, 451(7176): 279-283. [11] Zachos J C, McCarren H, Murphy B, et al. Tempo and scale of Late Paleocene and Early Eocene carbon isotope cycles: Implications for the origin of hyperthermals[J]. Earth and Planetary Science Letters, 2010, 299(1/2): 242-249. [12] Dickens G R, O'neil J R, Rea D K, et al. Dissociation of oceanic methane hydrate as a cause of the carbon isotope excursion at the end of the Paleocene[J]. Paleoceanography and Paleoclimatology, 1995, 10(6): 965-971. [13] Zeebe R E, Lourens L J. Solar system chaos and the Paleocene-Eocene boundary age constrained by geology and astronomy[J]. Science, 2019, 365(6456): 926-929. [14] Westerhold T, Röhl U, Frederichs T, et al. Astronomical calibration of the Ypresian timescale: implications for seafloor spreading rates and the chaotic behavior of the solar system?[J]. Climate of the Past, 2017, 13(9): 1129-1152. [15] Murphy B H, Farley K A, Zachos J C. An extraterrestrial 3He-based timescale for the Paleocene-Eocene Thermal Maximum (PETM) from Walvis Ridge, IODP Site 1266[J]. Geochimica et Cosmochimica Acta, 2010, 74(17): 5098-5108. [16] Röhl U, Westerhold T, Bralower T J, et al. On the duration of the Paleocene-Eocene Thermal Maximum (PETM)[J]. Geochemistry, Geophysics, Geosystems, 2007, 8(12): Q12002. [17] Tierney J E, Zhu J, Li M S, et al. Spatial patterns of climate change across the Paleocene-Eocene Thermal Maximum[J]. Proceedings of the National Academy of Sciences of the United States of America, 2022, 119(42): e2205326119. [18] Miller K G, Browning J V, Schmelz W J, et al. Cenozoic sea-level and cryospheric evolution from deep-sea geochemical and continental margin records[J]. Science Advances, 2020, 6(20): eaaz1346. [19] Zachos J, Pagani M, Sloan L, et al. Trends, rhythms, and aberrations in global climate 65 Ma to present [J]. Science, 2001, 292(5517): 686-693. [20] John C M, Bohaty S M, Zachos J C, et al. North American continental margin records of the Paleocene-Eocene Thermal Maximum: Implications for global carbon and hydrological cycling[J]. Paleoceanography and Paleoclimatology, 2008, 23(2): PA2217. [21] Mariani E, Kender S, Hesselbo S P, et al. Large igneous province control on ocean anoxia and eutrophication in the North Sea at the Paleocene-Eocene Thermal Maximum[J]. Paleo-ceanography and Paleoclimatology, 2024, 39(4): e2023PA004756. [22] Sluijs A, Brinkhuis H, Schouten S, et al. Environmental precursors to rapid light carbon injection at the Palaeocene/Eocene boundary[J]. Nature, 2007, 450(7173): 1218-1221. [23] Alegret L, Ortiz S. Global extinction event in benthic forami-nifera across the Paleocene Eocene boundary at the Dababiya Stratotype section[J]. Micropaleontology, 2006, 52(5): 433-447. [24] Gingerich P D. Environment and evolution through the Paleocene-Eocene Thermal Maximum[J]. Trends in Ecology & Evolution, 2006, 21(5): 246-253. [25] Thomas E. Development of Cenozoic deep-sea benthic foraminiferal faunas in Antarctic waters[M]//Crame J A. Proceedings of the origins and evolution of the Antarctic biota. London: Geological Society, London, Special Publications, 1989, 47: 283-296. [26] Lowery C M, Bown P R, Fraass A J, et al. Ecological response of plankton to environmental change: thresholds for extinction[J]. Annual Review of Earth and Planetary Sciences, 2020, 48: 403-429. [27] Sluijs A, Brinkhuis H, Crouch E M, et al. Eustatic variations during the Paleocene-Eocene greenhouse world[J]. Paleo-ceanography and Paleoclimatology, 2008, 23(4): PA4216. [28] Schmitz B, Pujalte V. Abrupt increase in seasonal extreme precipitation at the Paleocene-Eocene boundary[J]. Geology, 2007, 35(3): 215-218. [29] Carmichael M J, Inglis G N, Badger M P S, et al. Hydrological and associated biogeochemical consequences of rapid global warming during the Paleocene-Eocene Thermal Maximum [J]. Global and Planetary Change, 2017, 157: 114-138. [30] Zachos J C, Röhl U, Schellenberg S A, et al. Rapid acidification of the ocean during the Paleocene-Eocene Thermal Maximum[J]. Science, 2005, 308(5728): 1611-1615. [31] Yao W Q, Paytan A, Wortmann U G. Large-scale ocean deoxygenation during the Paleocene-Eocene Thermal Maximum[J]. Science, 2018, 361(6404): 804-806. [32] Dickens G R. Down the Rabbit Hole: toward appropriate discussion of methane release from gas hydrate systems during the Paleocene-Eocene Thermal Maximum and other past hyperthermal events[J]. Climate of the Past, 2011, 7(3): 831-846. [33] Gu G S, Dickens G R, Bhatnagar G, et al. Abundant Early Palaeogene marine gas hydrates despite warm deep-ocean temperatures[J]. Nature Geoscience, 2011, 4(12): 848-851. [34] DeConto R M, Galeotti S, Pagani M, et al. Past extreme warming events linked to massive carbon release from thawing permafrost[J]. Nature, 2012, 484(7392): 87-91. [35] Lourens L J, Sluijs A, Kroon D, et al. Astronomical pacing of Late Palaeocene to Early Eocene global warming events[J]. Nature, 2005, 435(7045): 1083-1087. [36] Li M S, Bralower T J, Kump L R, et al. Astrochronology of the Paleocene-Eocene Thermal Maximum on the Atlantic Coastal Plain[J]. Nature Communications, 2022, 13(1): 5618. [37] Piedrahita V A, Galeotti S, Zhao X, et al. Orbital phasing of the Paleocene-Eocene Thermal Maximum[J]. Earth and Planetary Science Letters, 2022, 598: 117839. [38] Kent D V, Cramer B S, Lanci L, et al. A case for a comet impact trigger for the Paleocene/Eocene Thermal Maximum and carbon isotope excursion[J]. Earth and Planetary Science Letters, 2003, 211(1/2): 13-26. [39] Cramer B S, Kent D V. Bolide summer: The Paleocene/Eocene Thermal Maximum as a response to an extraterrestrial trigger [J]. Palaeogeography, Palaeoclimatology, Palaeoecology, 2005, 224(1/2/3): 144-166. [40] Schaller M F, Fung M K, Wright J D, et al. Impact ejecta at the Paleocene-Eocene boundary[J]. Science, 2016, 354(6309): 225-229. [41] Svensen H, Planke S, Malthe-Sørenssen A, et al. Release of methane from a volcanic basin as a mechanism for initial Eocene global warming[J]. Nature, 2004, 429(6991): 542-545. [42] Storey M, Duncan R A, Swisher C C. Paleocene-Eocene Thermal Maximum and the opening of the northeast Atlantic[J]. Science, 2007, 316(5824): 587-589. [43] Storey M, Duncan R A, Tegner C. Timing and duration of volcanism in the North Atlantic Igneous Province: Implications for geodynamics and links to the Iceland hotspot[J]. Chemical Geology, 2007, 241(3/4): 264-281. [44] Jin S M, Kemp D B, Yin R S, et al. Mercury isotope evidence for protracted North Atlantic magmatism during the Paleocene-Eocene Thermal Maximum[J]. Earth and Planetary Science Letters, 2023, 602: 117926. [45] Berndt C, Planke S, Alvarez Zarikian C A, et al. Shallow-water hydrothermal venting linked to the Palaeocene-Eocene Thermal Maximum[J]. Nature Geoscience, 2023, 16(9): 803-809. [46] Jones S M, Hoggett M, Greene S E, et al. Large igneous province thermogenic greenhouse gas flux could have initiated Paleocene-Eocene Thermal Maximum climate change[J]. Nature Communications, 2019, 10: 5547. [47] Matsumoto H, Coccioni R, Frontalini F, et al. Long-term Aptian marine osmium isotopic record of Ontong Java Nui activity[J]. Geology, 2021, 49(9): 1148-1152. [48] Westerhold T, Marwan N, Drury A J, et al. An astronomically dated record of Earth's climate and its predictability over the last 66 million years[J]. Science, 2020, 369(6509): 1383-1387. [49] Hu D P, Li M H, Zhang X L, et al. Large mass-independent sulphur isotope anomalies link stratospheric volcanism to the Late Ordovician mass extinction[J]. Nature Communications, 2020, 11(1): 2297. [50] Li R C, Shen S Z, Xia X P, et al. Atmospheric ozone destruction and the end-Permian crisis: Evidence from multiple sulfur isotopes[J]. Chemical Geology, 2024, 647: 121936. [51] Grasby S E, Them T R, Chen Z H, et al. Mercury as a proxy for volcanic emissions in the geologic record[J]. Earth-Science Reviews, 2019, 196: 102880. [52] Shen J, Feng Q L, Algeo T J, et al. Sedimentary host phases of mercury (Hg) and implications for use of Hg as a volcanic proxy[J]. Earth and Planetary Science Letters, 2020, 543: 116333. [53] Shen J, Yin R S, Zhang S, et al. Intensified continental chemical weathering and carbon-cycle perturbations linked to volcanism during the Triassic-Jurassic transition[J]. Nature Communications, 2022, 13(1): 299. [54] Zhou T, Pan X, Sun R Y, et al. Cryogenian interglacial greenhouse driven by enhanced volcanism: Evidence from mercury records[J]. Earth and Planetary Science Letters, 2021, 564: 116902. [55] Jones M T, Percival L M E, Stokke E W, et al. Mercury anomalies across the Palaeocene-Eocene Thermal Maximum[J]. Climate of the Past, 2019, 15(1): 217-236. [56] Kender S, Bogus K, Pedersen G K, et al. Paleocene/Eocene carbon feedbacks triggered by volcanic activity[J]. Nature Communications, 2021, 12(1): 5186. [57] Ernst R E, Youbi N. How large igneous provinces affect global climate, sometimes cause mass extinctions, and represent natural markers in the geological record[J]. Palaeogeography Palaeoclimatology Palaeoecology, 2017, 478: 30-52. [58] Saunders A D, Fitton J G, Kerr A C, et al. The North Atlantic Igneous Province[M]//Mahoney J J, Coffin M F. Large Igneous Provinces: Continental, oceanic, and planetary flood volcanism. Washington, D.C.: American Geophysical Union, 1997, 100: 45-93. [59] Eldholm O, Thomas E. Environmental impact of volcanic margin formation[J]. Earth and Planetary Science Letters, 1993, 117(3/4): 319-329. [60] Wilkinson C M, Ganerød M, Hendriks B W H, et al. Compilation and appraisal of geochronological data from the North Atlantic Igneous Province (NAIP)[C]//Péron-Pinvidic G, Hopper J R, Funck T, et al. Proceedings of the NE Atlantic region: A reappraisal of crustal structure, tectonostratigraphy and magmatic evolution, London: Geological Society, Special Publications, 2017, 447: 69-103. [61] Larsen L M, Waagstein R, Pedersen A K, et al. Trans-Atlantic correlation of the Palaeogene volcanic successions in the Faeroe Islands and East Greenland[J]. Journal of the Geological Society, 1999, 156(6) 1081-1095. [62] Larsen L M, Fitton J G, Pedersen A K J L. Paleogene volcanic ash layers in the Danish Basin: compositions and source areas in the North Atlantic Igneous Province [J].Lithos, 2003, 71(1): 47-80. [63] Egger H, Brückl E. Gigantic volcanic eruptions and climatic change in the Early Eocene[J]. International Journal of Earth Sciences, 2006, 95(6): 1065-1070. [64] Svensen H, Planke S, Corfu F. Zircon dating ties NE Atlantic sill emplacement to initial Eocene global warming[J]. Journal of the Geological Society, 2010, 167(3): 433-436. [65] Frieling J, Svensen H H, Planke S, et al. Thermogenic methane release as a cause for the long duration of the PETM[J]. Proceedings of the National Academy of Sciences of the United States of America, 2016, 113(43): 12059-12064. [66] Schmitz B, Peucker-Ehrenbrink B, Heilmann-Clausen C, et al. Basaltic explosive volcanism, but no comet impact, at the Paleocene-Eocene boundary: high-resolution chemical and isotopic records from Egypt, Spain and Denmark[J]. Earth and Planetary Science Letters, 2004, 225(1/2): 1-17. [67] Wieczorek R, Fantle M S, Kump L R, et al. Geochemical evidence for volcanic activity prior to and enhanced terrestrial weathering during the Paleocene Eocene Thermal Maximum[J]. Geochimica Et Cosmochimica Acta, 2013, 119: 391-410. [68] Jones M T, Stokke E W, Rooney A D, et al. Tracing North Atlantic volcanism and seaway connectivity across the Paleocene-Eocene Thermal Maximum (PETM)[J]. Climate of the Past, 2023, 19(8): 1623-1652. [69] Leavitt S W. Annual volcanic carbon dioxide emission: An estimate from eruption chronologies[J]. Environmental Geology, 1982, 4(1): 15-21. [70] Caldeira K, Rampino M R. Carbon dioxide emissions from Deccan volcanism and a K/T boundary greenhouse effect[J]. Geophysical Research Letters, 1990, 17(9): 1299-1302. [71] Jones M T, Jerram D A, Svensen H H, et al. The effects of large igneous provinces on the global carbon and sulphur cycles[J]. Palaeogeography Palaeoclimatology Palaeoecology, 2016, 441: 4-21. [72] Svensen H, Planke S, Jamtveit B, et al. Seep carbonate formation controlled by hydrothermal vent complexes: A case study from the Vøring Basin, the Norwegian Sea[J]. Geo-Marine Letters, 2003, 23(3/4): 351-358. [73] Heimdal T H, Svensen H H, Ramezani J, et al. Large-scale sill emplacement in Brazil as a trigger for the end-Triassic crisis[J]. Scientific Reports, 2018, 8(1): 141. [74] Schroeder W H, Munthe J. Atmospheric mercury: An overview[J]. Atmospheric Environment, 1998, 32(5): 809-822. [75] Futsaeter G, Wilson S. The UNEP global mercury assessment: Sources, emissions and transport[C]//Proceedings of the E3S Web of Conferences, Les Ulis: EDP Sciences, 2013: 36001. [76] Selin N E. Global biogeochemical cycling of mercury: A review[J]. Annual Review of Environment and Resources, 2009, 34: 43-63. [77] Varekamp J C, Buseck P R. Mercury emissions from Mount St Helens during September 1980[J]. Nature, 1981, 293(5833): 555-556. [78] Pyle D M, Mather T A. The importance of volcanic emissions for the global atmospheric mercury cycle[J]. Atmospheric Environment, 2003, 37(36): 5115-5124. [79] Selin N E, Jacob D J, Yantosca R M, et al. Global 3-D land-ocean-atmosphere model for mercury: Present-day versus preindustrial cycles and anthropogenic enrichment factors for deposition[J]. Global Biogeochemical Cycles, 2008, 22(2): GB2011. [80] Mason R P. Mercury emissions from natural processes and their importance in the global mercury cycle[M]//Mason R, Pirrone N. Mercury fate and transport in the global atmosphere: Emissions, measurements and models. Boston: Springer, 2009: 173-191. [81] Grasby S E, Liu X J, Yin R S, et al. Toxic mercury pulses into Late Permian terrestrial and marine environments[J]. Geology, 2020, 48(8): 830-833. [82] Bergquist B A. Mercury, volcanism, and mass extinctions[J]. Proceedings of the National Academy of Sciences of the United States of America, 2017, 114(33): 8675-8677. [83] Demers J D, Blum J D, Zak D R. Mercury isotopes in a forested ecosystem: Implications for air-surface exchange dynamics and the global mercury cycle[J]. Global Biogeochemical Cycles, 2013, 27(1): 222-238. [84] Kongchum M, Hudnall W H, Delaune R D. Relationship between sediment clay minerals and total mercury[J]. Journal of Environmental Science and Health, Part A, 2011, 46(5): 534-539. [85] Mason R P, Fitzgerald W F, Morel F M M. The biogeochemical cycling of elemental mercury: Anthropogenic influences[J]. Geochimica et Cosmochimica Acta, 1994, 58(15): 3191-3198. [86] Dunkley Jones T, Lunt D J, Schmidt D N, et al. Climate model and proxy data constraints on ocean warming across the Paleocene-Eocene Thermal Maximum[J]. Earth-Science Reviews, 2013, 125: 123-145. [87] Ravichandran M. Interactions between mercury and dissolved organic matter: A review[J]. Chemosphere, 2004, 55(3): 319-331. [88] Shen J, Algeo T J, Planavsky N J, et al. Mercury enrichments provide evidence of Early Triassic volcanism following the end-Permian mass extinction[J]. Earth-Science Reviews, 2019, 195: 191-212. [89] Percival L M E, Witt M L I, Mather T A, et al. Globally enhanced mercury deposition during the end-Pliensbachian extinction and Toarcian OAE: A link to the Karoo-Ferrar Large Igneous Province[J]. Earth and Planetary Science Letters, 2015, 428: 267-280. [90] 龚清,凌明星,郑旺. 汞稳定同位素示踪地质记录中火山活动的应用[J]. 中国科学:地球科学,2024,54(5):1459-1483. Gong Qing, Ling Mingxing, Zheng Wang. Applications of mercury stable isotopes for tracing volcanism in the geologic record[J]. Science China Earth Sciences, 2024, 54(5): 1459-1483. [91] Bergquist B A, Blum J D. Mass-dependent and -independent fractionation of Hg isotopes by photoreduction in aquatic systems[J]. Science, 2007, 318(5849): 417-420. [92] Blum J D, Sherman L S, Johnson M W. Mercury isotopes in earth and environmental sciences[J]. Annual Review of Earth and Planetary Sciences, 2014, 42: 249-269. [93] 郑旺,赵亚秋,孙若愚,等. 汞的稳定同位素分馏机理[J]. 矿物岩石地球化学通报,2021,40(5):1087-1116. Zheng Wang, Zhao Yaqiu, Sun Ruoyu, et al. The mechanism of mercury stable isotope fractionation: A review[J]. Bulletin of Mineralogy, Petrology and Geochemistry, 2021, 40(5): 1087-1116. [94] Zambardi T, Sonke J E, Toutain J P, et al. Mercury emissions and stable isotopic compositions at Vulcano Island (Italy)[J]. Earth and Planetary Science Letters, 2009, 277(1/2): 236-243. [95] Grasby S E, Shen W J, Yin R S, et al. Isotopic signatures of mercury contamination in latest Permian oceans[J]. Geology, 2017, 45(1): 55-58. [96] Keller G, Mateo P, Punekar J, et al. Environmental changes during the Cretaceous-Paleogene mass extinction and Paleocene-Eocene Thermal Maximum: Implications for the Anthropocene[J]. Gondwana Research, 2018, 56: 69-89. [97] Liu Z Y, Horton D E, Tabor C, et al. Assessing the contributions of comet impact and volcanism toward the climate perturbations of the Paleocene-Eocene Thermal Maximum[J]. Geophysical Research Letters, 2019, 46(24): 14798-14806. [98] Tremblin M, Khozyem H, Adatte T, et al. Mercury enrichments of the Pyrenean foreland basins sediments support enhanced volcanism during the Paleocene-Eocene Thermal Maximum (PETM)[J]. Global and Planetary Change, 2022, 212: 103794. [99] Jin S M, Kemp D B, Shen J, et al. Spatiotemporal distribution of global mercury enrichments through the Paleocene-Eocene Thermal Maximum and links to volcanism[J]. Earth-Science Reviews, 2024, 248: 104647. [100] Schoon P L, Heilmann-Clausen C, Schultz B P, et al. Warming and environmental changes in the eastern North Sea Basin during the Palaeocene-Eocene Thermal Maximum as revealed by biomarker lipids[J]. Organic Geochemistry, 2015, 78: 79-88. [101] Dypvik H, Riber L, Burca F, et al. The Paleocene-Eocene Thermal Maximum (PETM) in Svalbard: Clay mineral and geochemical signals[J]. Palaeogeography, Palaeoclimatology, Palaeoecology, 2011, 302(3/4): 156-169. [102] Dickson A J, Cohen A S, Coe A L. Seawater oxygenation during the Paleocene-Eocene Thermal Maximum[J]. Geology, 2012, 40(7): 639-642. [103] Rodríguez-Tovar F J, Uchman A, Alegret L, et al. Impact of the Paleocene-Eocene Thermal Maximum on the macrobenthic community: Ichnological record from the Zumaia section, northern Spain[J]. Marine Geology, 2011, 282(3/4): 178-187. [104] Wagner C L, Stassen P, Thomas E, et al. Magnetofossils and benthic foraminifera record changes in food supply and deoxygenation of the coastal marine seafloor during the Paleocene-Eocene Thermal Maximum[J]. Paleoceanography and Paleoclimatology, 2022, 37(10): e2022PA004502. [105] Stassen P, Thomas E, Speijer R P. Integrated stratigraphy of the Paleocene-Eocene Thermal Maximum in the New Jersey Coastal Plain: Toward understanding the effects of global warming in a shelf environment[J]. Paleoceanography and Paleoclimatology, 2012, 27(4): PA4210. [106] Lippert P C, Zachos J C. A biogenic origin for anomalous fine-grained magnetic material at the Paleocene-Eocene boundary at Wilson Lake, New Jersey[J]. Paleoceanography and Paleoclimatology, 2007, 22(4): PA4104. [107] Schulte P, Scheibner C, Speijer R P. Fluvial discharge and sea-level changes controlling black shale deposition during the Paleocene-Eocene Thermal Maximum in the Dababiya Quarry section, Egypt[J]. Chemical Geology, 2011, 285(1/2/3/4): 167-183. [108] Chun C O J, Delaney M L, Zachos J C. Paleoredox changes across the Paleocene-Eocene Thermal Maximum, Walvis Ridge (ODP Sites 1262, 1263, and 1266): Evidence from Mn and U enrichment factors[J]. Paleoceanography and Paleoclimatology, 2010, 25(4): 9A4202. [109] Shen J, Algeo T J, Chen J B, et al. Mercury in marine Ordovician/Silurian boundary sections of South China is sulfide-hosted and non-volcanic in origin[J]. Earth and Planetary Science Letters, 2019, 511: 130-140. [110] Sanei H, Grasby S E, Beauchamp B. Latest Permian mercury anomalies[J]. Geology, 2012, 40(1): 63-66. [111] Mazrui N M, Jonsson S, Thota S, et al. Enhanced availability of mercury bound to dissolved organic matter for methylation in marine sediments[J]. Geochimica et Cosmochimica Acta, 2016, 194: 153-162. [112] Grasby S E, Sanei H, Beauchamp B, et al. Mercury deposition through the Permo-Triassic Biotic Crisis [J]. Chemical Geology, 2013, 351: 209-216. [113] Bower J, Savage K S, Weinman B, et al. Immobilization of mercury by pyrite (FeS2)[J]. Environmental Pollution, 2008, 156(2): 504-514. [114] Han D S, Orillano M, Khodary A, et al. Reactive iron sulfide (FeS)-supported ultrafiltration for removal of mercury (Hg(II)) from water[J]. Water Research, 2014, 53: 310-321. [115] Kalvoda J, Kumpan T, Qie W, et al. Mercury spikes at the Devonian-Carboniferous boundary in the eastern part of the Rhenohercynian Zone (central Europe) and in the South China Block[J]. Palaeogeography, Palaeoclimatology, Palaeoecology, 2019, 531: 109221. [116] Shen J, Yu J X, Chen J B, et al. Mercury evidence of intense volcanic effects on land during the Permian-Triassic transition[J]. Geology, 2019, 47(12): 1117-1121. [117] Bouffard A, Amyot M. Importance of elemental mercury in lake sediments[J]. Chemosphere, 2009, 74(8): 1098-1103. [118] Sánchez D M, Quejido A J, Fernández M, et al. Mercury and trace element fractionation in Almaden soils by application of different sequential extraction procedures[J]. Analytical and Bioanalytical Chemistry, 2005, 381(8): 1507-1513. [119] Kender S, Stephenson M H, Riding J B, et al. Marine and terrestrial environmental changes in NW Europe preceding carbon release at the Paleocene–Eocene transition[J]. Earth and Planetary Science Letters, 2012, 353-354: 108-120. [120] Harding I C, Charles A J, Marshall J E A, et al. Sea-level and salinity fluctuations during the Paleocene-Eocene Thermal Maximum in Arctic Spitsbergen [J]. Earth and Planetary Science Letters, 2011, 303(1/2): 97-107. [121] Dunkley Jones T D, Manners H R, Hoggett M, et al. Dynamics of sediment flux to a bathyal continental margin section through the Paleocene-Eocene Thermal Maximum [J]. Climate of the Past, 2018, 14(7): 1035-1049. [122] Khozyem H, Adatte T, Spangenberg J E, et al. New geochemical constraints on the Paleocene-Eocene Thermal Maximum: Dababiya GSSP, Egypt[J]. Palaeogeography Palaeoclimatology Palaeoecology, 2015, 429: 117-135. [123] Wright J D, Schaller M F. Evidence for a rapid release of carbon at the Paleocene-Eocene Thermal Maximum[J]. Proceedings of the National Academy of Sciences of the United States of America, 2013, 110(40): 15908-15913. [124] Frieling J, Mather T A, März C, et al. Effects of redox variability and early diagenesis on marine sedimentary Hg records[J]. Geochimica et Cosmochimica Acta, 2023, 351: 78-95. [125] Them T R, Jagoe C H, Caruthers A H, et al. Terrestrial sources as the primary delivery mechanism of mercury to the oceans across the Toarcian Oceanic Anoxic Event (Early Jurassic)[J]. Earth and Planetary Science Letters, 2019, 507: 62-72. [126] Shen J, Yin R S, Algeo T J, et al. Mercury evidence for combustion of organic-rich sediments during the end-Triassic crisis[J]. Nature Communications, 2022, 13(1): 1307. [127] Sluijs A, Schouten S, Pagani M, et al. Subtropical arctic ocean temperatures during the Palaeocene/Eocene Thermal Maximum [J]. Nature, 2006, 441(7093): 610-613. [128] Gleason J D, Blum J D, Moore T C, et al. Sources and cycling of mercury in the paleo Arctic Ocean from Hg stable isotope variations in Eocene and Quaternary sediments [J]. Geochimica Et Cosmochimica Acta, 2017, 197: 245-262. [129] Storme J Y, Dupuis C, Schnyder J, et al. Cycles of humid-dry climate conditions around the P/E boundary: New stable isotope data from terrestrial organic matter in Vasterival section (NW France) [J]. Terra Nova, 2012, 24(2): 114-122. -

 点击查看大图
计量
- 文章访问数: 272
- HTML全文浏览量: 36
- PDF下载量: 44
- 被引次数: 0